. 2022 Sep 6;119(36):e2116841119.
doi: 10.1073/pnas.2116841119. Epub 2022 Aug 29.

Diploid-dominant life cycles characterize the early evolution of Fungi

Affiliations

Diploid-dominant life cycles characterize the early evolution of Fungi

Kevin R Amses et al. Proc Natl Acad Sci U S A. .

Abstract

Most of the described species in kingdom Fungi are contained in two phyla, the Ascomycota and the Basidiomycota (subkingdom Dikarya). As a result, our understanding of the biology of the kingdom is heavily influenced by traits observed in Dikarya, such as aerial spore dispersal and life cycles dominated by mitosis of haploid nuclei. We now appreciate that Fungi comprises numerous phylum-level lineages in addition to those of Dikarya, but the phylogeny and genetic characteristics of most of these lineages are poorly understood due to limited genome sampling. Here, we addressed major evolutionary trends in the non-Dikarya fungi by phylogenomic analysis of 69 newly generated draft genome sequences of the zoosporic (flagellated) lineages of true fungi. Our phylogeny indicated five lineages of zoosporic fungi and placed Blastocladiomycota, which has an alternation of haploid and diploid generations, as branching closer to the Dikarya than to the Chytridiomyceta. Our estimates of heterozygosity based on genome sequence data indicate that the zoosporic lineages plus the Zoopagomycota are frequently characterized by diploid-dominant life cycles. We mapped additional traits, such as ancestral cell-cycle regulators, cell-membrane- and cell-wall-associated genes, and the use of the amino acid selenocysteine on the phylogeny and found that these ancestral traits that are shared with Metazoa have been subject to extensive parallel loss across zoosporic lineages. Together, our results indicate a gradual transition in the genetics and cell biology of fungi from their ancestor and caution against assuming that traits measured in Dikarya are typical of other fungal lineages.

Keywords: aquatic fungi; life cycle evolution; phylogenomics; plesiomorphy.


Conflict of interest statement

The authors declare no competing interest.

Figures

Fig. 1.
Fig. 1.
Illustrated life cycles observed in fungi. (A) In haplontic life cycles mitosis is limited to the haploid phase, with plasmogamy of gametes followed by meiosis. (B) In diplontic life cycles, mitosis only occurs in the diploid phase with haploid cells only functioning as gametes. (C) Life cycles may alternative between haploid and diploid mitotic phases and may show morphological differences between ploidies as in Allomyces. (D) The dikaryotic life cycle is an alternative to alternation of haploid and diploid generations which lacks diploid mitosis and instead has a phase with two nuclear genotypes undergoing synchronous division.
Fig. 2.
Fig. 2.
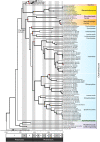
Annotated, time-calibrated concatenated ML tree of kingdom Fungi, including 68 newly sequenced genomes of zoosporic fungi, based on 197,423 amino acid positions. All bootstrap support values are 100%; edge thickness indicates gCF support, and red diamonds indicate clades that were not present in ASTRAL tree. Blue shading are all taxa in the most species diverse phylum Chytridiomycota. Fossil-based calibration points were used to constrain minimum ages of the MRCA of several clades following Chang et al. (75): Blastocladiomycota = 407 Ma, Chytridiomycota = 407 Ma, Ascomycota = 407 Ma, Basidiomycota = 330 Ma, Mucorales = 315 Ma. A range of dates were used to constrain ages of the MRCA of Dikarya (500 to 650 Ma). The time scale in the chronogram is in millions of years before present with epochs abbreviated in the following order: T: Tonian, C: Cryogenian, E: Ediacaran, C: Cambrian, O: Ordovician, S: Silurian, D: Devonian, C: Carboniferous, P: Permian, T: Triassic, J: Jurassic, C: Cretaceous, P: Paleogene.
Fig. 3.
Fig. 3.
Summary of ploidy inference for 112 assemblies and their underlying short reads. Curves (AD) or points (E) are colored by ploidy state (diploid+: blue; haploid: red, uncertain: gray). (A) Histogram of k-mer counts (k = 23) generated from short-read data of Lobosporangium transversale CBS455.65 showing the unimodal distribution typical of read libraries derived from haploid genomes. Single peak corresponds to relatively high coverage k-mers alone and is approximately centered at mean sequencing depth. (B) Histogram of k-mer counts (k = 23) generated from short-read data of A. javanicus California 12 showing the bimodal distribution typical of read libraries derived from diploid genomes. Peaks respectively correspond to relatively high coverage k-mers that cover only homozygous positions and low-coverage k-mers that also cover heterozygous positions. Peaks are approximately centered at mean sequencing depth and 1/2 mean sequencing depth, respectively. (C) Canonical haploid AF histogram (from L. transversale) showing right-skewed unimodal distribution corresponding to SNPs introduced by sequencing error. (D) Canonical diploid AF histogram (from A. javanicus) showing unimodal distribution centered at 0.50 corresponding to SNPs introduced by heterozygous positions on homologous chromosomes. (E) Scatter plot of genomes by weighted mean of filtered SNP density across L50 contig set (y axis) and proportion of filtered SNPs from L50 contig set falling within 1 SD of the mean of each genome’s theoretical binomial distribution (x axis). Ellipses are normal ellipses around diploid+- or haploid-annotated points. Error bars represent SD. Dashed lines indicate the origin.
Fig. 4.
Fig. 4.
Best concatenated ML tree annotated with inferred ploidy. Tips are colored according to the ploidy of each genome they represent (red: haploid, blue: diploid, gray: uncertain). Pie charts on internal nodes represent ancestral state probabilities inferred from marginal ancestral state reconstruction of ploidy status across Fungi. Major clades are labeled with bold text and alternating gray–white insets. Major clades are further annotated with the enlarged pie charts that show the ancestral state probabilities of their ploidy status inferred via marginal ancestral state reconstruction (solid, and present on tree edge) or stochastic ancestral state reconstruction (transparent, and absent on tree edge).
Fig. 5.
Fig. 5.
Best concatenated ML tree showing the distribution of life history or genetic character states across zoosporic fungi. Tracks are colored or abbreviated according to the legend (Bottom Right). Genetic traits were characterized across the 137-taxon dataset through searches with gene-specific HMMs. SNP densities (square root-scaled) across draft genomes for which short reads were available are displayed on the outermost track (bars) and colored according to inferred ploidy. Inferred or presumed ploidy in cases where short reads were not available, and SNP density was not calculated are also indicated (points).

References

    1. James T. Y., Berbee M. L., No jacket required--new fungal lineage defies dress code: Recently described zoosporic fungi lack a cell wall during trophic phase. BioEssays 34, 94–102 (2012). - PubMed
    1. Richards T. A., Leonard G., Wideman J. G., What defines the “Kingdom” Fungi? Microbiol. Spectr. 5, 10.1128/microbiolspec.FUNK-0044-2017 (2017). - DOI - PMC - PubMed
    1. Anderson J. B., Kohn L. M., “Dikaryons, diploids, and evolution” in Sex in Fungi: Molecular Determination and Evolutionary Implications, Heitman J., Kronstad J. W., Taylor J., Casselton L., Eds. (ASM Press, 2007), pp. 333–348.
    1. Prostak S. M., Robinson K. A., Titus M. A., Fritz-Laylin L. K., The actin networks of chytrid fungi reveal evolutionary loss of cytoskeletal complexity in the fungal kingdom. Curr. Biol. 31, 1192–1205.e6 (2021). - PMC - PubMed
    1. Medina E. M., Turner J. J., Gordân R., Skotheim J. M., Buchler N. E., Punctuated evolution and transitional hybrid network in an ancestral cell cycle of fungi. eLife 5, e09492 (2016). - PMC - PubMed

Publication types