. 2022 Sep 6;119(36):e2205608119.
doi: 10.1073/pnas.2205608119. Epub 2022 Aug 29.

Adaptive exchange sustains cullin-RING ubiquitin ligase networks and proper licensing of DNA replication

Affiliations

Adaptive exchange sustains cullin-RING ubiquitin ligase networks and proper licensing of DNA replication

Yaru Zhang et al. Proc Natl Acad Sci U S A. .

Abstract

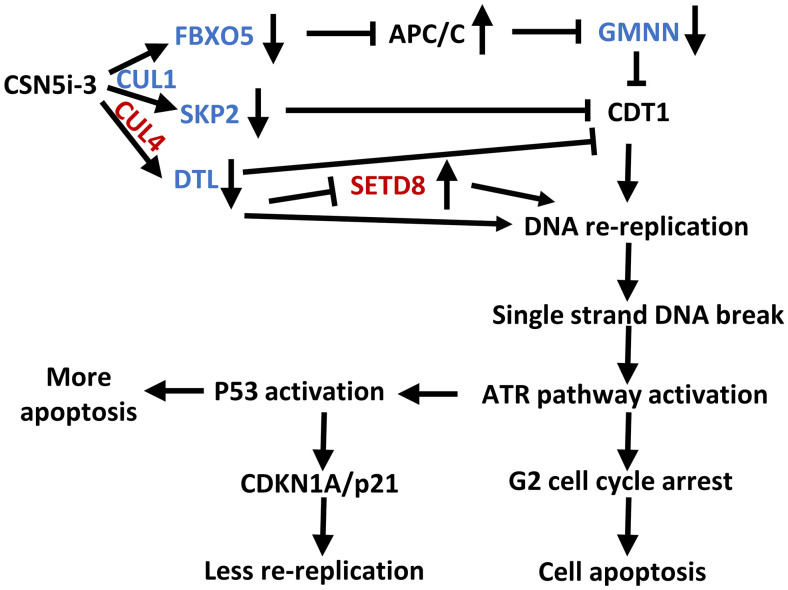
Cop9 signalosome (CSN) regulates the function of cullin-RING E3 ubiquitin ligases (CRLs) by deconjugating the ubiquitin-like protein NEDD8 from the cullin subunit. To understand the physiological impact of CSN function on the CRL network and cell proliferation, we combined quantitative mass spectrometry and genome-wide CRISPR interference (CRISPRi) and CRISPR activation (CRISPRa) screens to identify factors that modulate cell viability upon inhibition of CSN by the small molecule CSN5i-3. CRL components and regulators strongly modulated the antiproliferative effects of CSN5i-3, and in addition we found two pathways involved in genome integrity, SCFFBXO5-APC/C-GMNN and CUL4DTL-SETD8, that contribute substantially to the toxicity of CSN inhibition. Our data highlight the importance of CSN-mediated NEDD8 deconjugation and adaptive exchange of CRL substrate receptors in sustaining CRL function and suggest approaches for leveraging CSN inhibition for the treatment of cancer.

Keywords: CRISPR screen; CSN5i-3; Cop9 signalosome; DNA replication; deneddylation.


Conflict of interest statement

Competing interest statement: Y.Z. is an employee of Amgen. D.L., C.-M. L., and R.J.D. are employees and shareholders of Amgen. J.L. was an employee of Amgen. J.R.L. was an employee and shareholder of Amgen. M.J. consults for Maze Therapeutics and Gate Biosciences. S.D.G. is the founder, president, CEO, and CTO of Proteas Bioanalytics, Inc. The work described in the paper does not have any direct financial implications for Amgen.

Figures

Fig. 1.
Fig. 1.
CSN5i-3 is an uncompetitive inhibitor of CSN and results in degradation of CRL substrate receptors. (A) Chemical structure of CSN5i-3. (B) CSN5i-3 is an uncompetitive inhibitor of CSN. Assays were conducted at 0.033 nM CSN. Error bars represent ±SD; n = 3. (C) CSN5i-3 promotes accumulation of NEDD8-conjugated cullins. K562 cells were treated with indicated amounts of pevonedistat or CSN5i-3 for 4 h and immunoblotted to detect the indicated cullins and GAPDH. Representative Western blots are shown; n = 3. (D) CSN5i-3 is poorly reversible. K562 cells were treated with 1 μM pevonedistat or 1 μM CSN5i-3 for 24 h, washed, and either harvested for analysis (0) or cultured for an additional 24 to 48 h, after which cullins were evaluated as in C. Control represents untreated cells. Representative Western blots are shown; n = 3. (E) Top 20 proteins down-regulated by CSN5i-3. K562 cells were treated with 1 µM CSN5i-3 for 2, 8, or 24 h and proteins in whole cell lysate were quantified by mass spectrometry (MS2). The three bars for each protein represent CSN5i-3 treatment for 2, 8, and 24 h (Top to Bottom). CRL adaptors and substrate receptors (red), Ub E2s for CRL (green), and CSN subunits (purple) are highlighted. Relative normalized expression of mRNA encoding the corresponding proteins in cells treated with CSN5i-3 vs. DMSO were determined by RNA-seq and are shown on the Right. n = 4 (MS2) or 2 (RNA-seq). (F) Proteins up-regulated by CSN5i-3. This is the same as in E except that the top 20 up-regulated proteins are shown. CRL substrate proteins are highlighted in red.
Fig. 2.
Fig. 2.
Genome-wide CRISPRi and CRISPRa screens. (A) Schematic of CSN5i-3 sensitivity screens and equation for calculation of sensitivity phenotypes (ρ). Doubling differences refer to differences in population doublings between untreated and treated populations. (B) CSN5i-3 sensitivity phenotypes (ρ) for all genes from two biological replicates (n = 2) of genome-scale CRISPRi and CRISPRa screens. The ρ-value for each gene was calculated using the average of the top three scoring sgRNAs by absolute value. Negative control genes were generated from nontargeting control sgRNAs. For the CRISPRa screen, sensitivity phenotypes were calculated relative to the same untreated population. (C) CRISPRi and CRISPRa CSN5i-3 sensitivity phenotypes of all genes. Phenotype values are the average of two biological replicates (n = 2) from B. CSN subunits are highlighted in orange. Some CRL genes with strong phenotypes are in blue. (D) Genes from the CRISPRi (Left) and CRISPRa (Right) screens that yielded most enhanced sensitivity to CSN5i-3. Genes are ranked by their sensitivity phenotypes (ρ) and color coded according to cellular pathways; n = 2.
Fig. 3.
Fig. 3.
Genetic validation of screen results by individual sgRNAs. (A) CRISPRi screen phenotypes are reproduced by sgRNAs targeting individual genes. K562 cells were infected with individual sgRNAs (BFP+) targeting the indicated genes (two top-scoring sgRNAs in the original screen for each gene; SI Appendix, Table S3) and mixed at a 1:1 ratio with parental K562 cells. The cell mixtures were treated with DMSO or 1 μM CSN5i-3, grown for 10 d, and %BFP+ cells was quantified every other day by flow cytometry. Genes whose repression exacerbated or suppressed CSN5i-3 sensitivity in the original screen are color coded red or blue, respectively. Error bars represent ±SD; n = 2 technical replicates for each sgRNA. Results of the two sgRNAs for each gene were averaged. (B) Extent of gene repression elicited by individual sgRNAs vary. CRISPRi efficiency was evaluated by qRT-PCR, and the relative mRNA levels are shown. The same sgRNAs as in A were used. The direct competition assay results observed in A could be affected by the differences in CRISPRi efficiency of the individual genes. Error bars represent ±SD; n = 4 technical replicates for each sgRNA. Results of the two sgRNAs for each gene were averaged. (C) E1, E2, and proteasome gene CRISPRi constructs have divergent effects on CSN5i-3 sensitivity. Volcano plots of CRISPRi phenotype of different sets of genes are highlighted; n = 2. (D) SgRNA repression of CRL substrate receptor genes have varied effects on CSN5i-3 sensitivity. Substrate receptors are colored black, orange, blue, and red for CRL1, CRL2, CRL3, and CRL4, respectively; n = 2. (E) Immunoblot confirmation of CRL substrate receptor depletion upon CSN5i-3 treatment of K562 cells. Representative Western blots are shown; n ≥ 2.
Fig. 4.
Fig. 4.
The SCFFBXO5–APC/C–GMNN pathway is a key mediator of CSN5i-3 toxicity. (A) CSN5i-3 induces overreplication of DNA. K562 cells treated with DMSO or 1 μM CSN5i-3 for 1 to 3 d were pulse labeled with bromodeoxyuridine (BrdU), fixed, stained with anti-BrdU and DAPI, and analyzed for cell cycle distribution by flow cytometry (Upper). (Lower) Same as Upper except that cells were stained with fluorescent antibodies to phosphohistone H3 (pHH3) to label cells in mitosis, prior to flow cytometry. Representative graphs are shown; n ≥ 3. (B) Repression of FBXO5 or GMNN sensitizes cells to CSN5i-3. This is the same as in Fig. 3A except that sgRNAs (BFP+; the top-scoring one in the original screen; see SI Appendix, Table S3) targeting FBXO5 or GMNN were used. Error bars represent ±SD; n = 2 to 3. (C) CSN5i-3 induces degradation of FBXO5 and GMNN. CHX chase was performed for 0 to 24 h on K562 cells treated with and without 1 μM CSN5i-3. Error bars represent ±SD; n = 3. (D) GMNN depletion by CSN5i-3 is strongly modulated by FBXO5. A total of 1 μM CSN5i-3 was added for 0 to 3 d to unmodified K562 cells (wild type [WT]) or K562 cells in which FBXO5 was repressed by CRISPRi or overexpressed (o/e; stable integration of cDNA). Representative Western blots are shown; n ≥ 2. (E and F) Transgene-driven overexpression and sgRNA-mediated repression of FBXO5 or GMNN have opposite effects on induction of apoptosis and overreplication by CSN5i-3 in K562 cells. Cells were treated with DMSO or 1 μM CSN5i-3 for 3 d. Apoptosis (E) was estimated by measurement of activated Caspase 3. Cell cycle stage/DNA content (F) was evaluated as in A. GMNN protein levels in untransfected wild-type, repressed, and overexpressed cells are shown by Western blot. Error bars represent ±SD; n = 3. (G) FBXO5 knockdown, GMNN knockdown, and CSN5i-3 treatment have similar effects on cell cycle profile and overreplication. Cells were treated with siRNA against either GMNN or FBXO5 or with 1 µM CSN5i-3 and incubated for 3 d. Cell cycle stage and DNA content were evaluated as in A. FBXO5 and GMNN protein levels in HCT116 cells treated with indicated siRNAs are shown by Western blot. n = 3. (H) Depletion of FBXO5 by CSN5i-3 is not dependent on the SCFβ-TrCP pathway. K562 cells were stably transfected with constructs that express wild-type FBXO5 or the indicated mutants. All three mutants shown lack the phosphodegron bound by SCFβ-TrCP. Transfected cells were treated with DMSO, 50 μg/mL CHX, or CHX plus 1 µM CSN5i-3 for 4 h before immunoblotting. The asterisk denotes the target bands, and the fast-migrating bands below these bands are nonspecific. Representative Western blots are shown; n = 3. (I) Proposed mechanism of CSN5i-3 toxicity through the SCFFBXO5–APC/C–GMNN axis.
Fig. 5.
Fig. 5.
The CRL4DTL–SETD8 pathway contributes to CSN5i-3 toxicity. (A and B) Repression and overexpression of DTL have opposite effects on induction of overreplication and apoptosis by CSN5i-3. Unmodified K562 cells (WT) or cells in which either DTL or SETD8 was repressed (CRISPRi) or overexpressed (o/e; stable integration of cDNA) were treated for 3 (A) or 1 to 4 (B) days with DMSO or 1 µM CSN5i-3. Cell cycle stage/DNA content (A) and apoptosis (B) were evaluated by fluorescence-activated cell sorting (FACS) as in Fig. 4. Error bars represent ±SD; n = 3. (C) CSN5i-3 blocks SETD8 degradation. CHX chase was performed for 0 to 24 h in K562 cells treated with or without 1 µM CSN5i-3. Error bars represent ±SD; n = 3. (D) Up-regulation of SETD8 by CSN5i-3 is not an indirect consequence of G2 arrest. K562 cells were synchronized at the G1/S boundary by double thymidine (dT) block and then released in the presence of either DMSO or 1 µM CSN5i-3. At the indicated times, samples were withdrawn, and cells were assessed by FACS to determine cell cycle stage, or cell lysates were prepared and evaluated for content of SETD8 or its reaction product H4K20Me1 by immunoblotting. Representative Western blots are shown; n = 3. (E) SETD8 modulates cytotoxicity of CSN5i-3. This is the same as in Fig. 3A except that K562 cells in which SETD8 was repressed (CRISPRi; BFP+) or overexpressed (o/e; GFP+) were mixed with parental K562 cells. SETD8 protein levels in wild-type, repressed, and overexpressed cells are shown by Western blot. Error bars represent ±SD; n = 3. (F) SETD8 contributes to the CSN5i-3 sensitivity of DTL-deficient cells. This is the same as in Fig. 3A except that K562 cells with CRISPRi repression of both DTL and SETD8 (GFP+BFP+) were mixed 1:1 at time 0 with cells with CRISPRi for only DTL (GFP+). Error bars represent ±SD; n = 3. (G) DTL deficiency renders cells sensitive to CSN5i-3 by mechanisms in addition to SETD8 accumulation. This is the same as in F except that cells with CRISPRi repression of both DTL and SETD8 (GFP+BFP+) were cocultured with CRISPRi for only SETD8 (GFP+). Error bars represent ±SD; n = 3. (H) Proposed mechanism of CSN5i-3 toxicity through the CRL4DTL–SETD8 axis.
Fig. 6.
Fig. 6.
CSN5i-3 chemical–genetic interactions are reproducible and found in multiple cell lines. (A) FBXO5, GMNN, and DTL exert their effects through CDT1. Direct competition assays of the indicated gene plus CDT1 double CRISPRi (GFP+BFP+) cells vs. the indicated single CRISPRi cells (GFP+) were performed. CSN5i-3 sensitivity conferred by FBXO5, GMNN, or DTL repression (Fig. 4B and SI Appendix, Fig. S4A) was relieved by corepression of CDT1. Error bars represent ±SD; n = 3. (B) CSN5i-3 activates signaling through the ATR and ATM DNA damage response pathways. All cells were treated with 1 µM CSN5i-3 for 3 d. Representative Western blots are shown; n = 3. (C) CSN5i-3 and the specific ATR inhibitor BAY-1895344 synergistically inhibit cell proliferation. K562 cells were treated with drugs for 3 d, and proliferation was assessed by CellTiter-Glo assay; n = 4. Synergy was calculated using SynergyFinder (77) using the ZIP (zero interaction potency) model. The most synergistic area score, which represents the most synergistic 3-by-3 dose window in a dose–response matrix, is shown. Scores larger than 10 are generally considered to be indicative of synergy. (D) CSN5i-3 and the ATM inhibitor KU-60019 are synergistic in HCT116 cells with wild-type p53. This is the same as in C, except that CSN5i-3 and KU-60019 were evaluated in TP53 wild-type and null HCT116 cell lines; n = 2. (E) Apoptosis analysis of TP53 wild-type and null HCT116 cells. Apoptosis was estimated by measurement of activated Caspase 3. Error bars represent ±SD; n = 3. (F) Loss of p53 exacerbates DNA overreplication in HCT116 cells. Cell cycle stage/DNA content was evaluated by FACS as in Fig. 4A. Error bars represent ±SD; n = 3. (G) p53 is required for CSN5i-3–mediated induction of p21 in HCT116 cells. Cells were treated with 1 µM CSN5i-3 or pevonedistat for 24 h. Representative Western blots are shown; n = 3.
Fig. 7.
Fig. 7.
Proposed model for induction of DNA overreplication and cell apoptosis by CSN5i-3. Upward and downward arrows indicate directional effects of CSN5i-3 on protein levels. Blue and red indicate genes whose CRISPRi-mediated repression renders cells more sensitive and resistant to CSN5i-3, respectively.

Similar articles

Cited by

References

    1. Cardozo T., Pagano M., The SCF ubiquitin ligase: Insights into a molecular machine. Nat. Rev. Mol. Cell Biol. 5, 739–751 (2004). - PubMed
    1. Willems A. R., Schwab M., Tyers M., A hitchhiker’s guide to the cullin ubiquitin ligases: SCF and its kin. Biochim. Biophys. Acta 1695, 133–170 (2004). - PubMed
    1. Deshaies R. J., Joazeiro C. A., RING domain E3 ubiquitin ligases. Annu. Rev. Biochem. 78, 399–434 (2009). - PubMed
    1. Soucy T. A., et al. , An inhibitor of NEDD8-activating enzyme as a new approach to treat cancer. Nature 458, 732–736 (2009). - PubMed
    1. Enchev R. I., Schulman B. A., Peter M., Protein neddylation: Beyond cullin-RING ligases. Nat. Rev. Mol. Cell Biol. 16, 30–44 (2015). - PMC - PubMed

Publication types

MeSH terms