. 2022 Sep 28;96(18):e0102422.
doi: 10.1128/jvi.01024-22. Epub 2022 Aug 29.

Nonstructural Protein 1 of Variant PEDV Plays a Key Role in Escaping Replication Restriction by Complement C3

Affiliations

Nonstructural Protein 1 of Variant PEDV Plays a Key Role in Escaping Replication Restriction by Complement C3

Baochao Fan et al. J Virol. .

Abstract

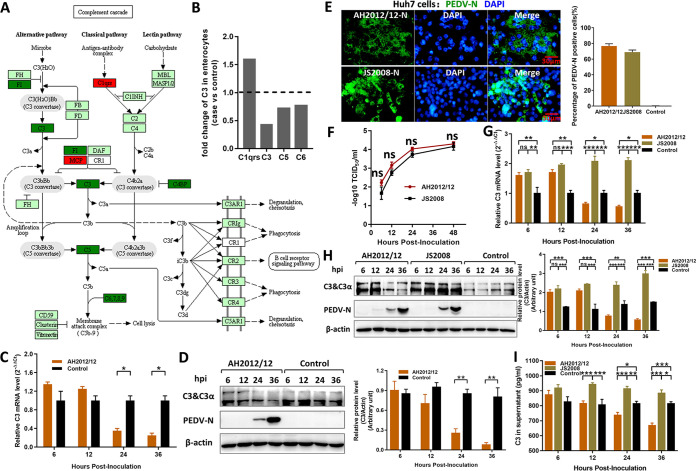
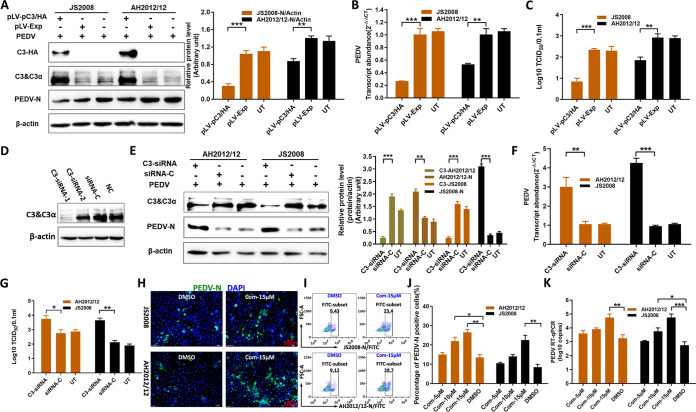
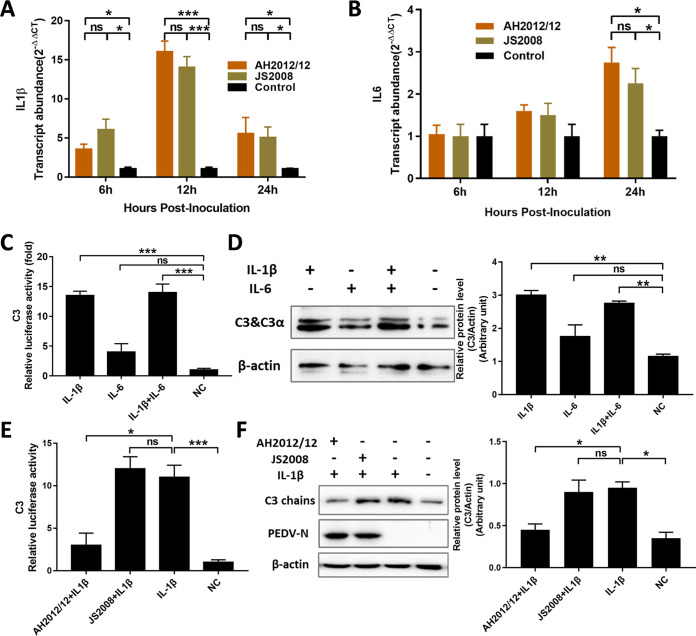
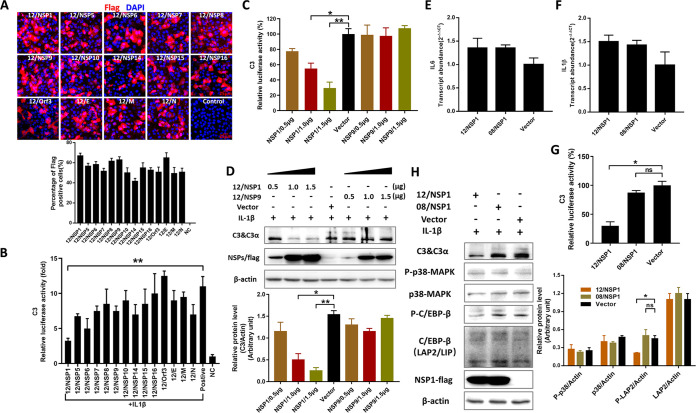
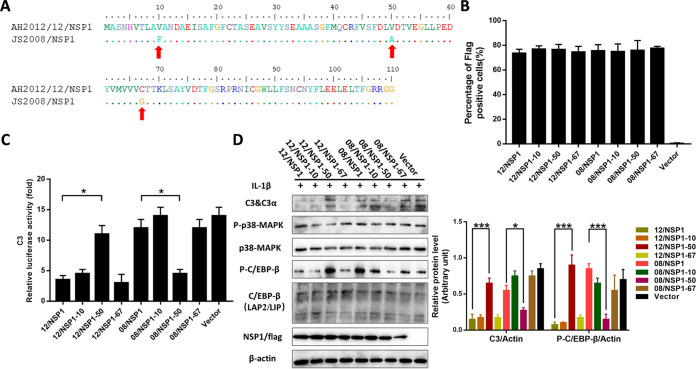
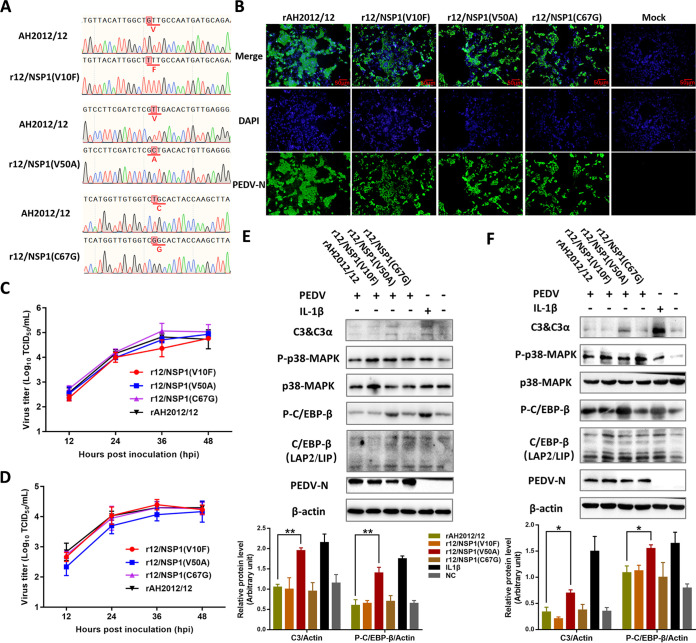
Zoonotic coronaviruses represent an ongoing threat to public health. The classical porcine epidemic diarrhea virus (PEDV) first appeared in the early 1970s. Since 2010, outbreaks of highly virulent PEDV variants have caused great economic losses to the swine industry worldwide. However, the strategies by which PEDV variants escape host immune responses are not fully understood. Complement component 3 (C3) is considered a central component of the three complement activation pathways and plays a crucial role in preventing viral infection. In this study, we found that C3 significantly inhibited PEDV replication in vitro, and both variant and classical PEDV strains induced high levels of interleukin-1β (IL-1β) in Huh7 cells. However, the PEDV variant strain reduces C3 transcript and protein levels induced by IL-1β compared with the PEDV classical strain. Examination of key molecules of the C3 transcriptional signaling pathway revealed that variant PEDV reduced C3 by inhibiting CCAAT/enhancer-binding protein β (C/EBP-β) phosphorylation. Mechanistically, PEDV nonstructural protein 1 (NSP1) inhibited C/EBP-β phosphorylation via amino acid residue 50. Finally, we constructed recombinant PEDVs to verify the critical role of amino acid 50 of NSP1 in the regulation of C3 expression. In summary, we identified a novel antiviral role of C3 in inhibiting PEDV replication and the viral immune evasion strategies of PEDV variants. Our study reveals new information on PEDV-host interactions and furthers our understanding of the pathogenic mechanism of this virus. IMPORTANCE The complement system acts as a vital link between the innate and the adaptive immunity and has the ability to recognize and neutralize various pathogens. Activation of the complement system acts as a double-edged sword, as appropriate levels of activation protect against pathogenic infections, but excessive responses can provoke a dramatic inflammatory response and cause tissue damage, leading to pathological processes, which often appear in COVID-19 patients. However, how PEDV, as the most severe coronavirus causing diarrhea in piglets, regulates the complement system has not been previously reported. In this study, for the first time, we identified a novel mechanism of a PEDV variant in the suppression of C3 expression, showing that different coronaviruses and even different subtype strains differ in regulation of C3 expression. In addition, this study provides a deeper understanding of the mechanism of the PEDV variant in immune escape and enhanced virulence.

Keywords: C/EBP-β; NSP1; PEDV; complement C3; replication.


Conflict of interest statement

The authors declare no conflict of interest.

Figures

FIG 1
FIG 1
PEDV variant decreases C3 expression in vitro. (A) Single-cell sequencing of the jejunum from piglets infected with PEDV variant strain AH2012/12 was previously performed, and the complement cascade was determined using intestinal enterocytes obtained from the virus-infected versus control groups. Dark green and dark red indicate significantly downregulated and upregulated genes, respectively. (B) Fold changes of major complement components were analyzed according to the transcriptome data. In vitro, variant strain AH2012/12 was inoculated into IPEC-J2 cells at 1 MOI, and the infected cells were analyzed using the transcript level for C3 mRNA by relative qRT-PCR (C) and the protein level for C3 and PEDV-N proteins by Western blotting (D). Huh7 cells were inoculated with two PEDV strains at 1 MOI. The susceptibilities of Huh7 cells to PEDV strains were detected using IFs and flow cytometry at 24 hpi (E) and growth curve assays (F). The infected Huh7 cells were analyzed to determine the transcript level for C3 mRNA (G) and the protein levels for C3 and PEDV-N proteins (H). (I) The content of C3 in the supernatant was determined by an ELISA kit. The relative expression levels of target proteins according to the grayscale of β-actin in cells were also assayed. For the data, two-way ANOVA multiple comparisons tests were used to compare the data from different treatment groups. Values are means ± SD. *, P < 0.05; **, P < 0.01; ***, P < 0.001; n = 3. The error bars indicate the standard deviation.
FIG 2
FIG 2
C3 significantly inhibits PEDV replication. Huh7 cells were transfected with pLV-pC3/HA or pLV-Exp at 1.5 μg/well in a 24-well plate. After 24 h, all cells were inoculated with AH2012/12 or JS2008 at 1 MOI for another 24 h. Then, the infected cells were analyzed to determine the protein expression levels for C3 chains, C3-HA and PEDV-N proteins (A), the transcript level for PEDV mRNA (B), and the virus titers of the supernatants (C). (D) In the C3 knockdown assays, two synthetic C3-siRNAs were transfected into Huh7 cells, and the C3 expression levels were analyzed. Subsequently, cells were transfected with C3-siRNA-1 and siRNA-C for 24 h, and then all cells were inoculated with AH2012/12 or JS2008 for another 24 h. The infected cells were analyzed to determine the protein levels of C3 and PEDV-N (E), PEDV mRNA (F), and the virus titers of supernatants (G). Additionally, C3-AH2012/12 and C3-JS2008 in panel E represent the relative expression levels of protein C3 according to the grayscale of β-actin with different treatments in the AH2012/12- and JS2008-infected groups, respectively. Huh7 cells were inoculated with Com at different concentrations for 6 h, and all cells were inoculated with AH2012/12 or JS2008 at 0.1 MOI for another 24 h. The infected cells were detected by using IFs (H), flow cytometry (I and J), and the gene copy numbers of PEDV (K). For the data, two-way ANOVA multiple comparisons tests were used to compare the data from different treatment groups. Values are means ± SD. *, P < 0.05; **, P < 0.01; ***, P < 0.001; n = 3. The error bars indicate the standard deviation.
FIG 3
FIG 3
PEDV variant suppresses C3 expression induced by IL-1β. The transcript levels of IL-1β (A) and IL-6 (B) were determined in cells inoculated with AH2012/12 or JS2008 at different time points. The effects of IL-1β and/or IL-6 on C3 promoter activities (C) and expressions (D) were detected in Huh7 cells. When the effect of viral infection on IL-1β-induced C3 was determined, virus (MOI = 1) and cytokines were inoculated into cells together for 24 h. Then, all of the cells were lysed to assay the C3 luciferase activities (E) and the expression levels of C3 and PEDV-N proteins (F). The relative expression levels of target proteins according to the grayscale of β-actin in cells were also assayed. For panels A and B, two-way ANOVA multiple comparisons tests were used to compare the data from different treatment groups; for panels C to F, analyses were performed by Student’s t test. Values are means ± SD. *, P < 0.05; **, P < 0.01; ***, P < 0.001; n = 3. The error bars indicate the standard deviation.
FIG 4
FIG 4
PEDV variant suppresses C3 transcription by inhibiting C/EBP-β phosphorylation. (A) Huh7 cells were inoculated with 1 MOI of AH2012/12 or JS2008, and at 24 hpi, the percentages of PEDV-positive cells were determined by flow cytometry. (B) Then, all cells were lysed to assay the expression levels of different proteins. (C) PEDV and IL-1β were inoculated into cells together for 24 h, and the percentages of PEDV-positive cells were determined by flow cytometry. (D) Then, all cells were lysed to assay the expression levels of different proteins. The relative expression levels of target proteins according to the grayscale of β-actin in cells were also assayed. For panels B and D, two-way ANOVA multiple comparisons tests were used to compare the data from different treatment groups. Values are means ± SD. *, P < 0.05; **, P < 0.01; ***, P < 0.001; n = 3. The error bars indicate the standard deviation.
FIG 5
FIG 5
NSP1 of the PEDV variant inhibits the phosphorylation of C/EBP-β. Huh7 cells were transfected with the C3 promoter luciferase reporter constructs, alone or together with AH2012/12 nonstructural or structural protein-expressed vectors, and then treated with IL-1β. A portion of the cells were fixed and the expression levels of viral proteins were determined using IFs and flow cytometry (A), and another portion of the cells were lysed and the C3 luciferase activities were measured (B). 12/NSP1 or 12/NSP9 with different concentrations were transfected into Huh7 cells, treated with IL-1β. Then, the C3 luciferase activities (C) and the expression levels of C3 protein (D) were assayed. Recombinant vectors 12/NSP1 or 08/NSP1 were transfected into Huh7 cells, and the transcript levels of IL-6 (E) and IL-1β (F) were determined. Huh7 cells were transfected with 12/NSP1, 08/NSP1, or empty vector. After 24 h, all cells were inoculated with IL-1β for another 24 h and were then lysed to assay the C3 luciferase activities (G) and the expression levels of different proteins (H). The relative expression levels of target proteins according to the grayscale of β-actin in cells were also assayed. For panels B to G, analyses were performed by Student's t test; for panel H, two-way ANOVA multiple comparisons tests were used to compare the data from different treatment groups. Values are means ± SD. *, P < 0.05; **, P < 0.01; ***, P < 0.001; n = 3. The error bars indicate the standard deviation.
FIG 6
FIG 6
Amino acid 50 of NSP1 plays a role in regulating C3 expression. (A) Amino acid sequence alignment of AH2012/12 and JS2008 NSP1 revealed three amino acids mutations V10F, V50A, and C67G. Huh7 cells were transfected with the mutant vectors of AH2012/12 and JS2008 NSP1 proteins. After 24 h, the percentages of NSP1-expressed cells were determined by flow cytometry (B); the same treated cells were inoculated with 10 ng/mL IL-1β for another 24 h and then lysed to assay the C3 luciferase activities (C) and the expression levels of different proteins (D). The relative expression levels of target proteins according to the grayscale of β-actin in cells were also assayed. For panel C, analyses were performed by Student's t test; for panel D, two-way ANOVA multiple comparisons tests were used to compare the data from different treatment groups. Values are means ± SD. *, P < 0.05; **, P < 0.01; ***, P < 0.001; n = 3. The error bars indicate the standard deviation.
FIG 7
FIG 7
C3 regulation of NSP1 amino acid 50 at the viral level. (A) Three mutant strains, r12/NSP1 (V10F), r12/NSP1 (V50A), and r12/NSP1 (C67G), were constructed using the variant strain AH2012/12 as a backbone. The mutants were used to inoculate Vero cells at 1 MOI. (B) The specific fluorescence of N protein was detected using IFs at 24 hpi. The growth curves of viruses in Vero (C) and Huh7 (D) cells were determined using the virus titers at different time points after viral infection. Huh7 (E) and IPEC-J2 (F) cells were infected with the recombinant viruses or inoculated with IL-1β alone as the positive control for 24 h. Then, all cells were lysed to assay the expression levels of different proteins. The relative expression levels of target proteins according to the grayscale of β-actin in cells were also assayed. For panels E and F, two-way ANOVA multiple comparisons tests were used to compare the data from different treatment groups. Values are means ± SD. *, P < 0.05; **, P < 0.01; ***, P < 0.001; n = 3. The error bars indicate the standard deviation.

Similar articles

Cited by

References

    1. Ghebrehiwet B. 2016. The complement system: an evolution in progress. F1000Res 5:2840. 10.12688/f1000research.10065.1. - DOI - PMC - PubMed
    1. Kolev M, Le Friec G, Kemper C. 2014. Complement–tapping into new sites and effector systems. Nat Rev Immunol 14:811–820. 10.1038/nri3761. - DOI - PubMed
    1. Carroll MC. 2004. The complement system in regulation of adaptive immunity. Nat Immunol 5:981–986. 10.1038/ni1113. - DOI - PubMed
    1. Walport MJ. 2001. Complement. N Engl J Med 344:1058–1066. 10.1056/NEJM200104053441406. - DOI - PubMed
    1. Roozendaal R, Carroll MC. 2006. Emerging patterns in complement-mediated pathogen recognition. Cell 125:29–32. 10.1016/j.cell.2006.03.018. - DOI - PubMed

Publication types