. 2022 Aug 29;13(1):5068.
doi: 10.1038/s41467-022-32586-5.

Deep learning image segmentation reveals patterns of UV reflectance evolution in passerine birds

Affiliations

Deep learning image segmentation reveals patterns of UV reflectance evolution in passerine birds

Yichen He et al. Nat Commun. .

Abstract

Ultraviolet colouration is thought to be an important form of signalling in many bird species, yet broad insights regarding the prevalence of ultraviolet plumage colouration and the factors promoting its evolution are currently lacking. In this paper, we develop a image segmentation pipeline based on deep learning that considerably outperforms classical (i.e. non deep learning) segmentation methods, and use this to extract accurate information on whole-body plumage colouration from photographs of >24,000 museum specimens covering >4500 species of passerine birds. Our results demonstrate that ultraviolet reflectance, particularly as a component of other colours, is widespread across the passerine radiation but is strongly phylogenetically conserved. We also find clear evidence in support of the role of light environment in promoting the evolution of ultraviolet plumage colouration, and a weak trend towards higher ultraviolet plumage reflectance among bird species with ultraviolet rather than violet-sensitive visual systems. Overall, our study provides important broad-scale insight into an enigmatic component of avian colouration, as well as demonstrating that deep learning has considerable promise for allowing new data to be brought to bear on long-standing questions in ecology and evolution.


Conflict of interest statement

The authors declare no competing interests.

Figures

Fig. 1
Fig. 1. The performance of predictions (N = 5094) from DeepLabv3+ and classic methods.
The tested classic methods are thresholding, region growing, Chan-Vese and graph cut. a IOU, b Precision, and c Recall are used to evaluate the performance. Asterisks indicate evidence for comparing the predictions of classic methods to the predictions of DeepLabv3 (ns: p > 0.05; *: p ≤ 0.05; **: p ≤ 0.01; ***: p ≤ 0.001; ****: p ≤ 0.0001). In box plots, a box indicates the median and first and third quartile, whiskers indicate range of data and points indicate outliers. Source data are provided as a Source data file.
Fig. 2
Fig. 2. Examples of images segmented by DeepLabv3+.
Images of the best, 50th, 75th and 95th percentile (ranked by metrics from high to low; from i to iv) and 4 worst predictions (from v to viii) based on a IOU, b precision and c recall. The IOU, precision and recall (from left to right) are displayed on the top right corner of each image. Blue is correctly predicted by the model (True positive); red is the non-plumage area that has been classified as plumage area by the model (False positive); green is the plumage area that has been classified as non-plumage area (False negative).
Fig. 3
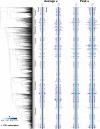
Fig. 3. The phylogenetic distribution of UV colouration in passerine birds.
Blue bars indicate the relative contribution of ultraviolet reflectance to plumage colouration (as measured by u values) of female and male individuals for 4545 species of passerine birds. Purple dots on the end of bars (‘UV+ colouration’) indicate the occurrence of detectable peaks in UV reflectance possibly occurring in combination with other colours (e.g. UV-yellow). Source data are provided as a Source data file.
Fig. 4
Fig. 4. Predictors of UV colouration in passerine birds.
Box plots summarise the posterior marginal distributions for all fixed-effects from Bayesian phylogenetic mixed models (two-sided tests, no adjustments for multiple tests) applied over a sample of 100 phylogenetic trees. Box widths represent the interquartile range, the median is shown as a vertical line within each box, and whiskers denote the 95% credibility interval of the distribution. Asterisks indicate evidence for a non-zero effect of the relevant variable. *P < 0.05; **P < 0.01; ***P < 0.001. M, male; UVS, ultraviolet sensitive. Peak u and UV+ colouration results correspond to thresholds of 25% and 5%, respectively. Results for other thresholds are given in Supplementary Table 4. Source data are provided as a Source data file.
Fig. 5
Fig. 5. Examples of using polygons to segment plumage areas of specimens.
a A specimen is segmented using a single polygon. b A specimen is segmented using multiple polygons. c A specimen is segmented using nested polygons as the eye is not plumage area and is excluded using a nested polygon.

References

    1. Cuthill IC, et al. The biology of color. Science. 2017;357:eaan0221. doi: 10.1126/science.aan0221. - DOI - PubMed
    1. Caro T, Koneru M. Towards an ecology of protective coloration. Biol. Rev. 2021;96:611–641. doi: 10.1111/brv.12670. - DOI - PubMed
    1. Endler JA. Signals, signal conditions, and the direction of evolution. Am. Nat. 1992;139:S125–S153. doi: 10.1086/285308. - DOI
    1. Endler JA. Some general comments on the evolution and design of animal communication systems. Philos. Trans. R. Soc. Lond. Ser. B. 1993;340:215–225. doi: 10.1098/rstb.1993.0060. - DOI - PubMed
    1. Endler JA. The color of light in forests and its implications. Ecol. Monogr. 1993;63:1–27. doi: 10.2307/2937121. - DOI

Publication types