. 2022 Aug 29;13(8):744.
doi: 10.1038/s41419-022-05186-w.

Activation of pancreatic stellate cells attenuates intracellular Ca2+ signals due to downregulation of TRPA1 and protects against cell death induced by alcohol metabolites

Affiliations

Activation of pancreatic stellate cells attenuates intracellular Ca2+ signals due to downregulation of TRPA1 and protects against cell death induced by alcohol metabolites

Agnieszka A Kusiak et al. Cell Death Dis. .

Abstract

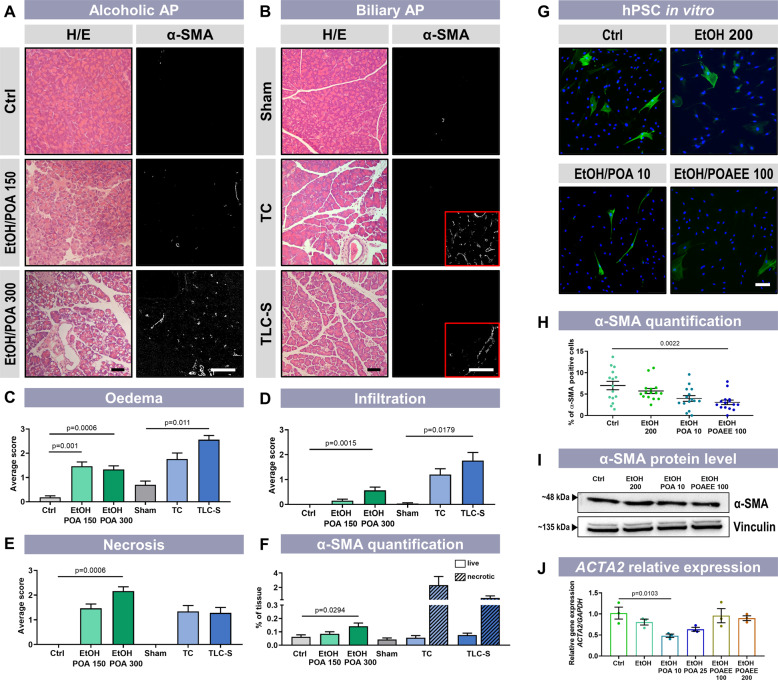
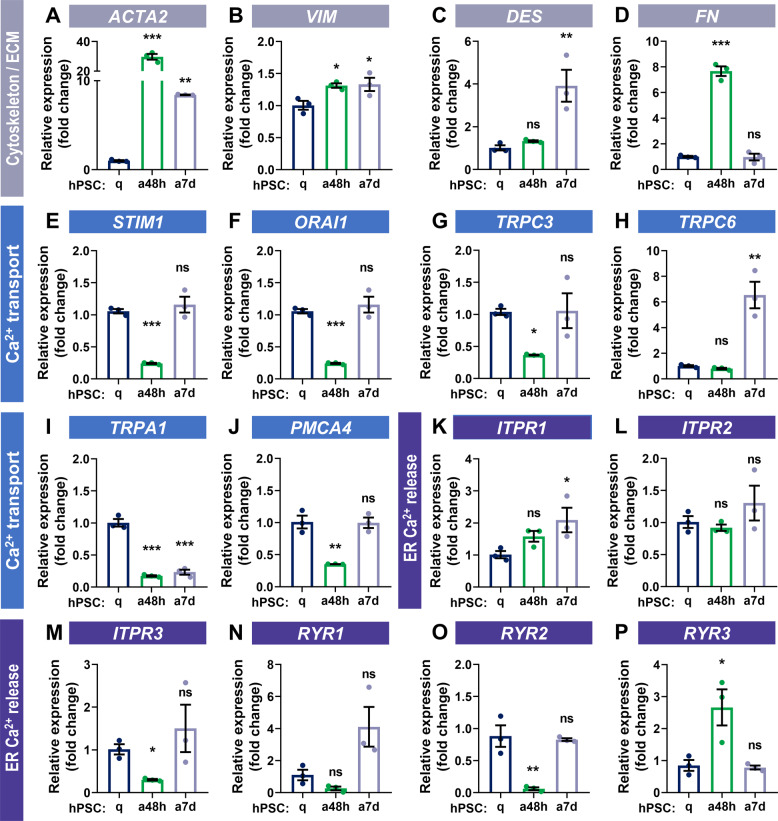
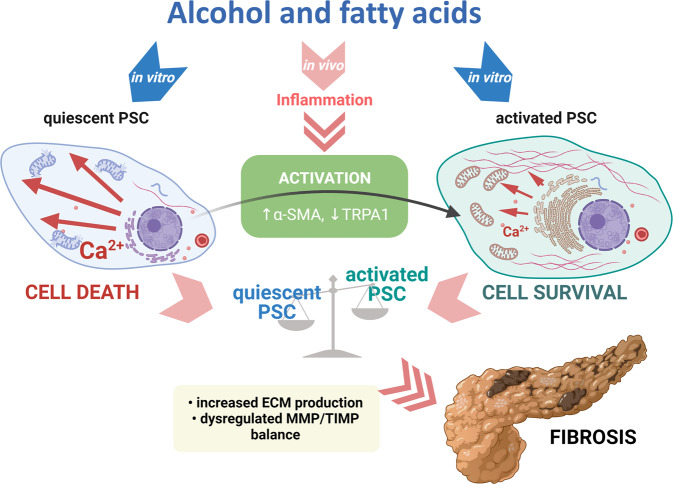
Alcohol abuse, an increasing problem in developed societies, is one of the leading causes of acute and chronic pancreatitis. Alcoholic pancreatitis is often associated with fibrosis mediated by activated pancreatic stellate cells (PSCs). Alcohol toxicity predominantly depends on its non-oxidative metabolites, fatty acid ethyl esters, generated from ethanol and fatty acids. Although the role of non-oxidative alcohol metabolites and dysregulated Ca2+ signalling in enzyme-storing pancreatic acinar cells is well established as the core mechanism of pancreatitis, signals in PSCs that trigger fibrogenesis are less clear. Here, we investigate real-time Ca2+ signalling, changes in mitochondrial potential and cell death induced by ethanol metabolites in quiescent vs TGF-β-activated PSCs, compare the expression of Ca2+ channels and pumps between the two phenotypes and the consequences these differences have on the pathogenesis of alcoholic pancreatitis. The extent of PSC activation in the pancreatitis of different aetiologies has been investigated in three animal models. Unlike biliary pancreatitis, alcohol-induced pancreatitis results in the activation of PSCs throughout the entire tissue. Ethanol and palmitoleic acid (POA) or palmitoleic acid ethyl ester (POAEE) act directly on quiescent PSCs, inducing cytosolic Ca2+ overload, disrupting mitochondrial functions, and inducing cell death. However, activated PSCs acquire remarkable resistance against ethanol metabolites via enhanced Ca2+-handling capacity, predominantly due to the downregulation of the TRPA1 channel. Inhibition or knockdown of TRPA1 reduces EtOH/POA-induced cytosolic Ca2+ overload and protects quiescent PSCs from cell death, similarly to the activated phenotype. Our results lead us to review current dogmas on alcoholic pancreatitis. While acinar cells and quiescent PSCs are prone to cell death caused by ethanol metabolites, activated PSCs can withstand noxious signals and, despite ongoing inflammation, deposit extracellular matrix components. Modulation of Ca2+ signals in PSCs by TRPA1 agonists/antagonists could become a strategy to shift the balance of tissue PSCs towards quiescent cells, thus limiting pancreatic fibrosis.


Conflict of interest statement

The authors declare no competing interests.

Figures

Fig. 1
Fig. 1. EtOH/POA and EtOH/POAEE induce Ca2+ responses and deplete intracellular stores in hPSCs.
A hPSCs loaded with Fluo-4-AM (Ca2+ probe): left—green fluorescence of Fluo-4; right—transmitted light. Scale bar: 40 µm. B Sample trace showing cytosolic Ca2+ responses in an hPSC to bradykinin (test for the physiological phenotype). C Cytosolic Ca2+ responses (average traces ± SEM) in hPSCs to 200 mM EtOH (n = 42, N = 5); control (average traces ± SEM) shows that the application of extracellular solution alone (NaHEPES with 1 mM Ca2+, n = 30, N = 3) does not trigger any Ca2+ responses in hPSCs. D Cytosolic Ca2+ responses (average traces ± SEM) in hPSCs to different concentrations of EtOH/POA [mM/µM]: 0 (Ctrl, same as in C, n = 30, N = 3), 10 (n = 21, N = 3), 25 (n = 24, N = 3), 50 (n = 29, N = 3) and 100 (n = 29, N = 3). E Cytosolic Ca2+ responses (average traces ± SEM) in hPSCs to EtOH/POAEE [mM/µM]: 0 (Ctrl, same as in C and D, n = 30, N = 3), 100 (n = 27, N = 3), 200 (n = 25, N = 3). F–H Bar charts show average response areas (±SEM) as well as individual response areas (black dots), which demonstrate an increase of Ca2+ above the baseline levels calculated between 200 and 800 s for all traces averaged in C, D and F, respectively. All data were compared to the same control (perfusion with the extracellular solution alone). I Schematic illustration of selected aspects of the cellular Ca2+ signalling machinery: cyclopiazonic acid (CPA) inhibits SERCA (sarco/endoplasmic reticulum Ca2+-ATPase), which blocks ER refilling and leads to emptying of this Ca2+ store. J Cytosolic Ca2+ responses (average traces ± SEM) induced in hPSCs in the absence of extracellular Ca2+ by different concentrations of EtOH/POA [mM/µM]: 0 (Ctrl, n = 21, N = 3), 10 (n = 14, N = 3), 25 (n = 19, N = 3) and 50 (n = 26, N = 3). K Bar chart shows the increase of Ca2+ above the baseline levels presented as average response areas (±SEM) and individual response areas (black dots) calculated between 200 and 800 s for all traces averaged in J. L Cytosolic Ca2+ response (representative trace) to 20 µM cyclopiazonic acid (CPA), an inhibitor of SERCA (as depicted in I), in the absence of extracellular Ca2+. After depletion of the ER stores by CPA, a subsequent application of EtOH/POA 25 mM/25 µM (presented in grey; n = 34, N = 3) or EtOH/POA 50 mM/50 (presented in blue; n = 41, N = 3) fails to trigger further Ca2+ responses in hPSCs. M Cytosolic Ca2+ response (representative trace) to EtOH/POA 25 mM/25 µM (presented in grey; n = 14, N = 2) or EtOH/POA 50 mM/50 (presented in blue; n = 10, N = 3) in the absence of extracellular Ca2+; subsequent treatment with CPA does not trigger further Ca2+ release from the ER. Statistical significance was calculated with the Mann–Whitney test (for data presented in F) and the Kruskal–Wallis test, followed by a post hoc analysis with the Dunn test (for data presented in G, H, K).
Fig. 2
Fig. 2. Ethanol metabolites increase α-SMA expression in the alcoholic AP mouse model in vivo but not in vitro in hPSCs.
A Alcoholic AP was induced by intraperitoneal injection of ethanol (1.5 g/kg) and palmitoleic acid (POA, 150 or 300 mg/kg, n = 6 for both) in the presence of PEG 200 (1 g/kg), twice at 1 h intervals. Control mice received saline injections (n = 6). H/E staining shows an increasing severity of inflammation with increasing doses of POA (left panels). IHF staining shows a dose-dependent increase in α-SMA expression (presented in white) throughout pancreatic tissue (right panels). Scale bars: 50 µm. B Two models of bile acid-induced AP: taurocholate (TC)-elicited acute pancreatitis (TC-AP) was induced by retrograde pancreatic ductal injection with 1% TC (5 µl/min over 10 min by infusion pump, n = 5); taurolithocholic acid 3-sulfate (TLC-S)-elicited acute pancreatitis (TLC-S-AP) was induced by retrograde pancreatic ductal injection with 3 mM TLC-S (5 µl/min over 10 min by infusion pump, n = 5); for both models, saline injections (sham) were experimental controls (n = 3). Although H/E staining confirms severe inflammation, α-SMA expression is limited only to necrotic areas (inserts shown in red frames) but is absent in live tissue. Scale bars: 50 µm. C–E Histological scoring of H/E staining was done on ten random fields of view by “blinded” investigators. The severity of each parameter – oedema (C), inflammatory cell infiltration (D) and acinar cell necrosis (E)—was scored using a 4-level grade [28, 51]. Results were presented as mean ± SEM. F α-SMA expression was quantified as a ratio of α-SMA-positive area to total tissue area (QuPath Software) [52]. Calculations were carried out in ten random fields of view by “blinded” investigators. Where applicable, live and necrotic areas were identified in transmitted light images. Results were presented as mean ± SEM. Statistical significance was calculated using Welch’s ANOVA with Games-Howell’s post hoc test (alcoholic AP) and Kruskal–Wallis and Dunn’s post hoc test (biliary AP and infiltration in alcoholic AP). G Activation of human PSCs was assessed after incubation with EtOH 200 mM, EtOH/POA 10 mM/10 µM or EtOH/POAEE 100 mM/100 µM for 24 h. The expression of α-SMA (green) is an indicator of the activated phenotype. Cell nuclei are shown in blue. Scale bar: 100 µm. H Calculated proportion of α-SMA-positive cells (±SEM) in immunostaining presented in G. Cells were counted in five random fields of view for each of three biological replicates. Individual values are presented as dots. I Representative Western blot for α-SMA in hPSC after incubation with EtOH 200 mM, EtOH/POA 10 mM/10 µM or EtOH/POAEE 100 mM/100 µM for 24 h. Vinculin was used as a loading control. J Relative gene expression of ACTA2 (±SEM) in hPSC after incubation with given concentrations of ethanol, POA or POAEE (EtOH 200 mM; EtOH/POA 10 mM/10 µM; EtOH/POAEE 100 mM/100 µM) for 24 h. Expression was normalised to glyceraldehyde-3-phosphate dehydrogenase (GAPDH; N = 3). Statistical significance was calculated using the one-way ANOVA test followed by a post hoc analysis with the Dunnett test.
Fig. 3
Fig. 3. Ca2+ responses induced by ethanol metabolites are reduced in activated human PSCs.
AC Activation of hPSCs was induced by incubation with TGF-β (5 ng/ml) for 48 h or 7 days. The expression of α-SMA (green) is an indicator of the activated myofibroblast-like phenotype. Cell nuclei are shown in blue. Scale bar: 30 µm. D Calculated proportion of α-SMA-positive cells (±SEM) in immunostaining presented in AC. Cells were counted in five random fields of view for each staining. Individual values are presented as dots. E–G The average traces (±SEM) show cytosolic Ca2+ responses to 10 mM EtOH and 10 µM POA in quiescent hPSCs (n = 21; E), TGF-β-activated hPSCs for 48 h (n = 12; F) and TGF-β-activated hPSCs for 7 days (n = 30; G). H The bar graph shows the average response amplitude (±SEM) calculated between 200 and 800 s for the traces averaged in EG. Individual values are presented as dots. IK The average traces (±SEM) show cytosolic Ca2+ responses to 25 mM EtOH and 25 µM POA in quiescent hPSCs (n = 24; I), TGF-β-activated hPSCs for 48 h (n = 23; J), and TGF-β-activated hPSCs for 7 days (n = 27; K). L The bar graph shows the average response amplitude (±SEM) calculated between 200 and 800 s for the traces averaged in I–K. Individual values are presented as dots. MO The average traces (±SEM) show cytosolic Ca2+ responses to 50 mM EtOH and 50 µM POA in quiescent hPSCs (n = 29; M presented previously in Fig. 1D), TGF-β-activated hPSCs for 48 h (n = 23; N), and TGF-β-activated hPSCs for 7 days (n = 20; O). P The bar graph shows the average response amplitude (±SEM) calculated between 200 and 800 s for the traces averaged in MO. Individual values are presented as dots. QS The average traces (±SEM) show cytosolic Ca2+ responses to 100 mM EtOH and 100 µM POAEE in quiescent hPSCs (n = 27; Q), TGF-β-activated hPSCs for 48 h (n = 28; R) and TGF-β-activated hPSCs for 7 days (n = 13; S). T The bar graph shows the average response amplitude (±SEM) calculated between 200 and 800 s for the traces averaged in QS. Individual values are presented as dots. UW The average traces (±SEM) show cytosolic Ca2+ responses to 200 mM EtOH and 200 µM POAEE in quiescent hPSCs (n = 25; U), TGF-β-activated hPSCs for 48 h (n = 13; V) and TGF-β-activated hPSCs for 7 days (n = 15; W). X The bar graph shows the average response amplitude (±SEM) calculated between 200 and 800 s for the traces averaged in UW. Individual values are presented as dots. Statistical significance was calculated with the Kruskal–Wallis test, followed by a post hoc analysis with Dunn's test.
Fig. 4
Fig. 4. Expression of selected genes in quiescent and TGF-β-activated human PSCs.
Relative mRNA levels (qPCRs) of selected targets (±SEM) in quiescent hPSC (blue) hPSCs activated with TGF-β (5 ng/ml) for 48 h (green) and for 7 days (grey): A actin alpha 2, smooth muscle (ACTA2); B vimentin (VIM); C desmin (DES); D fibronectin (FN); E stromal interaction molecule 1 (STIM1); F calcium release-activated calcium channel protein 1 (ORAI1); G transient receptor potential cation channel, subfamily C, member 3 (TRPC3); H transient receptor potential cation channel, subfamily C, member 6 (TRPC6); I transient receptor potential ankyrin 1 channel (TRPA1); J plasma membrane calcium ATPase, isoform 4 (PMCA4); K inositol 1,4,5-trisphosphate receptor type 1 (ITPR1); L inositol 1,4,5-trisphosphate receptor type 2 (ITPR2); M inositol 1,4,5-trisphosphate receptor type 3 (ITPR3); N ryanodine receptor type 1 (RYR1); O ryanodine receptor type 2 (RYR2); P ryanodine receptor type 3 (RYR3). Expression was normalised to glyceraldehyde-3-phosphate dehydrogenase (GAPDH) (n = 2, N = 3). Statistical significance was calculated using the one-way ANOVA test followed by a post hoc analysis with the Dunnett test. ns non-significant difference, *p < 0.05, **p < 0.01; ***p < 0.001.
Fig. 5
Fig. 5. Ca2+ responses to EtOH/POA are predominantly dependent on TRPA1.
A Schematic illustration of the inhibition experiment: TRPA1 is a Ca2+ channel inhibited by HC-030031. B The expression of the activation marker α-SMA (upper panel, green) and TRPA1 (lower panel, red) was evaluated in quiescent hPSCs, quiescent hPSCs treated with TRPA1 inhibitor for 48 h, and quiescent hPSCs with TRPA1 knockdown and TGF-β-activated hPSCs for 48 h. Cell nuclei are shown in blue. Scale bar: 50 µm. C The average traces (±SEM) show cytosolic Ca2+ responses to EtOH/POA 50 mM/50 µM in quiescent hPSCs (n = 29, N = 3; navy; presented previously in Fig. 1D), TGF-β-activated hPSCs for 48 h (n = 23, N = 3; green; presented previously in Fig. 3N) and quiescent hPSCs incubated with HC-030031 for 5 min (n = 15, N = 3; red). D Average traces (±SEM) show cytosolic Ca2+ responses to EtOH/POA 50 mM/50 µM in quiescent hPSCs (n = 29, N = 3; navy; presented previously in Figs. 1D, 5C), TGF-β-activated hPSCs for 48 h (n = 23, N = 3; green; presented previously in Figs. 3N, 5C) and quiescent hPSCs with silenced expression of TRPA1 (n = 23, N = 3; blue). E The bar graph shows the average response area (±SEM) calculated between 200 and 1200 s for the traces averaged in C and D. F The bar graph shows the average response amplitude (±SEM) between 200 and 1200 s for the traces averaged in C and D. G The average traces ± SEM show cytosolic Ca2+ responses to the application of cyclopiazonic acid (CPA), an inhibitor of the SERCA pump, in quiescent hPSCs (n = 29, N = 3; q; navy), TGF-β-activated PSCs for 48 h (n = 28, N = 3; a48 h; green) TGF-β-activated PSCs for 7 d (n = 14, N = 3; a7d; grey). H Bar chart shows the average response area (±SEM) calculated between 200 and 800 s for the traces averaged in G. Statistical significance was calculated with the Kruskal–Wallis test, followed by a post hoc analysis with Dunn's test. The ROUT test was used to identify outliers in F.
Fig. 6
Fig. 6. Activated hPSCs are resistant to EtOH/POA-induced loss of mitochondrial potential (Δψ) as well as cell death.
A Image shows mitochondrial localisation of TMRM in hPSCs. Scale bar: 10 μm. B The average traces (±SEM) show a decrease in TMRM fluorescence recorded in hPSCs in response to different concentrations of EtOH/POA: 0 (Ctrl, n = 24, N = 3), 10 (n = 14, N = 3), 25 (n = 12, N = 3) and 50 (n = 30, N = 3) mM/µM, respectively. CCCP (1 μM) was applied at the end of each experiment to attain the maximal decrease of Δψ. C The bar graph shows the average decrease (±SEM) below the baseline levels calculated between 200 and 800 s for the traces averaged in B. D Average traces (±SEM) show a decrease in TMRM fluorescence recorded in response to 25 mM EtOH and 25 µM POA in quiescent hPSCs (blue; n = 16, N = 3), TGF-β-activated PSCs for 48 h (green; n = 11, N = 3) and TGF-β-activated PSCs for 7 days (grey; n = 17, N = 3). CCCP (1 and 10 μM) was applied at the end of each experiment to attain the maximal decrease of Δψ. E The bar graph shows the average decrease (±SEM) below the baseline levels calculated between 200 and 800 s for the traces averaged in D. F Representative images of the staining of hPSCs with annexin V-FITC and propidium iodide after 30 min incubation with 50 mM EtOH and 50 µM POA: quiescent hPSCs (first column), quiescent hPSCs incubated with TRPA1 inhibitor HC-030031 (second column), TGF-β-activated hPSCs for 48 h (third column) and TGF-β-activated PSCs for 7 days (fourth column). Scale bar: 10 μm. G The bar charts show the proportion of apoptotic (green) and necrotic (red) cells ±SEM (for all groups N = 3) calculated from the staining presented in F. Statistical significance was calculated for the combined dead cells (apoptotic + necrotic) for a given concentration of EtOH/POA between qhPSC vs qhPSC + HC-030031, ahPSC 48 h and ahPSC 7 days, using one-way ANOVA followed by a post hoc analysis with the Dunnett’s T3 test. The significance between qhPSC + HC-030031 and ahPSC 48 h was calculated using the t-test.
Fig. 7
Fig. 7. Schematic illustration of PSC activation and its consequences for alcohol metabolite-induced pathology of the pancreas.
Full description in the text (created with BioRender.com).

Comment in

References

    1. Spanier BW, Dijkgraaf MG, Bruno MJ. Epidemiology, aetiology and outcome of acute and chronic pancreatitis: an update. Best Pr Res Clin Gastroenterol. 2008;22:45–63. doi: 10.1016/j.bpg.2007.10.007. - DOI - PubMed
    1. Yadav D, Whitcomb DC. The role of alcohol and smoking in pancreatitis. Nat Rev Gastroenterol Hepatol. 2010;7:131–45. doi: 10.1038/nrgastro.2010.6. - DOI - PubMed
    1. Petrov MS, Yadav D. Global epidemiology and holistic prevention of pancreatitis. Nat Rev Gastroenterol Hepatol. 2019;16:175–84. doi: 10.1038/s41575-018-0087-5. - DOI - PMC - PubMed
    1. Petersen OH, Gerasimenko JV, Gerasimenko OV, Gryshchenko O, Peng S. The roles of calcium and ATP in the physiology and pathology of the exocrine pancreas. Physiol Rev. 2021;101:1691–744. doi: 10.1152/physrev.00003.2021. - DOI - PubMed
    1. Raraty M, Ward J, Erdemli G, Vaillant C, Neoptolemos JP, Sutton R, et al. Calcium-dependent enzyme activation and vacuole formation in the apical granular region of pancreatic acinar cells. Proc Natl Acad Sci USA. 2000;97:13126–31. doi: 10.1073/pnas.97.24.13126. - DOI - PMC - PubMed

Publication types