. 2022 Aug 29;13(1):4865.
doi: 10.1038/s41467-022-32537-0.

HnRNPK maintains single strand RNA through controlling double-strand RNA in mammalian cells

Affiliations

HnRNPK maintains single strand RNA through controlling double-strand RNA in mammalian cells

Sagar Mahale et al. Nat Commun. .

Abstract

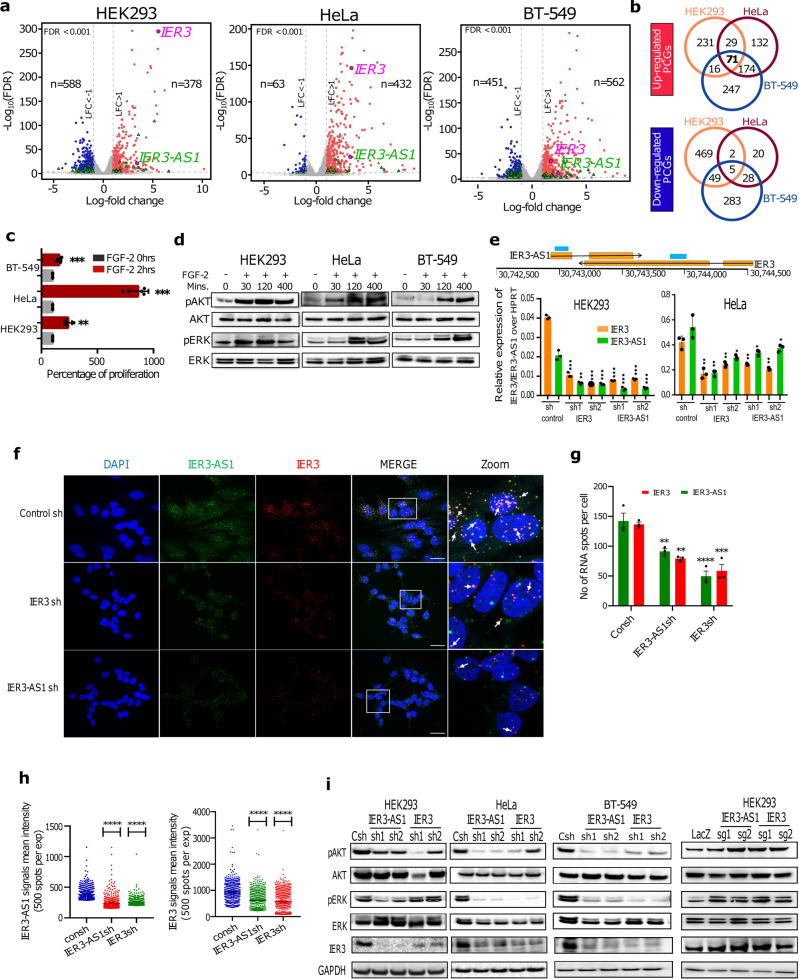
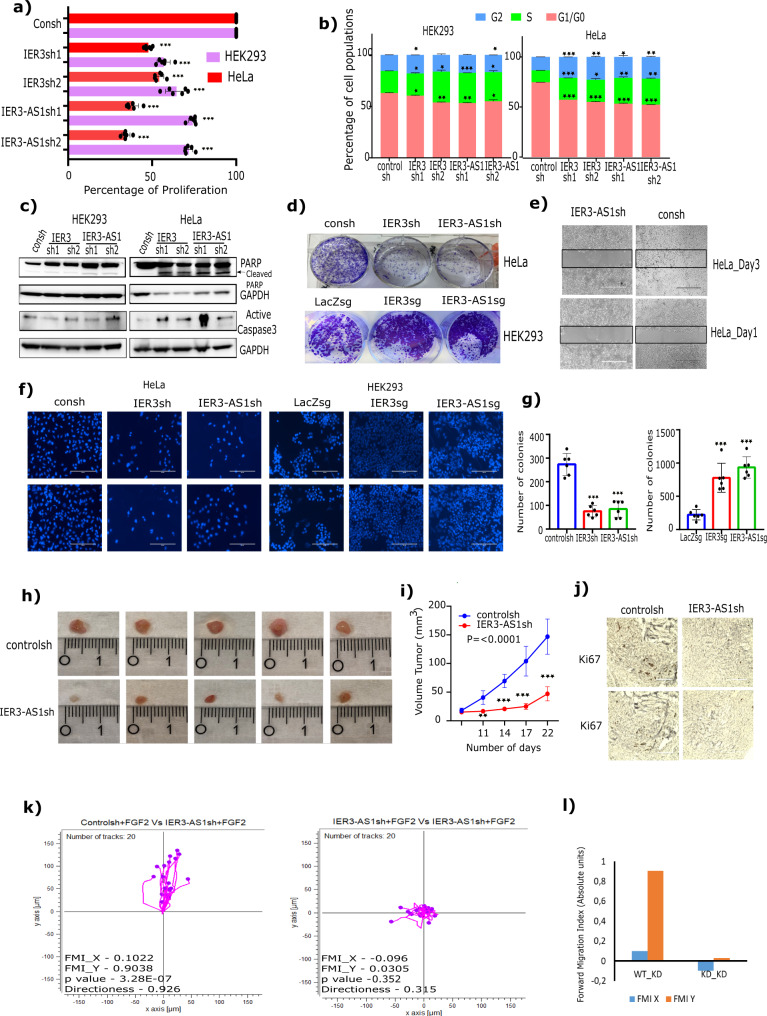
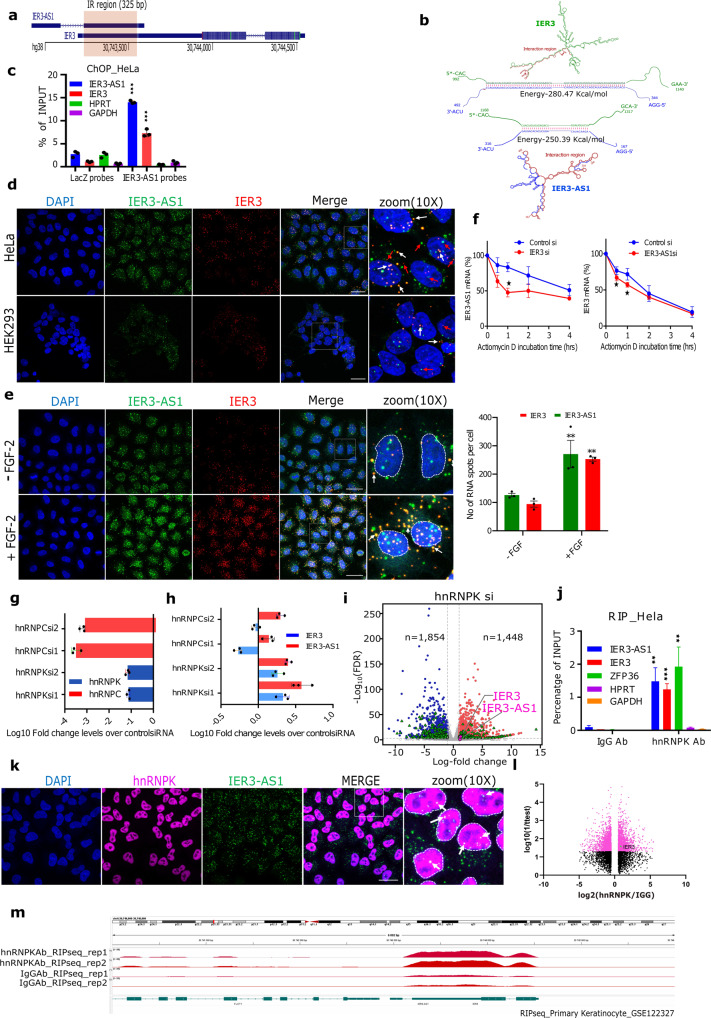
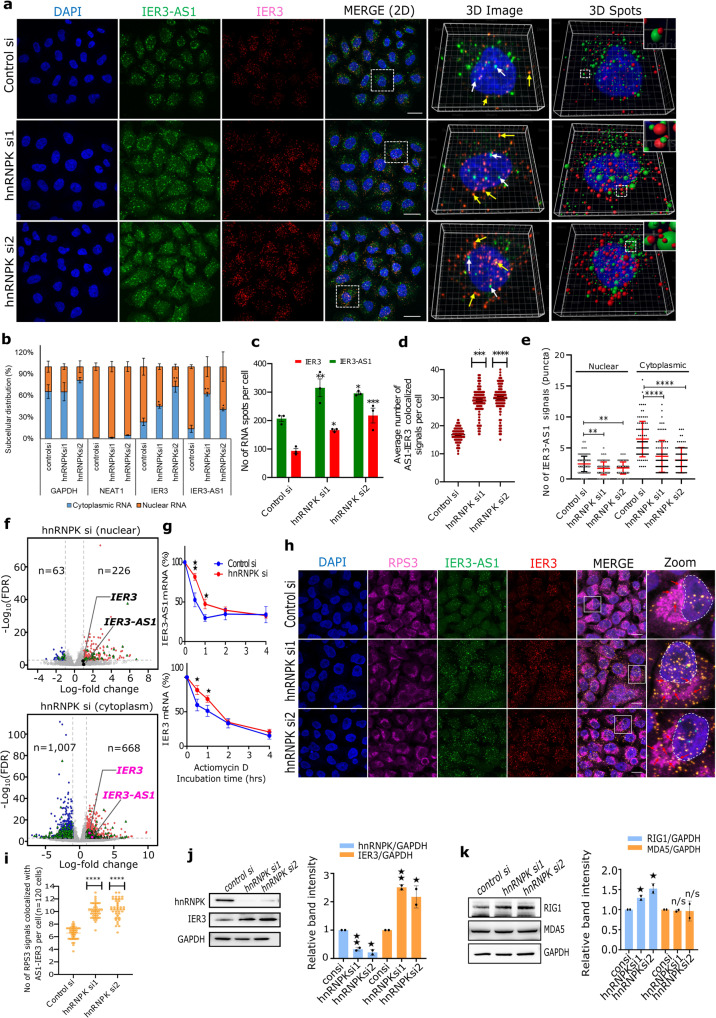
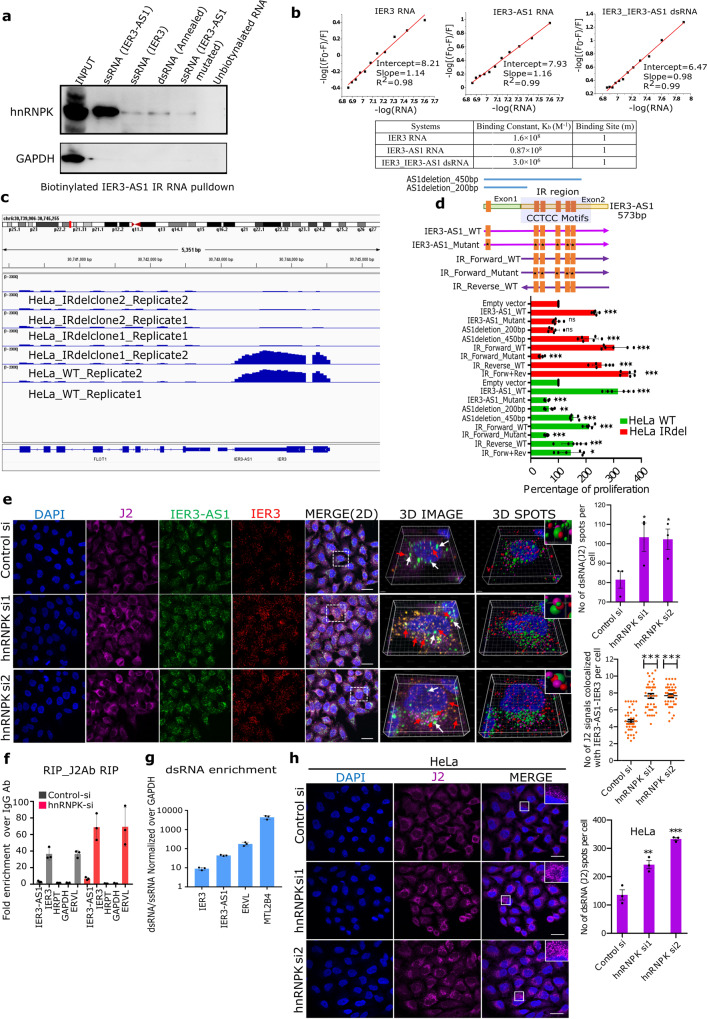
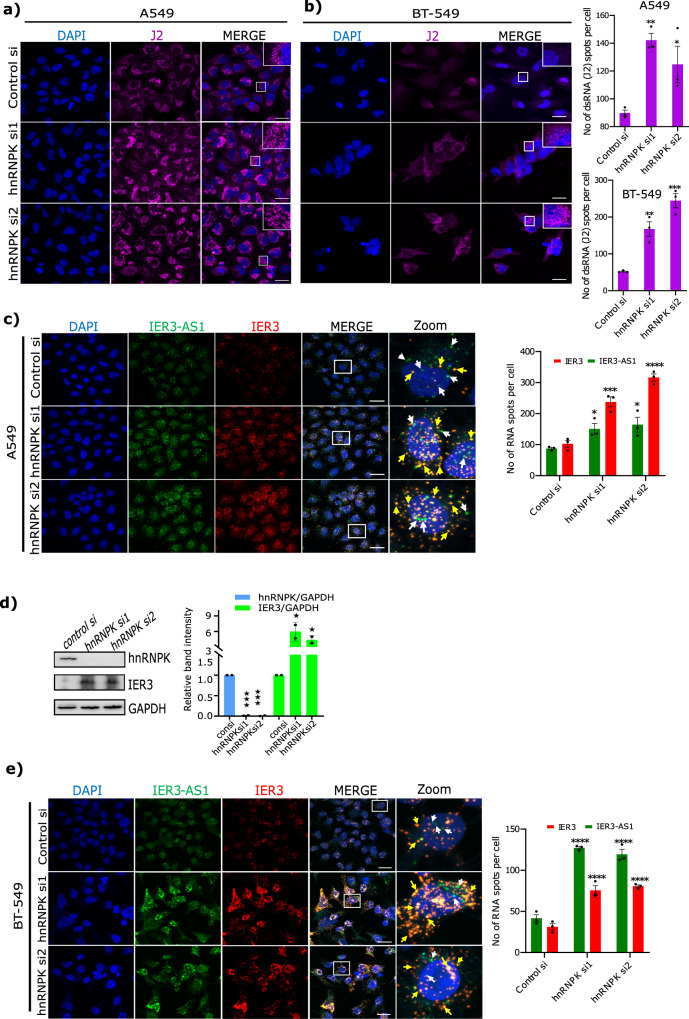
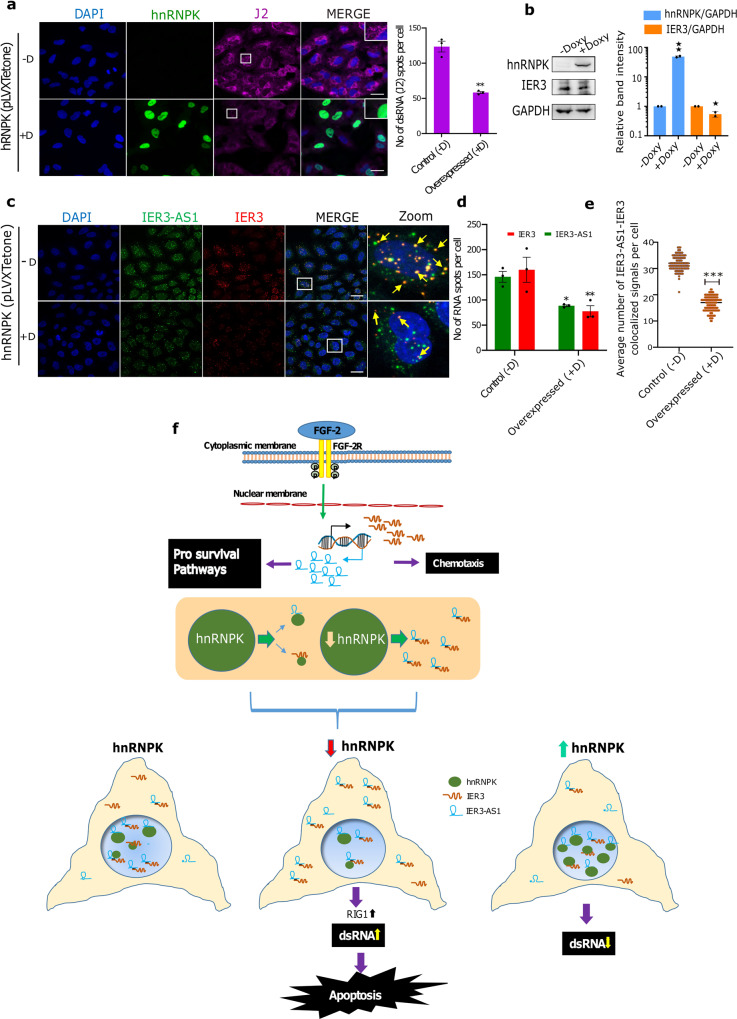
Although antisense transcription is a widespread event in the mammalian genome, double-stranded RNA (dsRNA) formation between sense and antisense transcripts is very rare and mechanisms that control dsRNA remain unknown. By characterizing the FGF-2 regulated transcriptome in normal and cancer cells, we identified sense and antisense transcripts IER3 and IER3-AS1 that play a critical role in FGF-2 controlled oncogenic pathways. We show that IER3 and IER3-AS1 regulate each other's transcription through HnRNPK-mediated post-transcriptional regulation. HnRNPK controls the mRNA stability and colocalization of IER3 and IER3-AS1. HnRNPK interaction with IER3 and IER3-AS1 determines their oncogenic functions by maintaining them in a single-stranded form. hnRNPK depletion neutralizes their oncogenic functions through promoting dsRNA formation and cytoplasmic accumulation. Intriguingly, hnRNPK loss-of-function and gain-of-function experiments reveal its role in maintaining global single- and double-stranded RNA. Thus, our data unveil the critical role of HnRNPK in maintaining single-stranded RNAs and their physiological functions by blocking RNA-RNA interactions.


Conflict of interest statement

The authors declare no competing interests.

Figures

Fig. 1
Fig. 1. FGF-2 regulated gene networks controlled by IER3 and IER3-AS1.
a Volcano plots showing Log10FDR on Y axis and LogFC on X-axis of DEGs from RNA-seq data of FGF-2 untreated vs treated cell lines. Up and down regulated DEGs are shown in red and blue color dots respectively. The non-significant DEGs are represented as gray dots. Green triangles indicate significant lncRNAs and antisense RNAs. FDR threshold (=0.05) is reported as horizontal dotted gray line. FDR values are derived from DESeq2 R-package by adjusting p-values using Benjamini-Hochberg method. b Venn diagrams showing the number of common and uniquely expressed DEGs between FGF-2 treated normal and cancer cell lines. c Shows the percentage of cell proliferation of FGF-2 treated and untreated cells. n = 2 independent biological experiments and the error bars represent +/−SD. d Western blot showing pAKT/pERK and total AKT/ERK levels at the indicated time points in FGF-2 treated and untreated cell lines. Similar results were obtained in the independent biological replicate. e The schematic shows IER3 and IER3-AS1 transcripts orientation and location with respect to each other. Bar graphs show RT-qPCR analysis of IER3 and IER3-AS1 in the indicated shRNA stable knockdown (KD) samples. Significance was derived using two-sided student’s t-test and the data represent ±SD of three biological replicates. f RNAscope images showing IER3 (Red) and IER3-AS1 (Green) transcripts in control and IER3/IER3-AS1 KD HeLa cells. Images at the right represents the magnified areas of the indicated white boxes from the merged images. The white arrow heads indicate colocalized dsRNA signals. DAPI was used to stain nucleus (Indicative scale bar is 50 um). n = 3 independent experiments. g Graph showing the numbers of RNA signals (spots) per cell in control sh and IER3/IER3-AS1 sh samples counted using Imaris spot detection tools. The details of quantification procedure and tools are mentioned in Supplementary Fig. 6. Total number of cells counted from three independent replicates are, control sh: n = 56, IER3-AS1 sh: n = 99 and IER3 sh: n = 87. Data represent mean values ± SEM and statistical significance was calculated by Two-way ANOVA. Exact p-values are given in the source data file. h Dot plots showing fluorescence’s mean intensity of RNA signals in IER3-AS1sh and IER3sh cells. 500 bright intensity spots per experiment were taken for the measurement from three independent replicates. Imaris spot detection tools were used to detect the spots. Statistical significance was calculated by one-way ANOVA (Dunnett’s multiple comparisons test). i Western blots showing the indicated protein levels in IER3 or IER3-AS1 KD or CRISPR/dcas9 activated samples in HEK293 and HeLa cell lines. GAPDH is a loading control. n = 2 independent experiments. Similar results were obtained in the independent biological replicate. *p ≤ 0.05; **p ≤ 0.005; ***p ≤ 0.0005, ****p ≤ 0.0001.
Fig. 2
Fig. 2. IER3 and IER3-AS1 harbor oncogenic properties.
a Cell viability assay showing the percentage of cell proliferation in IER3 and IER3-AS1 stable KD HeLa and HEK293 cells. b Distribution plots showing the percentage of cell populations of G0/G1, S and G2 phases of cell cycle in IER3 and IER3-AS1 stable KD HeLa and HEK293 cells. Fig. a, b: values represent mean ± SD of two biological experiments. Significance was calculated using two-sided Student’s t- test. c Western blot showing the expression levels of different apoptotic proteins probed with the indicated antibodies. d Colony forming efficiency of IER3 and IER3-AS1 stable KD HeLa cells (upper panel) and CRISPR/dcas9 activated IER3 and IER-AS1 HEK293 cells (lower panel). e Wound healing or scratch assay showing cell migration efficiency of control sh and IER3-AS1sh stable KD HeLa cells. Similar results were obtained from two independent experiments for (c), (d) and (e). f Transwell invasion assay showing the invasive potential of IER3 and IER3-AS1 stable KD HeLa cells and stable overexpressing (OE) (CRISPRa) HEK293 cells. g Bar graphs show quantification of the invasive cells shown in Figure (f). The invasive cells were counted using ImageJ software and error bars represents ± SD from two independent experiments. h Representative images of tumors (n = 5) depicting the tumor size of xenografts that were developed by subcutaneously injected HeLa cells stably transduced with control sh or IER3-AS1 shRNA. Tumors were harvested after 25 days post injection. i The graph showing the difference in the volume of tumors between HeLa control sh mice and HeLa IER3-AS1sh mice group (each group contains 5 mice). Error bars represents ± SD and significance was calculated using Student t-test. j Representative images of the Ki67 staining on the cross sections of xenografts from Fig. 2h. The data shown here is from two individual mice tumors. k Migration trajectory graphs showing the trajectory of PBMCs in response to FGF-2 treatment of HeLa control sh and HeLa IER3-AS1 stable KD cells. The migration assay was performed using 3D cell migration chemotaxis from ibidi. The forward migration index value (FMI) for both X and Y axis, the Rayleigh test (p-value) are mentioned for each plot. Similar results were obtained in two independent experiments. l The graph showing the FMI values from Fig. 2k for both HeLa control sh and HeLa IER3-AS1 KD cells. *p ≤ 0.05; **p ≤ 0.005; ***p ≤ 0.0005.
Fig. 3
Fig. 3. Post-transcriptional control IER3 and IER3-AS1 by HnRNPK.
a The schematic of overlapping region (IR) between IER3 and IER3-AS1 transcripts. b RNA secondary structures and the predicted RNA–RNA interactions of IER3 and IER3-AS1. IER3 and IER3-AS1 specific sequences are shown in green and blue color respectively. Red color highlight the IR region. c RT-qPCR analysis of chromatin oligo affinity precipitation (ChOP) assay performed using 8 biotinylated IER3-AS1-specific antisense oligos. LacZ-specific antisense oligos were used as negative pull-down control. d, e RNAscope images showing IER3 (red) and IER3-AS1(green) transcripts in HeLa and HEK293 cells (d) and in HeLa cells treated with FGF-2 (e). Images at the right are magnified areas of the indicated white boxes from the merged images. The white and red arrow heads indicate colocalized dsRNA and ssRNA signals, respectively. Indicative scale bar on the images is 50um. The graph in Fig. 3e shows the number of IER3-AS1 and IER3 RNA signals upon FGF treatment, quantified as RNA spots per cell using Imaris spot detection tools. A total, -FGF: n = 116, and +FGF: n = 101 cells were counted from 3 independent experiments and data represent mean ± SEM. The significance was calculated using Two-way ANOVA. f RT-qPCR showing IER3-AS1 and IER3 transcripts at the indicated time points in actinomycin D treated IER3 or ER3-AS1 KD cells. g, h RT-qPCR showing Log10FC values of hnRNPK and hnRNPC (g) and IER3 and IER3-AS1 (h) in hnRNPK and hnRNPC KD HeLa cells. I Volcano plot showing HeLa cell RNA-seq data of control siRNA vs hnRNPK siRNA. Upregulated, downregulated and non-significant DEGs genes are shown in red, blue and grey dots, respectively. The dotted lines indicate the FDR threshold (=0.05). FDR values are derived from DESeq2 R package by adjusting p-values using Benjamini-Hochberg method. j RT–qPCR analysis of RNA immunoprecipitation (RIP), performed in HeLa cells. ZFP36 gene was a positive control and HPRT and GAPDH were negative controls for the pull-down. Data were normalized to the input RNA and plotted as the percentage of input. n = 3 independent replicates and error bars indicate + /− SD. Significance was calculated using 2-sided Student’s-t-test for C, F, G, H and J. k Immunofluorescence (IF)-RNAscope images show IER3-AS1 (green) colocalization with HNRNPK immunostaining (magenta) in HeLa cells. Magnified areas from the merged as indicated in white boxes are shown on right-side. The co-localized signals are indicated by white arrows. Indicative scale bar on the images is 50 um. l, m Volcano plot showing the DEGs (l) and HnRNPK binding peaks over the IER3/IER3-AS1 locus (m) from the downloaded published RIP-sequencing dataset (GSE122327). The HnRNPK RIP data was presented over IgG. Significant and non-significant genes are shown in pink and black color, respectively. For Fig. (c, e, f and j): *p ≤ 0.05; **p ≤ 0.005; ***p ≤ 0.0005.
Fig. 4
Fig. 4. HnRNPK determines RNA–RNA interactions and sub-cellular localization.
a RNAscope images of IER3 (red) and IER3-AS1 (green) in hnRNPK KD HeLa cells. The right-side panels show the 3D reconstructed images (Imaris) of the merged 2D image indicated by white dotted box. IER3-AS1- white arrows and IER3 and IER3-AS1 dsRNA - yellow arrows. Green spheres (IER3-AS1) and red spheres (IER3) shown in the 3D images are detected using spot detection tool. Upper right corner inset shows magnified co-localized spots. Indicative scale bar is 50 um. n = 3 independent experiments. b RT–qPCR data showing the nuclear and cytoplasmic distribution of IER3 and IER3-AS1. GAPDH and NEAT1 were cytoplasmic and nuclear RNA controls, respectively. c Quantification of IER3-AS1 and IER3 RNA signals using Imaris spot detection tools. Cells counted- control: n = 81, siRNA1: n = 74 and siRNA2: n = 75. The statistical significance was calculated by two-way ANOVA (Sidak’s multiple comparisons test). d Dot plots showing the average number of IER3-AS1/IER3 colocalized signals per cell (n = 150 cells). The statistical significance was calculated by one-way ANOVA (Kruskal–Wallis test). e Graph showing the number of non-colocalized IER3-AS1 signals (Fig. 4a: green dots pointed with white arrows) in HeLa cells (n = 90 cells from 3 independent experiments). The statistical significance was calculated by one-way ANOVA (Kruskal–Wallis test). f) Volcano plots showing Log2FC values of DEGs of RNA-seq data from nuclear (upper panel) and cytoplasmic (lower panel) fractions. Upregulated DEGs - red dots; down regulated DEGs - blue dots; non-significant DEGs - gray dots; lncRNAs: green triangles and FDR threshold (=0.05) - horizontal dotted gray line. FDR values were derived from DESeq2 R-package by adjusting p-values using Benjamini-Hochberg method. IER3 and IER3-AS1 were indicated as roseate dots and black dots. g RT–qPCR showing IER3-AS1 and IER3 levels in hnRNPK KD cells at the indicated time points of actinomycin D incubation. h IF-RNAscope images showing RPS3 (magenta), IER3 (red) and IER3-AS1 (green) signals in HeLa cells. The panel to the right shows the zoomed image of the merged panel indicated by white box. Red arrows show co-localized RPS3/IER3/IER3-AS1 signals. The dotted white lines mark the nucleus. Indicative scale bar is 50 um. i Dot plots showing the average number of colocalized RPS3/IER3-AS1/IER3 signals per cell (n = 120 cells from 3 independent replicates). The statistical significance calculated using one-way ANOVA (Kruskal–Wallis test). j Western blots show HNRNPK and IER3 levels in hnRNPK KD cells. Histograms shows the relative band intensities from the western blot. k Western blots showing the indicated protein levels in hnRNPK KD cells. Histograms showing the relative band intensities from the western blot. The p values were calculated using two-sided Student’s t-test and data are presented ± SD from two independent replicates for (b, g, j and k). *p ≤ 0.05; **p ≤ 0.005; ***p ≤ 0.0005,****p ≤ 0.0001.
Fig. 5
Fig. 5. HnRNPK control global single- and double-strand RNA.
a Biotinylated RNA pulldowns using streptavidin beads followed by western blotting with HnRNPK antibody. GAPDH was used as a control for RNA pulldown specificity. Same results were obtained from independent replicate. b Plots of -log[(F0-F)/F] vs -log[RNA] for the equilibria between IER3, IER3-AS1 and duplex RNA IER3/IER3-AS1 showing the Intercept values of the HNRNPK protein (λex = 280 nm) with increasing amount of RNA (0.0 to 0.13 µM). Table shows the calculated equilibrium parameters. c BAMscale peaks over IER3/IER3-AS1 locus from RNA-seq data of control and CRISPR/cas9 IR deleted HeLa cells. d Schematic view of IER3-AS1 deletions and CCTCC motif mutations. Bar graph of MTT assay showing the percentage of cell proliferation. e IF-RNAscope images of control and hnRNPK KD HeLa cells showing J2 (dsRNA-specific antibody) immunostaning, coupled with RNAscope using IER3 (red) and IER3-AS1 (green) probes. The right-side panels show 3D reconstructed cell images (Imaris) of the merged image indicated by white dotted box. IER3-AS1 (green dots marked with white arrows) and J2/IER3/IER3-AS1 colocalized signals (brownish-yellow dots marked with red arrows). The spheres from the 3D reconstructed images detected using spot detection tool. J2 - Pink spheres, IER3-AS1 - green spheres and IER3 - red spheres. Upper right corner shows magnified co-localized spots in an inset. Indicative scale bar is 50 um. Graph to the right shows the numbers of J2 signals in control (n = 81) and hnRNPK KD (siRNA1: n = 74 and siRNA2: n = 75) cells. Data represents mean with ±SEM from n = 3 independent experiments. P value calculated by One-way ANOVA (Sidak’s multiple comparisons test). Dot plots shows the average number of J2/IER3-AS1/IER3 co-localized signals (n = 120 cells were manually counted from 3 independent experiments). P value was calculated by one-way ANOVA (Kruskal–Wallis test). f RIP assay, performed using J2 antibody, showing the fold enrichment of IER3 and IER3-AS1 transcripts over IgG. HPRT and GAPDH (negative controls) and ERVL (positive control). g RT–qPCR showing the enrichment of IER3:IER3-AS1 dsRNA (RNaseA treated) over ssRNA (RNaseA untreated). The expression values were normalized with GAPDH. ERVL and MTL2B4 are positive controls. h IF images of HeLa cells showing J2 signals. Magnified J2 signals (puncta) were shown in an inset indicated by white box. Indicative scale bar is 50 um. Graph shows the number of J2 signals quantified using Imaris spot detection tools. A total, control: n = 63, siRNA1: n = 51 and siRNA2: n = 57 cells were counted from three experiments. P value calculated by One-way ANOVA. Data represent mean ± SDfrom two independent biological replicates. P value was calculated by two-sided Student’s t-test for (d, f and g) (*p ≤ 0.05; **p ≤ 0.005; ***p ≤ 0.0005,****p ≤ 0.0001).
Fig. 6
Fig. 6. HnRNPK induces global dsRNA formation in multiple cell lines.
a, b Immunofluorescence images of A549 cells (a) and BT-549 (b) showing dsRNA-specific J2 signals in hnRNPK KD cells. The panel to the right shows the merged images. Magnified J2 signals (puncta) are shown in an inset at the upper right corner indicated by white box. Indicative scale bar is 50um. Graphs show the number of J2 signals in hnRNPK KD cells quantified using Imaris spot detection tools. For A549 cell line - control: n = 59, siRNA1: n = 64 and siRNA2: n = 73 cells and for BT-549: control: n = 25, siRNA1: n = 37 and siRNA2: n = 44 cells were counted from three independent experiments. Data are presented as mean values +/−SEM. Significance was calculated by One-way ANOVA (ordinary multiple comparisons test). c, e RNAscope images of A549 cells (c) and BT-549 cells (e) showing IER3 (red) and IER3-AS1 (green) in control and hnRNPK KD cells. Panel to the right shows the magnified images of the merged panels indicated by white box. White arrows marks IER3-AS1 (green dots) and yellow arrows marks colocalized IER3/IER3-AS1 dsRNA (Yellow dots). Indicative scale bar on the images is 50 um. Bar graph shows the number of IER3-AS1 and IER3 RNA signals per cell in control and hnRNPK KD cells quantified using Imaris spot detection tools. For A549 - control: n = 101, siRNA1: n = 78 and siRNA2: n = 97 cells and for BT-549 - control: n = 132, siRNA1: n = 44 and siRNA2: n = F36 cells were counted from three independent experiments. Data are presented as mean values +/−SEM. The significance was calculated by Two-way ANOVA (Sidak’s multiple comparisons test). d Immunoblot showing the levels of HnRNPK and IER3 in hnRNPK KD A549 cells. GAPDH was used as an internal loading control. Similar results were observed in an independent biological replicate. Histograms showing the relative band intensities from the western blot are shown left side. The p values were calculated using two-sided Student’s t-test and data are presented ± SD from two independent replicates.
Fig. 7
Fig. 7. HnRNPK overexpression suppresses global dsRNA levels.
a Representative immunofluorescence images showing the effect of doxycycline (DOX) induced overexpression (−DOX/+DOX) of HnRNPK (green) on global dsRNA as detected using J2 antibody (red) in A549 cells. Panel to the right shows the merged images. Magnified J2 signals (puncta) are shown in an inset at the upper right corner indicated by white box. Indicative scale bar on the images is 50 um. Bar graph to the right shows the number of J2 signals in HnRNPK non-induced (−DOX (−D); n = 81 cells) and HnRNPK induced (DOX+(+D); n = 53 cells) cells from three replicates quantified as RNA spots per cell using Imaris spot detection tools. Data are presented as mean values +/−SEM. Statistical significance was calculated by Two-tailed unpaired t-test. b Immunoblot showing the levels of HnRNPK and IER3 in −DOX (−D) and +DOX (+D) A549 cells. GAPDH was used as an internal loading control. The similar results were observed in an independent experiment. Histograms showing the relative band intensities of the western blot are shown left side. The p values were calculated using two-sided Student’s t-test and data are presented ± SD from two independent replicates. c RNAscope images of DOX (−D/+D) induced HnRNPK cells showing IER3 (red) and IER3-AS1 (green) in control (−D) and hnRNPK overexpressed (+D) cells. Panel to the right showing magnified images of the merged panel indicated by white box. Yellow arrows depict colocalized IER3/IER3-AS1 dsRNA (yellow dots). Indicative scale bar on the images is 50 um. d Bar graph showing the number of IER3-AS1 and IER3 RNA signals per cell in control (−D; n = 80 cells) and hnRNPK overexpressed (+D; n = 121 cells) cells quantified using Imaris spot detection tools from three replicates. Data are presented as mean values +/−SEM. Statistical significance was calculated by Two-way ANOVA (Sidak’s multiple comparisons test. e Dot plots showing the average number of colocalized signals of IER3-AS1/IER3 (dsRNA) per cell in control (−D) and hnRNPK overexpressed (+D) cells. A total of 150 cells were manually counted from three independent replicates. Data are presented as mean values + / SEM. Statistical significance was calculated by Two-tailed unpaired t-test. For figures (a, d and e) *p ≤ 0.05; **p ≤ 0.005; ***p ≤ 0.0005. f Model explaining the role of HnRNPK in the regulation of global dsRNA.

Similar articles

Cited by

References

    1. Katayama S, et al. Antisense transcription in the mammalian transcriptome. Science. 2005;309:1564–1566. doi: 10.1126/science.1112009. - DOI - PubMed
    1. Derrien T, et al. The GENCODE v7 catalog of human long noncoding RNAs: analysis of their gene structure, evolution, and expression. Genome Res. 2012;22:1775–1789. doi: 10.1101/gr.132159.111. - DOI - PMC - PubMed
    1. Akhade VS, Pal D, Kanduri C. Long noncoding RNA: genome organization and mechanism of action. Adv. Exp. Med. Biol. 2017;1008:47–74. doi: 10.1007/978-981-10-5203-3_2. - DOI - PubMed
    1. Amaral PP, et al. Genomic positional conservation identifies topological anchor point RNAs linked to developmental loci. Genome Biol. 2018;19:32. doi: 10.1186/s13059-018-1405-5. - DOI - PMC - PubMed
    1. Turner N, Grose R. Fibroblast growth factor signalling: from development to cancer. Nat. Rev. Cancer. 2010;10:116–129. doi: 10.1038/nrc2780. - DOI - PubMed

Publication types