

Longitudinal corpus callosum microstructural decline in early-stage Parkinson's disease in association with akinetic-rigid symptom severity
- PMID: 36038586
- PMCID: PMC9424284
- DOI: 10.1038/s41531-022-00372-1
Longitudinal corpus callosum microstructural decline in early-stage Parkinson's disease in association with akinetic-rigid symptom severity
Abstract
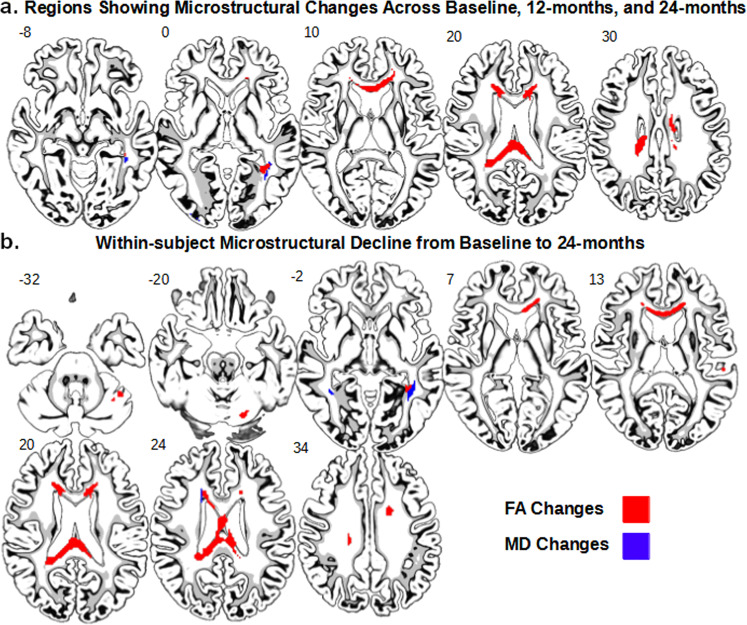
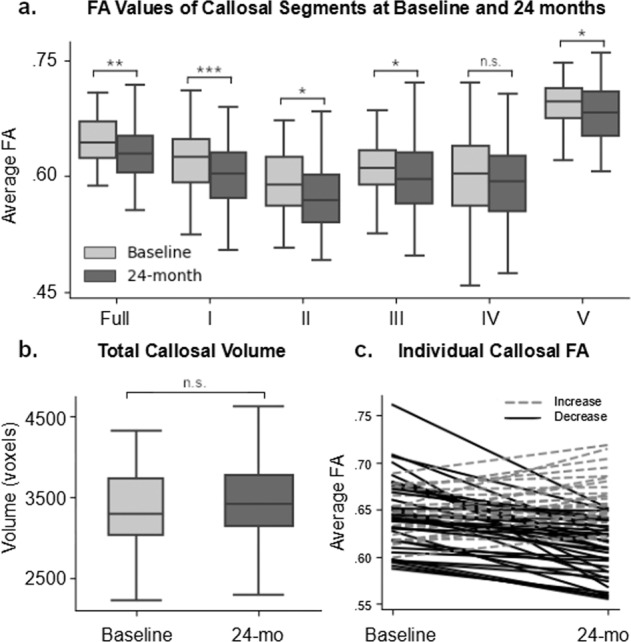
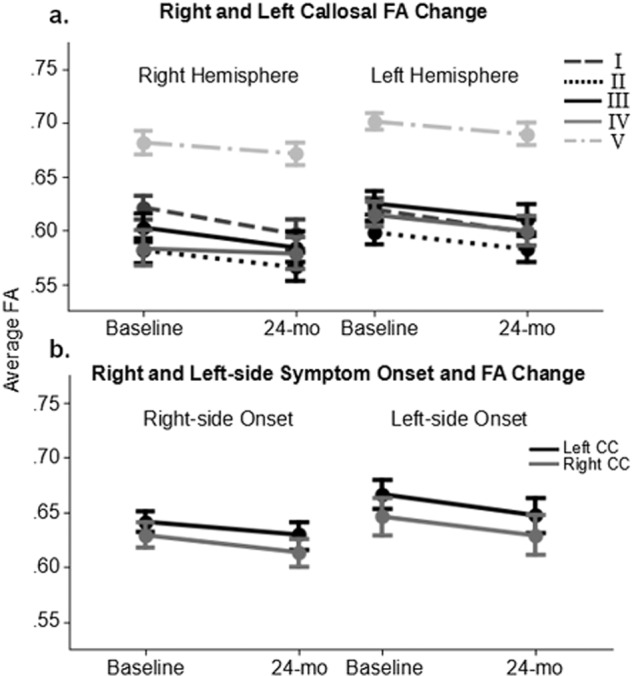
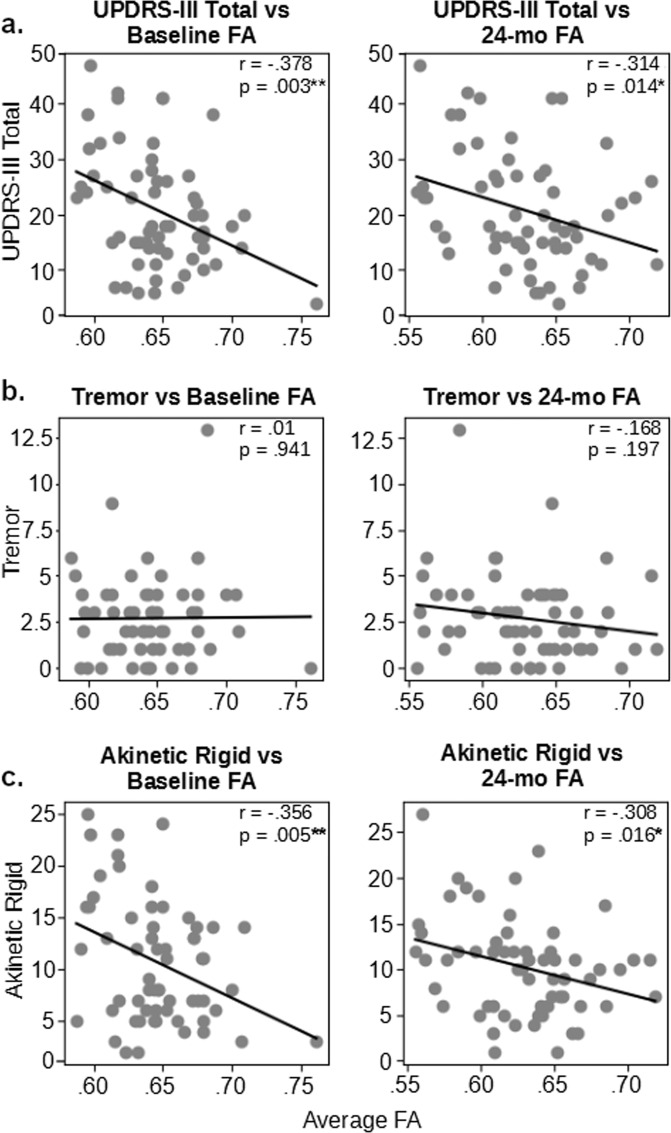
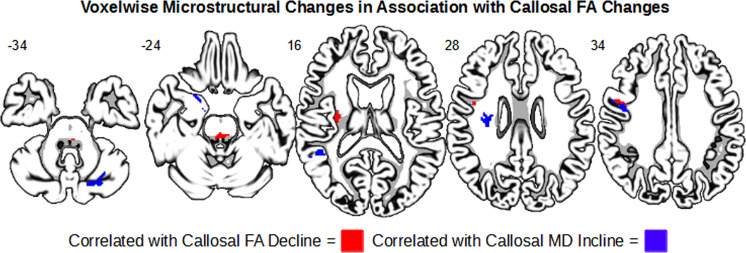
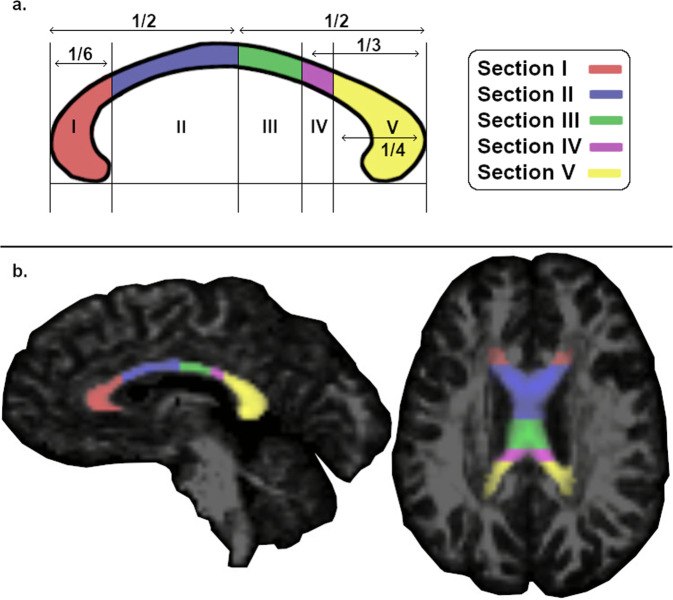
Previous diffusion tensor imaging (DTI) studies of Parkinson's disease (PD) show reduced microstructural integrity of the corpus callosum (CC) relative to controls, although the characteristics of such callosal degradation remain poorly understood. Here, we utilized a longitudinal approach to identify microstructural decline in the entire volume of the CC and its functional subdivisions over 2 years and related the callosal changes to motor symptoms in early-stage PD. The study sample included 61 PD subjects (N = 61, aged 45-82, 38 M & 23 F, H&Y ≤ 2) from the Parkinson's Progressive Markers Initiative database (PPMI). Whole-brain voxel-wise results revealed significant fractional anisotropy (FA) and mean diffusivity (MD) changes in the CC, especially in the genu and splenium. Using individually drawn CC regions of interest (ROI), our analysis further revealed that almost all subdivisions of the CC show significant decline in FA to certain extents over the two-year timeframe. Additionally, FA seemed lower in the right hemisphere of the CC at both time-points, and callosal FA decline was associated with FA and MD decline in widespread cortical and subcortical areas. Notably, multiple regression analysis revealed that across-subject akinetic-rigid severity was negatively associated with callosal FA at baseline and 24 months follow-up, and the effect was strongest in the anterior portion of the CC. These results suggest that callosal microstructure alterations in the anterior CC may serve as a viable biomarker for akinetic-rigid symptomology and disease progression, even in early PD.
© 2022. The Author(s).
Conflict of interest statement
The authors declare no competing interests.
Figures
Similar articles
-
Progressive Decline in Gray and White Matter Integrity in de novo Parkinson's Disease: An Analysis of Longitudinal Parkinson Progression Markers Initiative Diffusion Tensor Imaging Data.Front Aging Neurosci. 2018 Oct 8;10:318. doi: 10.3389/fnagi.2018.00318. eCollection 2018. Front Aging Neurosci. 2018. PMID: 30349475 Free PMC article.
-
Longitudinal Macro/Microstructural Alterations of Different Callosal Subsections in Parkinson's Disease Using Connectivity-Based Parcellation.Front Aging Neurosci. 2020 Nov 4;12:572086. doi: 10.3389/fnagi.2020.572086. eCollection 2020. Front Aging Neurosci. 2020. PMID: 33328954 Free PMC article.
-
Corpus callosum damage in PSP and unsteady PD patients: A multimodal MRI study.Neuroimage Clin. 2024;43:103642. doi: 10.1016/j.nicl.2024.103642. Epub 2024 Jul 15. Neuroimage Clin. 2024. PMID: 39029159 Free PMC article.
-
The role of diffusion tensor imaging and fractional anisotropy in the evaluation of patients with idiopathic normal pressure hydrocephalus: a literature review.Neurosurg Focus. 2016 Sep;41(3):E12. doi: 10.3171/2016.6.FOCUS16192. Neurosurg Focus. 2016. PMID: 27581308 Review.
-
Quantitative evaluation of callosal abnormalities in relapsing-remitting multiple sclerosis using diffusion tensor imaging: A systemic review and meta-analysis.Clin Neurol Neurosurg. 2021 Feb;201:106442. doi: 10.1016/j.clineuro.2020.106442. Epub 2020 Dec 24. Clin Neurol Neurosurg. 2021. PMID: 33373835
Cited by
-
Convergent reductions in interhemispheric functional, structural and callosal connectivity in Parkinson's disease.Front Aging Neurosci. 2025 Feb 13;17:1512130. doi: 10.3389/fnagi.2025.1512130. eCollection 2025. Front Aging Neurosci. 2025. PMID: 40018517 Free PMC article.
-
Preliminary evidence of links between ayahuasca use and the corpus callosum.Front Psychiatry. 2022 Oct 26;13:1002455. doi: 10.3389/fpsyt.2022.1002455. eCollection 2022. Front Psychiatry. 2022. PMID: 36386967 Free PMC article.
-
Microstructural Changes in the Corpus Callosum in Neurodegenerative Diseases.Cureus. 2024 Aug 21;16(8):e67378. doi: 10.7759/cureus.67378. eCollection 2024 Aug. Cureus. 2024. PMID: 39310519 Free PMC article. Review.
-
Thalamic-limbic circuit dysfunction and white matter topological alteration in Parkinson's disease are correlated with gait disturbance.Front Aging Neurosci. 2024 Sep 4;16:1426754. doi: 10.3389/fnagi.2024.1426754. eCollection 2024. Front Aging Neurosci. 2024. PMID: 39295640 Free PMC article.
-
White matter biomarker for predicting de novo Parkinson's disease using tract-based spatial statistics: a machine learning-based model.Quant Imaging Med Surg. 2024 Apr 3;14(4):3086-3106. doi: 10.21037/qims-23-1478. Epub 2024 Mar 28. Quant Imaging Med Surg. 2024. PMID: 38617147 Free PMC article.
References
LinkOut - more resources
Full Text Sources
