. 2022 Sep;28(9):1872-1882.
doi: 10.1038/s41591-022-01916-x. Epub 2022 Aug 29.

Tumor immune contexture is a determinant of anti-CD19 CAR T cell efficacy in large B cell lymphoma

Affiliations

Tumor immune contexture is a determinant of anti-CD19 CAR T cell efficacy in large B cell lymphoma

Nathalie Scholler et al. Nat Med. 2022 Sep.

Abstract

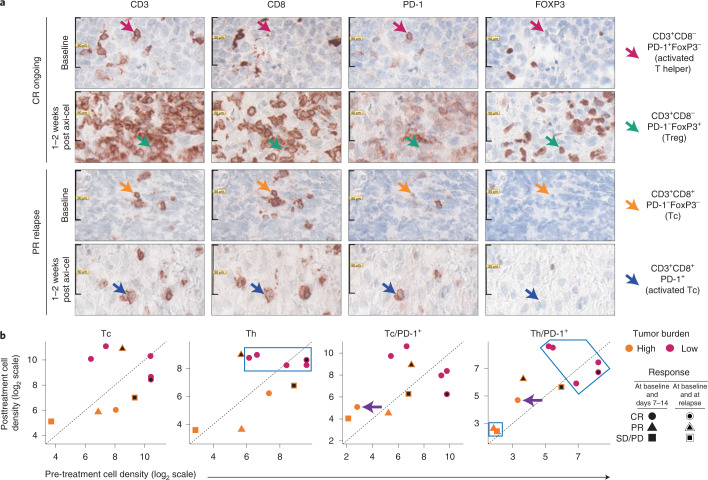
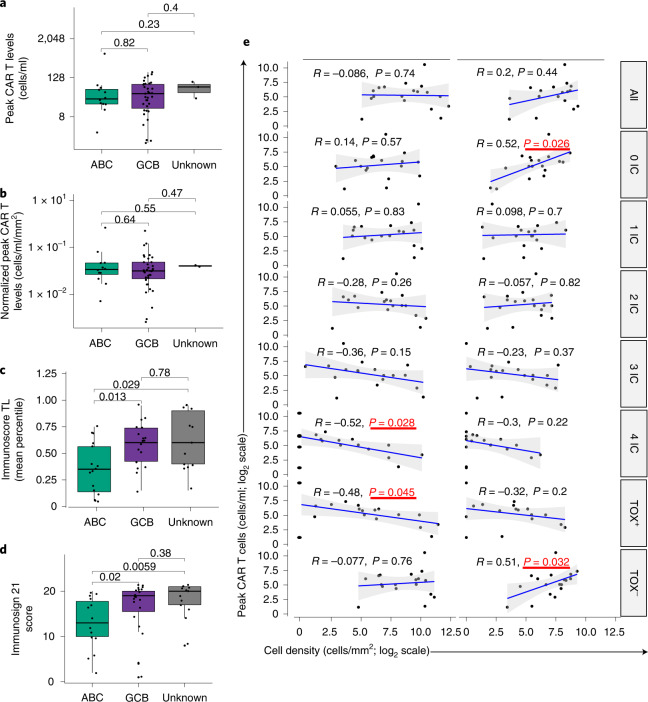
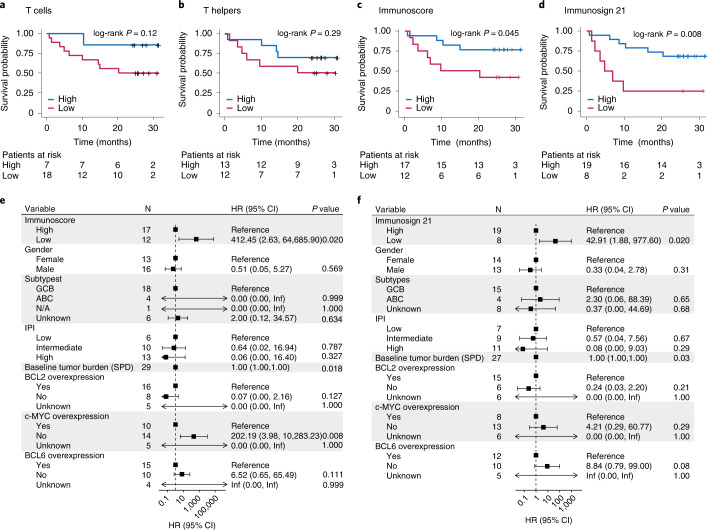
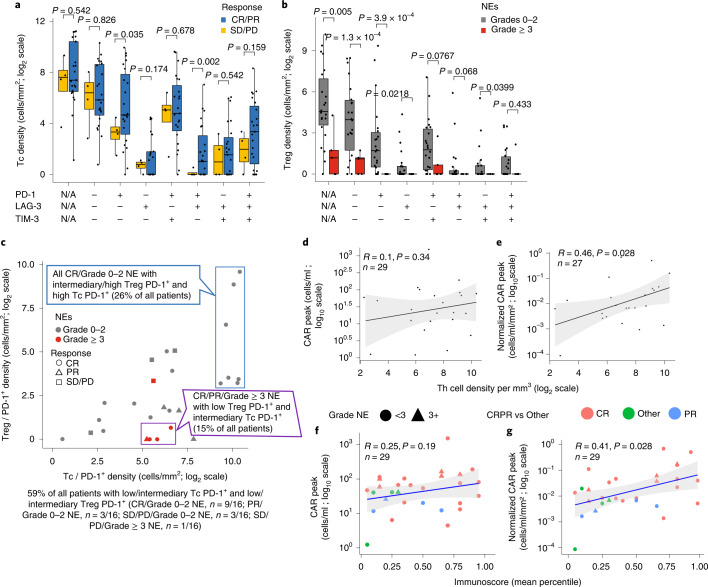
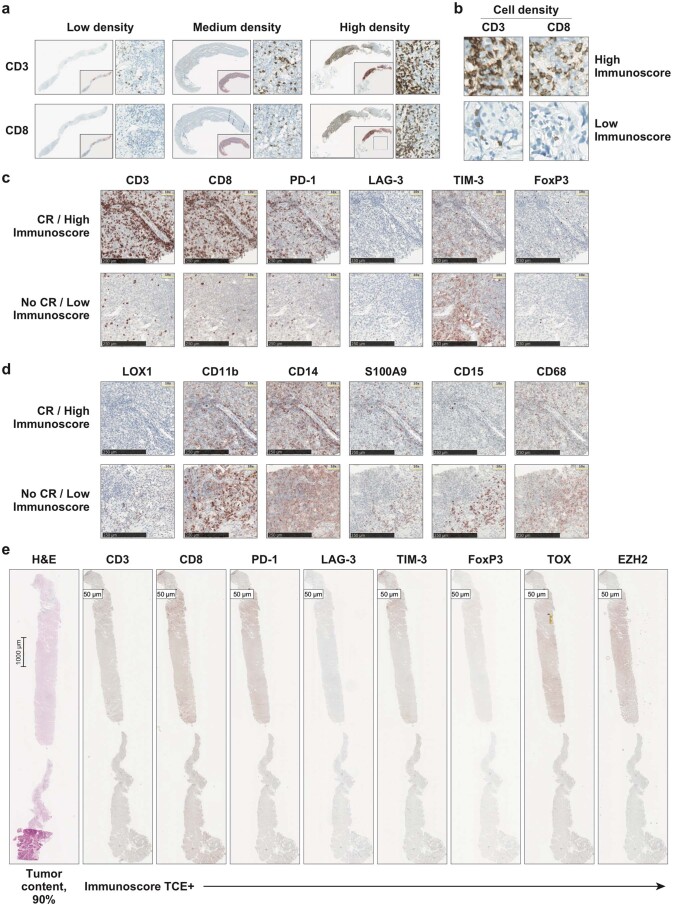
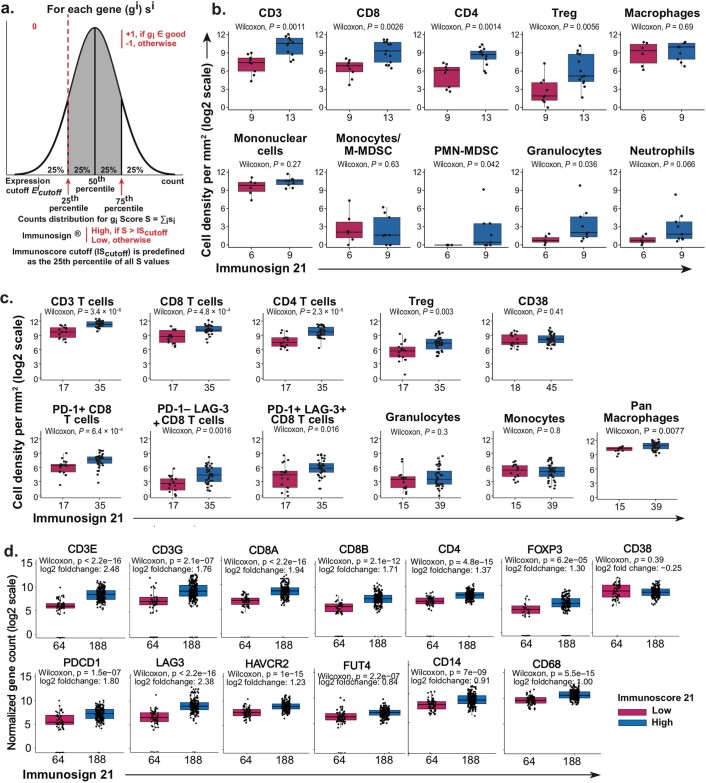
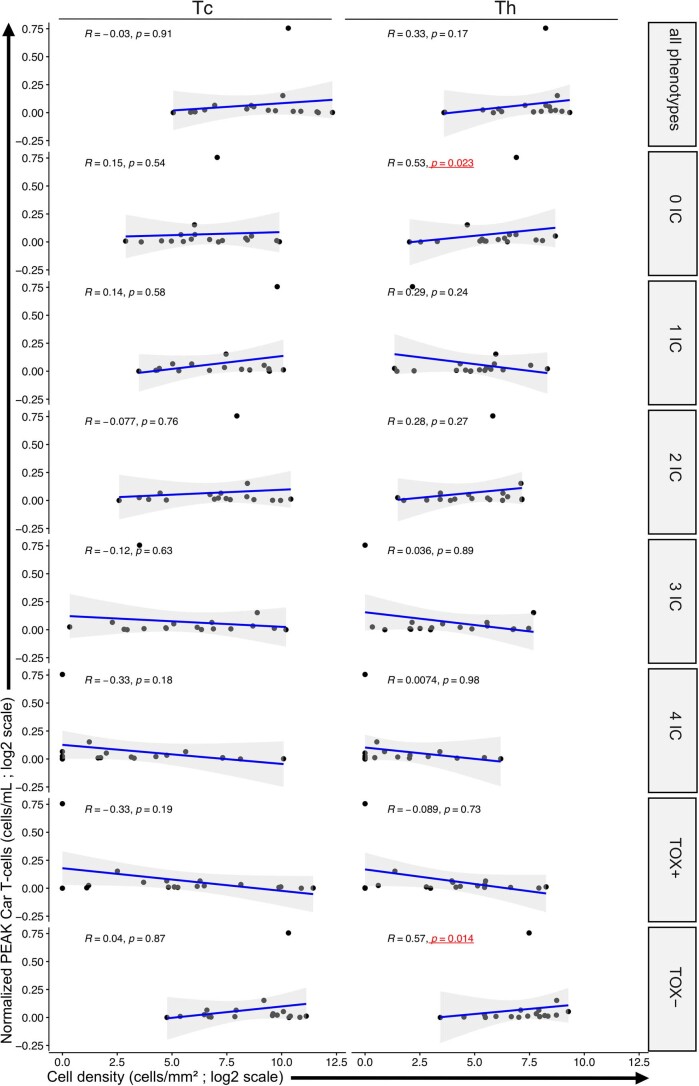
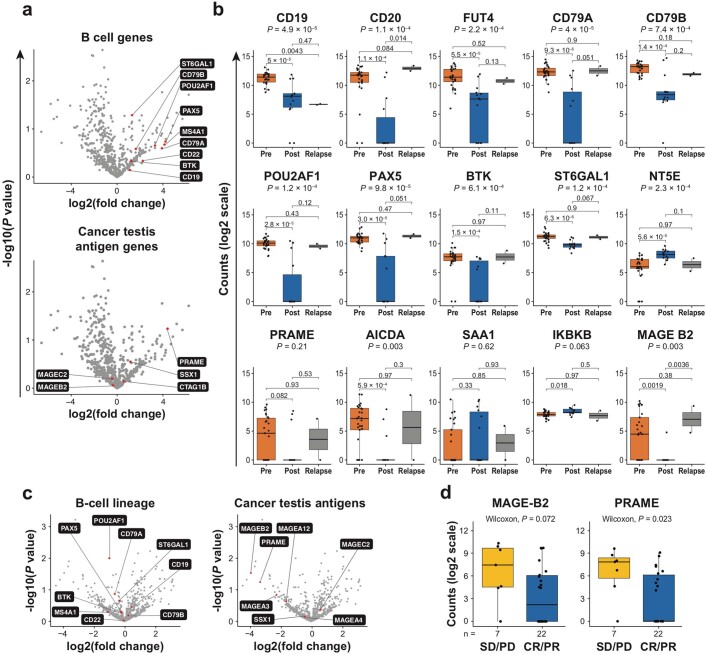
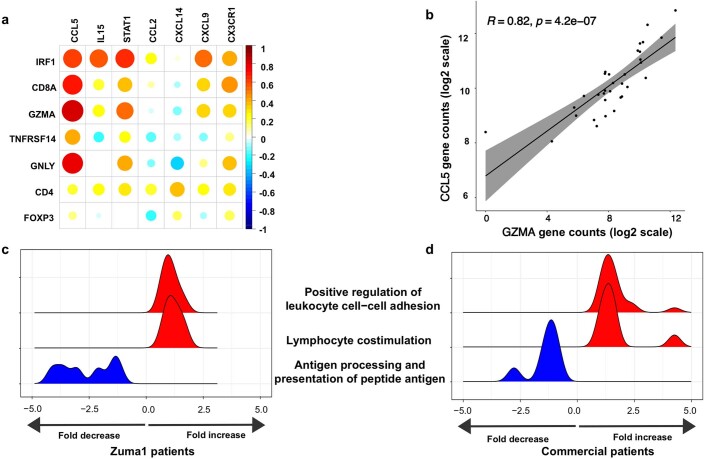
Axicabtagene ciloleucel (axi-cel) is an anti-CD19 chimeric antigen receptor (CAR) T cell therapy approved for relapsed/refractory large B cell lymphoma (LBCL) and has treatment with similar efficacy across conventional LBCL subtypes. Toward patient stratification, we assessed whether tumor immune contexture influenced clinical outcomes after axi-cel. We evaluated the tumor microenvironment (TME) of 135 pre-treatment and post-treatment tumor biopsies taken from 51 patients in the ZUMA-1 phase 2 trial. We uncovered dynamic patterns that occurred within 2 weeks after axi-cel. The biological associations among Immunoscore (quantification of tumor-infiltrating T cell density), Immunosign 21 (expression of pre-defined immune gene panel) and cell subsets were validated in three independent LBCL datasets. In the ZUMA-1 trial samples, clinical response and overall survival were associated with pre-treatment immune contexture as characterized by Immunoscore and Immunosign 21. Circulating CAR T cell levels were associated with post-treatment TME T cell exhaustion. TME enriched for chemokines (CCL5 and CCL22), γ-chain receptor cytokines (IL-15, IL-7 and IL-21) and interferon-regulated molecules were associated with T cell infiltration and markers of activity. Finally, high density of regulatory T cells in pre-treatment TME associated with reduced axi-cel-related neurologic toxicity. These findings advance the understanding of LBCL TME characteristics associated with clinical responses to anti-CD19 CAR T cell therapy and could foster biomarker development and treatment optimization for patients with LBCL.


Conflict of interest statement

N.S. reports employment with Kite, a Gilead company, and stock or other ownership in Gilead Sciences, Bristol Myers Squibb and Seattle Genetics. R.P. reports employment with HalioDx. F.L.L. reports a scientific advisory role for Kite, a Gilead company, Novartis, Amgen, Celgene/Bristol Myers Squibb, GammaDelta Therapeutics, Wugen, Calibr and Allogene; a consultancy with grant options for Cellular Biomedicine Group; and research support from Kite, a Gilead company. M.D.J. reports a consultancy/advisory for Kite, a Gilead company, Novartis, Bristol Myers Squibb and Takeda. S.T. reports employment with, a leadership role at, stock or other ownership in and travel support from HalioDx. C.D. reports stock or other ownership in HalioDx. E.C.C., J.J.K., A.X., M.M. and J.M.R. report employment with Kite, a Gilead company, and stock or other ownership in Gilead Sciences. S.S.N. has received personal fees from Kite, a Gilead company, Merck, Bristol Myers Squibb, Novartis, Celgene, Pfizer, Allogene Therapeutics, Cell Medica/Kuur, Incyte, Precision Biosciences, Legend Biotech, Adicet Bio, Calibr and Unum Therapeutics; has received research support from Kite, a Gilead company, Bristol Myers Squibb, Merck, Poseida, Cellectis, Celgene, Karus Therapeutics, Unum Therapeutics, Allogene Therapeutics, Precision Biosciences and Acerta; has received royalties from Takeda; and has intellectual property related to cell therapy. D.B.M. reports a consultancy or advisory role for Kite-Gilead, Novartis, Juno-Celgene-Bristol Myers Squibb, Adaptive Biotech, Pharmacyclics and Janssen; research funding from Kite-Gilead, Novartis, Juno-Celgene-Bristol Myers Squibb, Adaptive Biotech and Pharmacyclics; patents, royalties or other intellectual property from Pharmacyclics; and travel support from Kite-Gilead, Novartis, Juno-Celgene-Bristol Myers Squibb, Adaptive Biotech, Pharmacyclics and Janssen. C.A.J. reports honoraria from Kite, a Gilead company, Celgene, Novartis, Pfizer, Humanigen, Precision Biosciences, Nkarta, Lonza and AbbVie; a consulting or advisory role with Kite, a Gilead company, Celgene, Novartis, Pfizer, Humanigen, Precision Biosciences, Nkarta, Lonza and AbbVie; speakers bureau participation for Axis and Clinical Care Options; research funding from Pfizer; and travel, accommodations and expenses from Kite, a Gilead company, Celgene, Novartis, Pfizer, Humanigen, Precision Biosciences and Lonza. L.J.L. has no relevant financial relationships to disclose. Y.L. reports a consultancy or advisory role for Kite, a Gilead company, Janssen, Novartis, Celgene, Bluebird Bio, Juno, Legend, Sorrento, Gamida Cells and Vineti; and research funding from Kite, a Gilead company, Janssen, Celgene, Bluebird Bio, Merck and Takeda. A.G. reports a consultancy or advisory role for Kite, a Gilead company, Amgen, Atara, Wugen and Celgene; and honoraria from Kite, a Gilead company. J.C. reports employment with Gilead Sciences; stock or other ownership in Five Prime Therapeutics and Gilead Sciences; patents, royalties or other intellectual property from Five Prime Therapeutics; and travel support from Kite, a Gilead company. V.P. reports employment with, and travel support from, Kite, a Gilead company; and stock or other ownership in Gilead Sciences. Z.W. reports previous employment with Seattle Genetics and current employment with Kite, a Gilead company; and stock or other ownership with Seattle Genetics and Gilead Sciences. A.B. reports employment with Kite, a Gilead company; and stock or other ownership in, a consultancy or advisory role for and travel support from Gilead Sciences. J.G. reports stock or other ownership in HalioDx; honoraria from, and a consultancy or advisory role for, HalioDx, Bristol Myers Squibb, Merck Serono, IO Biotech, Illumina, Northwest Biotherapeutics, Amgen, Catalym, Lunaphore and Merck; research funding from MedImmune, AstraZeneca, IO Biotech, Janssen, Imcheck Therapeutics and PerkinElmer; and patents, royalties or other intellectual property from INSERM. Immunoscore is a registered trademark from INSERM, licensed to HalioDx.

Figures

Fig. 1
Fig. 1. Evolution of TME after axi-cel infusion associated with clinical outcomes in ZUMA-1.
a, Heat map of gene expression measured by PanCancer Immune Profiling panel (NanoString) in FF tumor biopsy specimens from patients in ZUMA-1 at baseline (before conditioning and axi-cel infusion, subset 1, n = 23) and 2–4 weeks after axi-cel infusion (subset 2, n = 13). Among the genes with significant differential expression between pre-treatment and post-treatment (two-sided t-test without adjustment, P < 0.05), shown genes were selected according to their belonging to a specific TME-related signature. Patients with CR (n = 18 (12 pre-treatment; six within 2 weeks post-treatment)), PR (n = 7, as noted by asterisks (five pre-treatment, two within 2 weeks post-treatment)) and SD/PD (n = 11 (six pre-treatment, four within 2 weeks post-treatment and one with SD within 4 weeks post-treatment) are shown. The color range is set to log-transform scaled values. Scaled values are calculated by dividing by the standard deviation. b,c, Expression of T cell–related genes (b) and B cell lineage genes (c) measured by PanCancer Immune Profiling panel in paired FF biopsy specimens. Values and two-sided t-test without adjustment in embedded tables. DC, dendritic cell; FOXP3, forkhead box P3; GZMA, granzyme A; IL, interleukin; PAX5, paired box protein 5; PD, progressive disease; PD-1, programmed cell death protein 1; PR, partial response; SD, stable disease.
Fig. 2
Fig. 2. Evolution of T cell subset densities in the TME after axi-cel infusion.
a, Representative T cell subset densities measured by Immunoscore TCE/TCE+ in patients with ongoing CR versus PR with relapse before and after axi-cel infusion (FFPE biopsy specimens, one staining per sample per marker). b, Evolution of T cell subset densities in the TME as a function of clinical response and TB. Analysis by Immunoscore TCE/TCE+ of FFPE biopsy specimens from ten patients in ZUMA-1 with high (>3,000 mm2; n = 5) or low (<3,000 mm2; n = 5) TB. Seven of the paired samples belonged to subsets 1 and 2, and three belonged to subsets 1 and 3. Six patients had CR; two patients had PR; and two patients had SD/PD. In the Th panel, the blue square indicates five patients with CR with low TB and high Th cell density within the TME pre-infusion and post-infusion (50% of tested patients, two-sided exact Fisher test, P = 0.10). One patient relapsed >6 months after initial CR (circle with black center). The purple arrows in the Tc/PD-1+ and Th/PD-1+ panels indicate a patient with CR despite high TB and with increased PD-1+ tumor-infiltrating T cells in post-treatment TME (10% of tested patients). The black square in the Th/PD-1+ panel indicates non-CR patients with high TB and low CD4+ T cell density pre-treatment and post-treatment (20% of tested patients, Fisher test, P = 0.09). Data are also shown for two patients (one with PR and one with SD/PD) with high TB and intermediary/high tumor-infiltrating T cell density post-infusion who both relapsed (20% of tested patients, Fisher test, P = 0.10). FOXP3, forkhead box P3; PD, progressive disease; PD-1, programmed cell death protein 1; PR, partial response; SD, stable disease.
Fig. 3
Fig. 3. Correlations between circulating CAR T cell levels and tumor immune contexture.
ad, COO subtypes were determined by independent transcriptomics analyses in ZUMA-1 samples (n = 51) (a,b) and commercially available DLBCL biopsies (c,d) at diagnosis (n = 50, 16/20/14 for ABC/GCB/UN, respectively). COO subtypes were correlated to peak CAR T cell levels (two-sided t-test without adjustment P values as shown) absolute (a) or normalized (b) to TB and to Immunoscore TL (c) and Immunosign 21 (d). e, Peak CAR T cell levels were also correlated to cell densities of tumor-infiltrating Tc or Th measured with Immunoscore TCE+ panel in ZUMA-1 patient biopsies, 7–14 days after axi-cel infusion (subset 2, n = 18). Tc and Th phenotypes were classified by checkpoint expression (PD-1+/–, LAG-3+/–, TIM-3+/– and TOX+/–). The gray ribbons represent the 95% confidence interval of the regression line. Statistical significance of the Spearman coefficient level (two-sided P value) was calculated, and significant P values (<0.05) are shown in red squares. From top to bottom: all phenotypes (any checkpoint), 0 IC (no checkpoint), 1 IC (any one checkpoint: PD-1 or LAG-3 or TIM-3 or TOX), 2 IC (any two checkpoints: PD-1+LAG-3+ or PD-1+TIM-3+ or PD-1+TOX+ or LAG-3+TIM-3+ or LAG-3+/TOX+ or TIM-3+TOX+), 3 IC (any three checkpoints: PD-1+LAG-3+TIM-3+ or PD-1+LAG-3+TOX+ or LAG-3+TIM-3+TOX+), 4 IC (all four checkpoints: PD-1+LAG-3+TIM-3+TOX+), TOX+ (TOX+ in combination with any checkpoint(s): TOX+PD-1+/–LAG-3+/–TIM-3+/–) and TOX (any combination of checkpoint(s) without TOX: TOXPD-1+/–LAG-3+/–TIM-3+/–). LAG-3, lymphocyte activation gene 3; PD-1, programmed cell death protein 1; TIM-3, T cell immunoglobulin and mucin domain 3; TOX, thymocyte selection–associated high mobility group box.
Fig. 4
Fig. 4. Pre-treatment tumor immune contexture associated with survival probability of patients in ZUMA-1.
ad, Overall survival of patients in ZUMA-1 as a function of Tc (a) or Th (b) cell infiltration in pre-treatment TME, Immunoscore index (c) or Immunosign 21 score (d). The P values were generated by using an unweighted log-rank test with survminer package in R. e,f, Survival hazard ratios from multivariate analyses of ZUMA-1 patient clinical characteristics and pre-treatment tumor biopsies analyzed for Immunoscore (n = 29) (e) and Immunosign 21 (n = 27 (f). TB analysis was performed as continuous variable. Cox multivariate regression was used to calculate hazard ratio statistical significance. P values are two-sided. CI, confidence interval; HR, hazard ratio; Inf, infinity; N/A, no available molecular data to determine subtype; PD, progressive disease; PR, partial response; SD, stable disease; SPD, sum of the products of diameters.
Fig. 5
Fig. 5. T cell subsets in pre-treatment tumor biopsies associated with myeloid-secreted chemokines.
ac, Correlation between CXCL9 gene expression in pre-treatment tumor biopsies and CD8+ T cell tumor infiltrate measured by Immunoscore TCE panel (a) or CD8A gene expression (b,c) in patients in ZUMA-1 (subset 1; n = 19) (a), second-line patients with DLBCL (n = 252) (b) and treatment-naive patients with DLBCL (n = 67) (c). Gene expression was measured by PanCancer Immune panel for a and c and Immuno-Oncology 360 panel for b. df, Correlation matrix for myeloid-secreted and/or T cell–produced cytokines and chemokines (horizontal axis) with T cell subset–related genes (vertical axis) in pre-treatment tumor biopsies from ZUMA-1 (d), second-line (e) and treatment-naive patients with DLBCL (f). The scale bar (−1 to 1) represents the R value. The gray ribbons represent the 95% confidence interval of the regression line. Statistical significance of the Spearman coefficient level (two-sided P value as shown) was calculated. CCL, chemokine ligand; CXCL, chemokine C-X-C motif ligand; FoxP3, forkhead box P3; GNLY, granulysin; GZMA, granzyme A; IL, interleukin; IRF1, interferon regulatory factor 1; PD, progressive disease; PR, partial response; SD, stable disease; STAT, signal transducer and activator of transcription; NFRSF14, tumour necrosis factor receptor superfamily member 14.
Fig. 6
Fig. 6. Cell density of T cell subsets in pre-treatment tumor biopsies associated with axi-cel efficacy, NEs and CAR T cell expansion.
T cell subset densities were measured by Immunoscore TCE panel in ZUMA-1 tumor biopsies (n = 27) and plotted as a function of clinical response to axi-cel (CR/PR versus SD/PD; 19 CR, four PR and four SD/PD) or NE grade (grades 0–2, n = 22, versus grade ≥3, n = 5) and IC expression (PD-1, LAG-3 and TIM3). a, Tc density versus clinical response and IC expression. b, Treg density versus NE grade and IC expression. N/A = not applicable, regardless of PD-1, LAG3, TIM-3 expression (a,b). c, Correlation of clinical outcomes and NE grades with densities of tumor-infiltrating Tc and Treg cells. Two-sided exact Fisher test P value of responders with NE grade ≥3 and low Treg density (purple box) versus all other patients = 5.698 × 10−5; two-sided exact Fisher test P value of complete responders with NE grades 0–2 and high Treg density (blue box) versus all other patients = 0.02. d,e, Correlations of non-activated Th density measured by Immunoscore TCE panel and peak CAR T cells without (n = 23) (d) or with (n = 19) (e) normalization to pre-treatment TB. f,g, Correlations of Immunoscore and peak CAR T cells without (n = 29) (f) or with (n = 27) (g) normalization to pre-treatment TB. The gray ribbons (dg) represent the 95% confidence interval of the regression line. Statistical significance of the Spearman coefficient level (two-sided P value) as shown was calculated. LAG-3, lymphocyte activation gene 3; PD, progressive disease; PD-1, programmed cell death protein 1; PR, partial response; SD, stable disease; TIM-3, T cell immunoglobulin and mucin domain 3.
Extended Data Fig. 1
Extended Data Fig. 1. Characterization of ZUMA-1 tumour biopsy specimens analysed in this study.
a, Number of tumour biopsies per known anatomic location from Zuma 1 patients analysed in the manuscript; b, PCA of Zuma 1 baseline biopsies (subset 1) with the two first principal components of all gene expression. Data are colored by biopsy origin; lymph node, blue, n = 12; not lymph node origin (as indicated in a), yellow, n = 7; unknown origin, red, n = 10; c. Number of Zuma 1 patients analyzed in the manuscript, classification per subset, and overview of the longitudinal biopsies; d. Number of Zuma 1 patients analyzed in the manuscript with FF and/or FFPE biopsies classified per subset. FF, fresh frozen; FFPE, formalin-fixed paraffin embedded; PCA, principal component analysis.
Extended Data Fig. 2
Extended Data Fig. 2. Evolution of the tumour infiltrate in ZUMA-1 patients after axi-cel infusion associated with clinical outcomes independently of tumour burden.
a, Heatmap of gene expression measured by PanCancer Immune Profiling panel (NanoString) in FFPE tumour biopsy specimens pretreatment (subset 1, n = 29) or posttreatment (subset 2, n = 14) from Zuma 1 patients with high or low tumour burden at pretreatment. Among the genes with significant differential expression between pre and post treatment (Two-sided t.test without adjustment, p.value <0.05), shown genes were selected according to their belonging to a specific TME related signature. Patients with CR and low tumour burden, n = 17 (Subset 1, n = 12; Subset 2, n = 5); with CR and high tumour burden, n = 15 (Subset 1, n = 8; Subset 2, n = 7); without CR and low tumour burden, n = 2 (Subset 1); without CR and high tumour burden, n = 9 (Subset 1, n = 7; Subset 2, n = 2). PR (n=4, as noted by asterisks [2 pretreatment; 2 within 2 weeks posttreatment]. The color range is set to log-transform scaled values. Scaled values are calculated by dividing by the standard deviation. b-e, Gene expression measured by PanCancer Immune Profiling panel in paired specimens; (two sided t.test without adjustment); b,c, T-cell functional genes (b) and myeloid- and cytokine-related genes (c) in FF biopsies; d,e, CXCL10 and CXCL11 genes in FF (d) vs. FFPE (e) biopsies. *P < 0.1 and ***P < 0.01. f,g, Volcano plots of gene expression from pre- vs. posttreatment biopsies of patients with SD/PD or CR/PR (as indicated) for B-cell lineage (f) and CTA genes (g). The plots were constructed using log2(fold change) and log10 (P values) for all genes. Red dots represent the top differentially expressed genes with P<0.01. h, Comparative gene expression of B-cell lineage selected markers in pre- vs posttreatment biopsies. *P < 0.1 and **P < 0.05.(Two-sided t.test without adjustment). axi-cel, axicabtagene ciloleucel; CCL, chemokine ligand; CR, complete response; CTA, cancer testis antigen; CTLA-4, cytotoxic T lymphocyte–associated protein 4; CXCL, chemokine C-X-C motif ligand; DC, dendritic cell; MAGE-B2, melanoma-associated antigen B2; PD, progressive disease; PD-L1, programmed death-ligand 1; PF: Fresh frozen; FFPE, formalin-fixed paraffin-embedded; POU2AF1, POU domain class 2-associating factor 1; PR, partial response; SD, stable disease.
Extended Data Fig. 3
Extended Data Fig. 3. Overview of Immunoscore index, Immunoscore TCE/TCE+ panels, and Immunoscore SC panel.
a,b, Following the pathologist selection of a digital image area, IHC staining of CD3 and CD8 was quantified by the application of a prespecified bioinformatics algorithm that generated analysis cutoffs and a numerical index named Immunoscore. Because the majority of lymph node biopsy specimens lacked an identifiable invasive margin, as expected for lymphoma, cell densities were calculated from the core tumour only. a, Representative images (250- and 1000-µm scales) of CD3 and CD8 T-cell densities (low, medium, or high) in tumour biopsy specimens. b, Representative images (50- µm scale) of CD3 and CD8 T-cell densities in patients with a high (top panels) or low (bottom panels) Immunoscore index. c,d, Representative images (250-µm scale) of successive stainings with Immunoscore TCE (c) and Immunoscore SC (d) panels of tumour biopsy specimens from patients in ZUMA-1 with CR (top panels) or without CR (bottom panels). e, Representative images (50-µm scale) of stainings with Immunoscore TCE+ panel of tumour biopsy specimens. One staining per sample per marker. EZH2, enhancer of zeste homolog 2; FOXP3, forkhead box P3; H&E, haematoxylin and eosin; IHC, immunohistochemistry; LAG-3, lymphocyte-activation gene 3; LOX-1, lectin-type oxidised LDL receptor 1; PD-1, programmed cell death protein 1; SC, Suppressive Cell; TCE, T-cell Exhaustion; TIM-3, T-cell immunoglobulin and mucin domain 3; TOX, thymocyte selection–associated high mobility group box.
Extended Data Fig. 4
Extended Data Fig. 4. Overview of Immunoscore TCE+ panel.
a, Representative images (50-µm scale; 40× magnification) of staining with Immunoscore TCE+ panel of ZUMA-1 tumour biopsy specimens from patients with ongoing CR versus relapse after PR, at pre- (top panels) and posttreatment (bottom panels). b, Representative images (50-µm scale; 40× magnification) of cell phenotyping with Immunoscore TCE+ panel in ZUMA-1 tumour biopsy specimens. Arrows point to helper T-cells (CD3+CD8–PD-1+LAG-3+TIM-3–FoxP3–TOX–EZH2+), cytotoxic T-cells (CD3+CD8+PD-1+LAG-3–TIM-3+FoxP3–TOX–EZH2+), regulatory T-cells (CD3+CD8–PD-1+LAG-3+/–TIM-3–FoxP3+TOX–EZH2+), exhausted helper T-cells (CD3+CD8–PD-1+LAG-3+TIM-3–FoxP3–TOX+EZH2+), and tumour cells (EZH2+CD3–). One staining per sample per marker. axi-cel, axicabtagene ciloleucel; CR, complete response; EZH2, enhancer of zeste homolog 2; FOXP3, forkhead box P3; LAG-3, lymphocyte-activation gene 3; PD-1, programmed cell death protein 1; PR, partial response; TCE, T-cell Exhaustion; TIM-3, T-cell immunoglobulin and mucin domain 3; TOX, thymocyte selection-associated high mobility group box.
Extended Data Fig. 5
Extended Data Fig. 5. Correlative analyses with Immunoscore panels.
a,b, Correlations of CD3+ (a) and CD8+ (b) T-cell densities measured with Immunoscore TL (X-axis) versus Immunoscore TCE (Y-axis) panels in ZUMA-1 patient biopsies at pretreatment (subset 1, n = 19). The grey ribbons represent the 95% Confidence Interval of the regression line. c, Correlation between cell phenotypes measured with Immunoscore TCE (X-axis) versus Immunoscore TCE+ (Y-axis) panels in two adjacent tissue slides (1 slide per panel) from ZUMA-1 patient biopsies (subset 1, n = 8). Statistical significance of the spearman coefficient level (two-sided P value) as shown. d, Association between cell densities of tumour-infiltrating immune subsets (T-cells or myeloid cells, as indicated) and Immunoscore index (low versus high) in ZUMA-1 patient biopsies (subset 1, n = 24 and n = 18, respectively). Two-sided Wilcoxon test, p values as shown. ABC, activated B-cell DLBCL subtype; DLBCL, diffuse large B-cell lymphoma; GCB, germinal centre B-cell DLBCL subtype; LAG-3, lymphocyte-activation gene 3; IC, immune checkpoint; M-MDSC, monocytic myeloid-derived suppressor cell; PD-1, programmed cell death protein 1; PMN-MDSC, polymorphonuclear myeloid-derived suppressor cell; Tc, cytotoxic T-cell; TCE, T-cell Exhaustion; Th, helper T-cell; TIM-3, T-cell immunoglobulin and mucin domain 3; Treg, regulatory T-cell.
Extended Data Fig. 6
Extended Data Fig. 6. Correlative studies of Immunosign 21 score with cell subsets across 3 independent datasets.
a, Definition of the Immunosign 21 score cutoff. The Immunosign 21 scoring function is an algorithm derived from the Immunoscore algorithm, is independent of clinical outcome, and is predefined as the 25th percentile of the observed scores among samples. b-d, Correlation of Immunosign 21 (low versus high) with cell subsets in 3 independent datasets (Two-sided Wilcoxon test). b,c, Immunosign 21 correlations with cell subset densities analysed by Immunoscore TCE/TCE+ panels in b, ZUMA-1 pretreatment tumour biopsy specimens from third line, r/r DLBCL patients (subset 1, n = 22 for T-cell subsets; n = 15 for myeloid subsets) and c, DLBCL biopsy specimens at diagnosis from treatment-naïve patients (n = 67). d, Immunosign 21 correlations with normalised gene expression of T-cells or of myeloid cells analysed by IO360 NanoString panel in pretreatment tumour biopsy specimens from second line DLBCL patients (n = 252). The number of samples per group is indicated on each panel. DLBCL, diffuse large B-cell lymphoma; FOXP3, forkhead box P3; LAG-3, lymphocyte-activation gene 3; M-MDSC, monocytic myeloid-derived suppressor cell; PD-1, programmed cell death protein 1; PMN-MDSC, polymorphonuclear myeloid-derived suppressor cell; SC, Suppressive cell; TCE, T-cell Exhaustion; TIM-3, T-cell immunoglobulin and mucin domain 3; Treg, regulatory T-cell.
Extended Data Fig. 7
Extended Data Fig. 7. Circulating peak CAR T-cell levels normalised to pretreatment tumour burden correlated to Immunoscore.
T-cell densities were measured with Immunoscore TCE+ panel in ZUMA-1 patient biopsies, 7 to 14 days after axi-cel infusion (Subset 2, n = 18). Tc (left panels) and Th (right panels) phenotypes were classified by checkpoint expression (PD-1+/–, LAG-3+/–, TIM-3+/–, TOX+/–). The grey ribbon represents the 95% Confidence Interval of the regression line. Statistical significance of the spearman coefficient level (two-sided P values) were calculated and significant p values (< 0.05) are shown in red squares. From top to bottom: all phenotypes (any checkpoint), 0 IC (no checkpoint), 1 IC (any 1 checkpoint: PD-1 or LAG-3 or TIM-3 or TOX), 2 IC (any 2 checkpoints: PD-1+/LAG-3+ or PD-1+/TIM-3+ or PD-1+/TOX+ or LAG-3+/TIM-3+ or LAG-3+/TOX+ or TIM-3+/TOX+), 3 IC (any 3 checkpoints: PD-1+LAG-3+TIM-3+ or PD-1+LAG-3+TOX+ or LAG-3+TIM-3+TOX+), 4 IC (all 4 checkpoints: PD-1+LAG-3+TIM-3+TOX+), TOX+ (TOX+ in combination with any checkpoint(s): TOX+PD-1+/–LAG-3+/–TIM-3+/–), TOX– (any combination of checkpoint(s) without TOX: TOX–PD-1+/–LAG-3+/–TIM-3+/–), and TOX only (TOX+PD-1–LAG-3–TIM-3–). axi-cel, axicabtagene ciloleucel; CAR, chimeric antigen receptor; LAG-3, lymphocyte-activation gene 3; IC, immune checkpoint; PD-1, programmed cell death protein 1; Tc, cytotoxic T-cell; Th, helper T-cell; TIM-3, T-cell immunoglobulin and mucin domain 3; TME, tumour microenvironment; TOX, thymocyte selection–associated high mobility group box.
Extended Data Fig. 8
Extended Data Fig. 8. Evolution of immune gene expression in tumour biopsies of ZUMA-1 patients who relapsed.
Gene expression was measured with PanCancer Immune Profiling panel in tumour biopsies from unpaired or paired samples (as indicated) of Zuma 1 patients from subset 1 (n=39; 19 unpaired FFPE; 23 unpaired FF; 3 paired FF), subset 2 (n=22; 14 unpaired FFPE; 12 unpaired FF; 3 paired FF), and subset 3 (n=4; 2 unpaired FFPE; 3 unpaired FF; 3 paired FF,). a-c, Gene expression related to anti-tumour immune response. a, Cytotoxic T-cell–related genes; b, cytokine and IFN-related genes; c, MHC class I–related genes. P values were derived with a Kruskal-Wallis test. d-i, Gene expression related to immunosuppressive response. d, Comparative gene expression of FoxP3, CTLA-4, CCR4, and CCL22 genes (Kruskal-Wallis test; P values as indicated) in biopsies from subset 1 (n = 19), subset 2 (n = 14), and subset 3 (n = 2); e-i, Ratios of gene expression for CTLA-4 with (e) CD3D or (f) CD3E (statistical significance of the spearman coefficient level (two-sided P value) embedded in panels; grey ribbons represent the 95% Confidence Interval of the regression line) and of FoxP3 with (g) CD3D, (h) CD3E, or (i) CD8A (Kruskal-Wallis test, P values as indicated). j,k, Correlations between gene expression of CCL22 and cell density of Treg measured by Immunoscore TCE panel (j) or gene expression of CCR4 (k) in tumour biopsies from Zuma 1 subset 1 pts (n = 14 and n = 16, respectively),two-sided Wilcoxon tests. axi-cel, axicabtagene ciloleucel; CCL, chemokine ligand; CCR, chemokine receptor; CTLA-4, cytotoxic T lymphocyte–associated protein 4; FOXP3, forkhead box P3; GZMA, granzyme A; HLA, human leucocyte antigen; IL, interleukin; IRF1, interferon regulatory factor 1; LAG-3, lymphocyte-activation gene 3; MHC, major histocompatibility complex; TCE, T-cell Exhaustion; TME, tumour microenvironment; Treg, regulatory T-cell.
Extended Data Fig. 9
Extended Data Fig. 9. B-cell lineage and CTA gene expression in tumour biopsies of ZUMA-1 patients.
Gene expression was measured with PanCancer Immune Profiling panel in Zuma 1 (a,b) tumour biopsies from subsets 1, 2, and 3, and (c,d) in pretreatment tumour biopsies from patients with CR (n=22 total [20 CR, 2 PR]) vs. nonCR (n=7 total [4 SD, 3 PD]) a, Volcano plots of B-cell lineage (top panel) and CTA (bottom panel) gene expression from subset 2 (n = 12) and subset 3 (n = 3). The plot was constructed using log2(fold change) and –log10(P value) for all genes analysed by PanCancer Immune Profiling panel. Red dots represent the top differentially expressed genes with P<0.01 (two-sided t.test without adjustment). b, Evolution of B-cell and CTA gene expression across FFPE biopsies from subsets 1 (n=19), 2 (n=14), and 3 (n=2). c, Volcano plots of B-cell lineage (left) and CTA-related (right) gene expression in pretreatment tumour biopsies of patients with CR vs. nonCR outcomes. P values were derived with a Kruskal-Wallis test. d, Gene expression of CTA-related genes (MAGE-B2 and PRAME) in pretreatment tumour biopsies of patients with CR/PR vs. SD/PD outcomes. P values were derived with two-sided Wilcoxon test.AICDA, activation-induced cytidine deaminase; axi-cel, axicabtagene ciloleucel; BTK, Bruton tyrosine kinase; CR, complete response; CTA, cancer testis antigen; FFPE, formalin-fixed paraffin-embedded; IKBKB, inhibitor of nuclear factor kappa B kinase subunit B; ; IS21, Immunosign21; MAGE, melanoma-associated antigen; PAX5, paired box protein 5; PD, progressive disease; POU2AF1, POU domain class 2-associating factor 1; PR, partial response; PRAME, preferentially expressed antigen in melanoma; SAA1, serum amyloid A1; SD, stable disease; TME, tumour microenvironment.
Extended Data Fig. 10
Extended Data Fig. 10. Correlative studies in Zuma 1 and commercial axi-cel patient datasets.
a,b,d. Pretreatment tumour biopsies from commercial patients (r/r DLBCL) were analysed with IO360 NanoString panel (n=33; 20 CR and 10 non-CR; 3 samples failed nanostring QC). a, Correlation matrix for myeloid-secreted and/or T-cell–produced cytokine/chemokines (horizontal axis) with T-cell subset–related genes (vertical axis) (Spearman R). The scale bar (-1 to 1) represents the R value. b, Gene expression correlation of CCL5 chemokine and cytotoxic T-cells–produced serine protease GZMA. Statistical significance of the spearman coefficient level (two-sided P value) in the panels. The grey ribbon represents the 95% Confidence Interval of the regression line. c,d. Comparison of regulation of three functional pathways (“Positive regulation of leukocyte cell-cell adhesion", "Lymphocyte costimulation", and "Antigen processing and peptide antigen presentation") in pretreatment, CR vs. non-CR, tumour biopsies from Zuma 1 (c, 20 CR, 9 non-CR) and commercial (d, 20 CR, 10 non-CR) patients. Functional pathways with statistically significant p values < 0.005 were selected and GSEA adjusted p.values were calculated with Benjamini-Hochberg method. Adjusted two-sided p.values of less than 0.5 in at least one of the two panels are shown. axi-cel, axicabtagene ciloleucel; CCL, chemokine ligand; CXCL, chemokine C-X-C motif ligand; DLBCL, diffuse large B-cell lymphoma; CR, complete response; non-CR, non-complete response; FoxP3, forkhead box P3; GNLY, granulysin; GZMA, granzyme A; IL, interleukin; IRF1, interferon regulatory factor 1; QC, quality control; r/r, relapse, refractory; STAT, signal transducer and activator of transcription; TNFRSF14, tumour necrosis factor receptor.

Comment in

References

    1. Jensen MC, Riddell SR. Design and implementation of adoptive therapy with chimeric antigen receptor-modified T cells. Immunol. Rev. 2014;257:127–144. - PMC - PubMed
    1. Yang JC, Rosenberg SA. Adoptive T-cell therapy for cancer. Adv. Immunol. 2016;130:279–294. - PMC - PubMed
    1. Dunbar, C.E. et al. Gene therapy comes of age. Science359, eaan4672 (2018). - PubMed
    1. June CH, O’Connor RS, Kawalekar OU, Ghassemi S, Milone MC. CAR T cell immunotherapy for human cancer. Science. 2018;359:1361–1365. - PubMed
    1. Locke FL, et al. Long-term safety and activity of axicabtagene ciloleucel in refractory large B-cell lymphoma (ZUMA-1): a single-arm, multicentre, phase 1-2 trial. Lancet Oncol. 2019;20:31–42. - PMC - PubMed

Publication types

MeSH terms