. 2023 Feb;41(2):252-261.
doi: 10.1038/s41587-022-01429-5. Epub 2022 Aug 29.

Human ureteric bud organoids recapitulate branching morphogenesis and differentiate into functional collecting duct cell types

Affiliations

Human ureteric bud organoids recapitulate branching morphogenesis and differentiate into functional collecting duct cell types

Min Shi et al. Nat Biotechnol. 2023 Feb.

Abstract

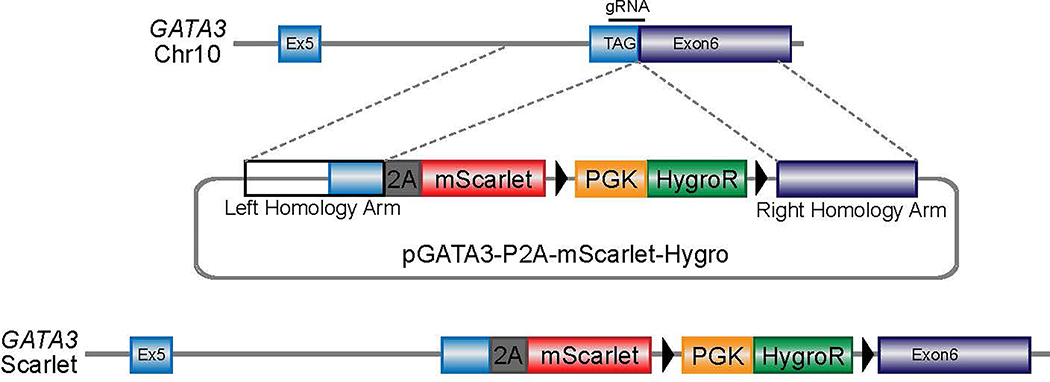
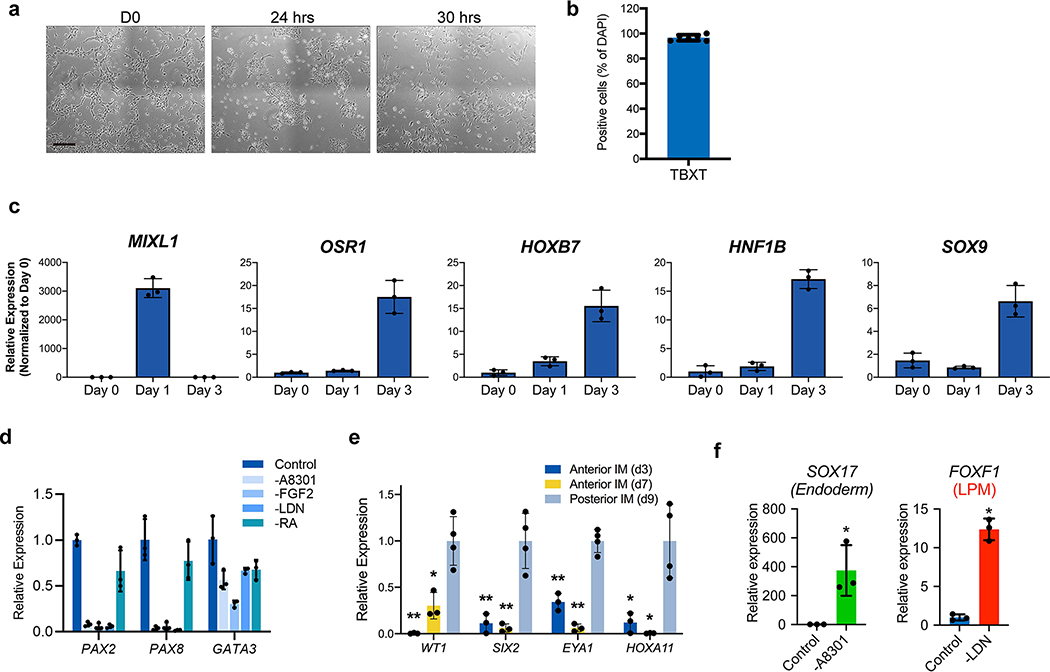
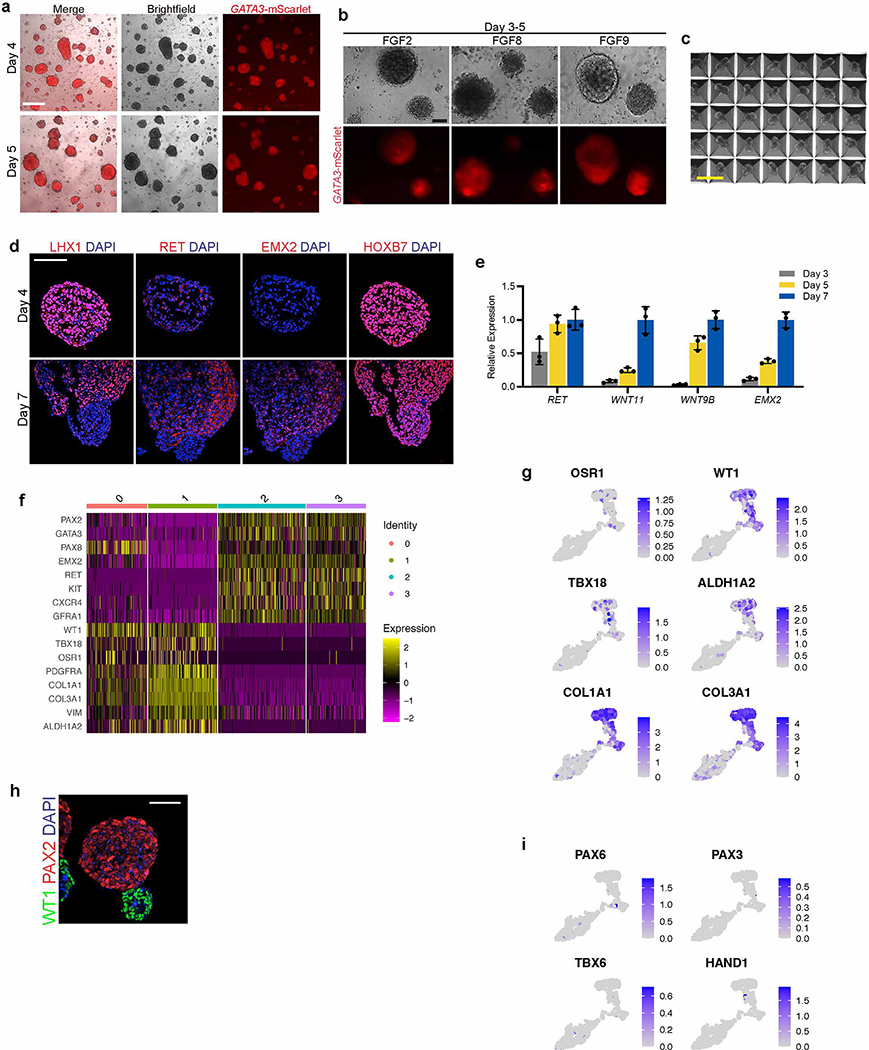
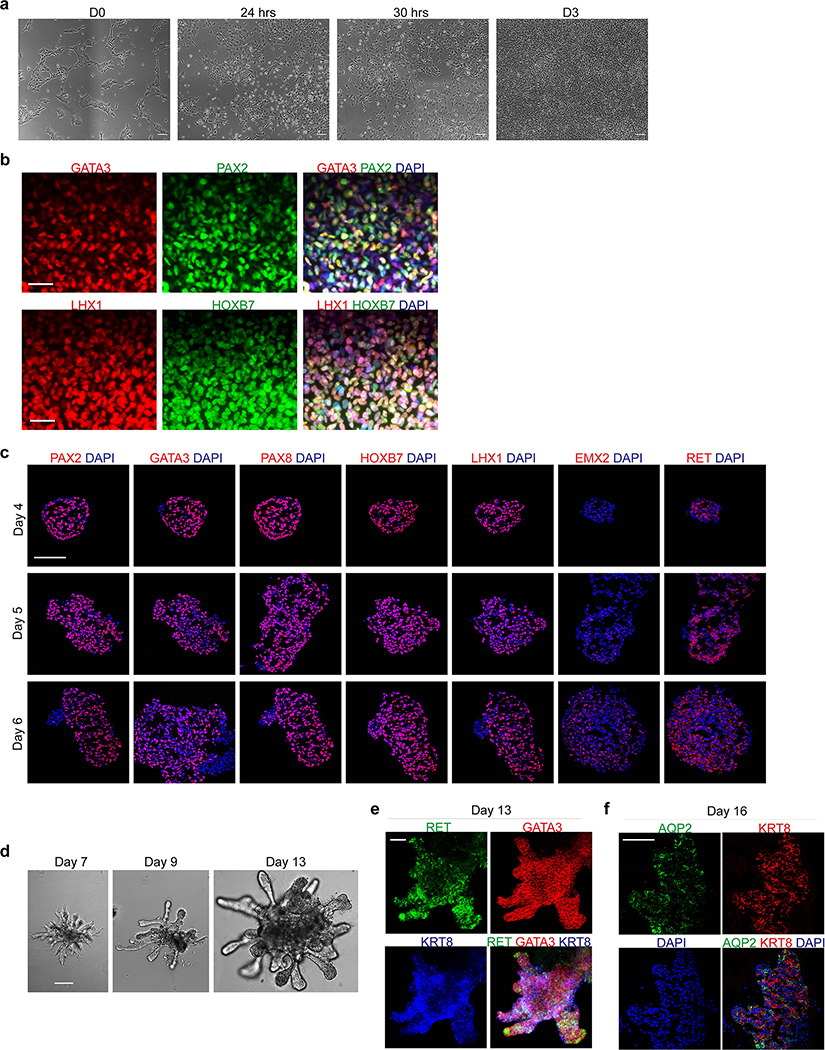
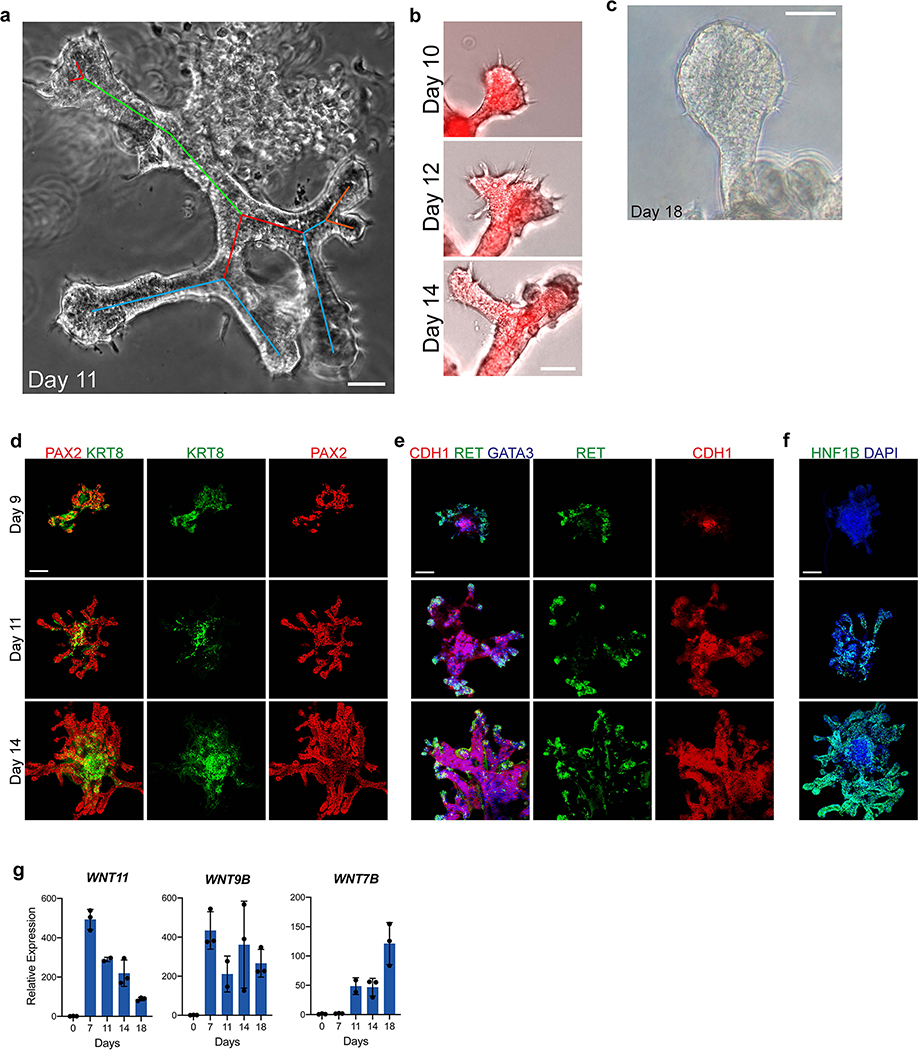
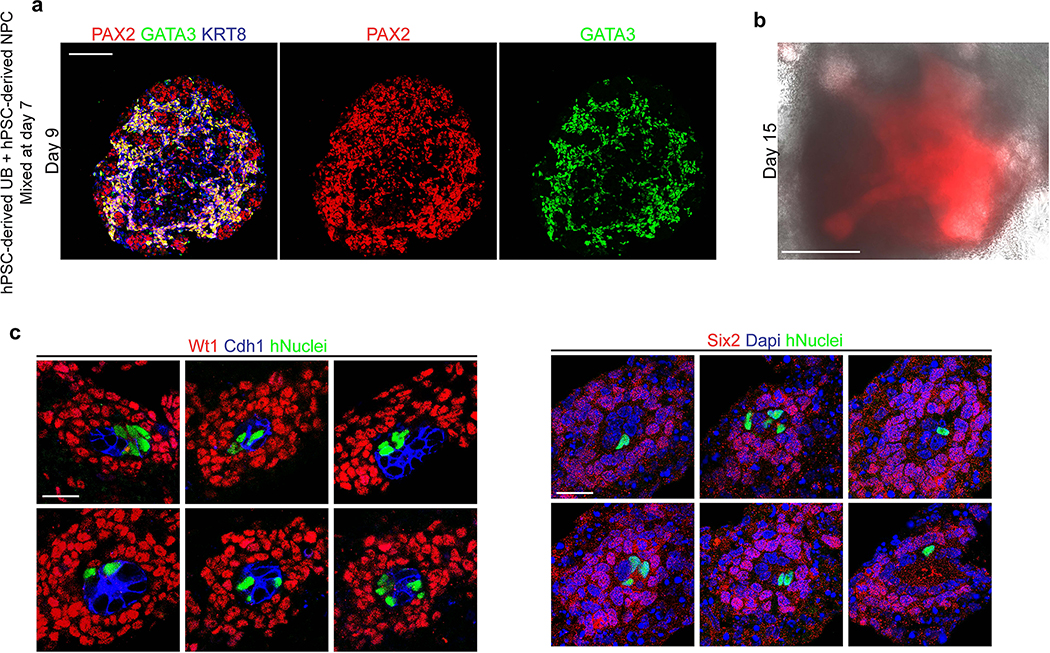
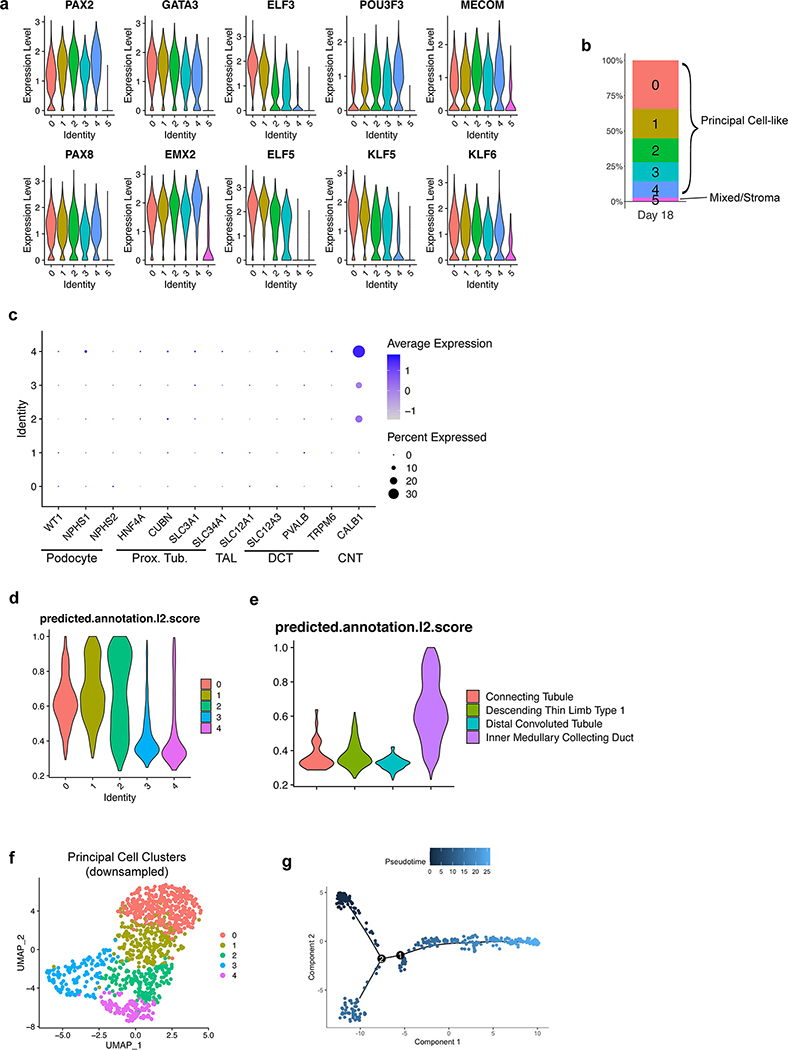
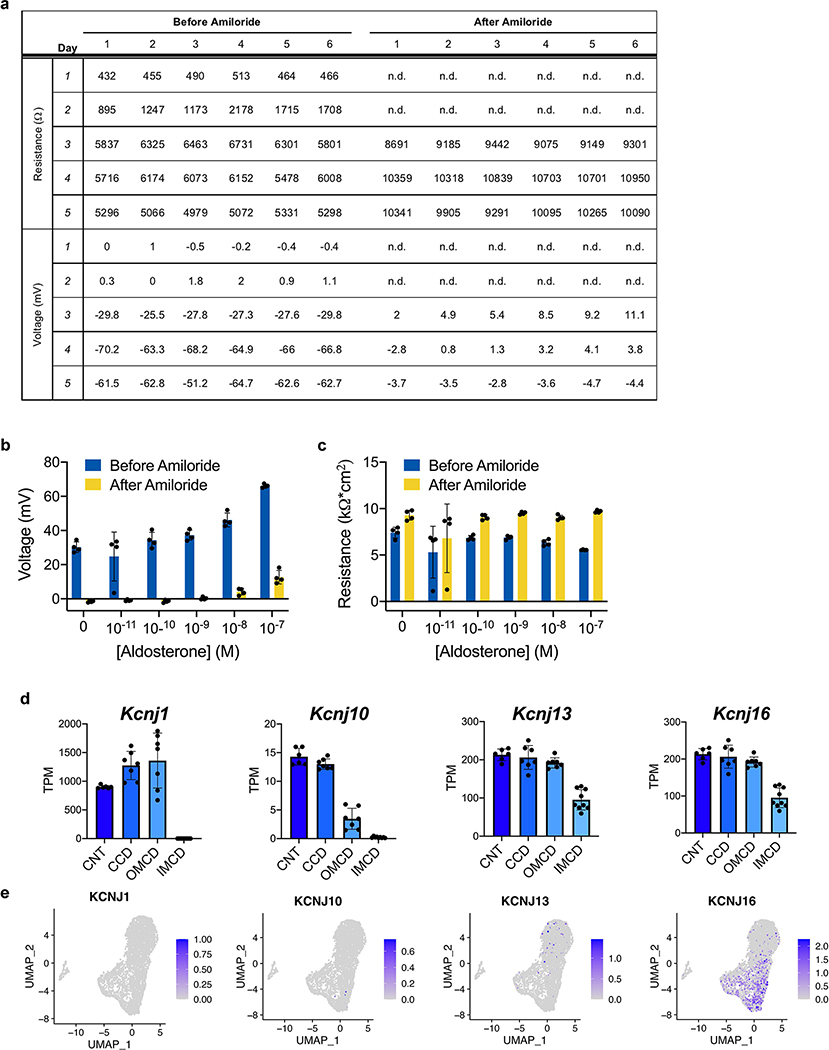
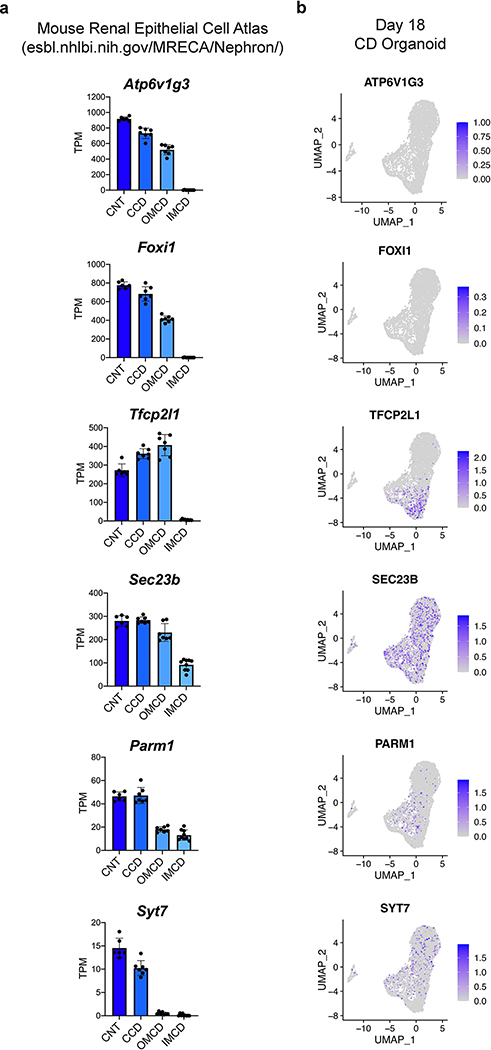
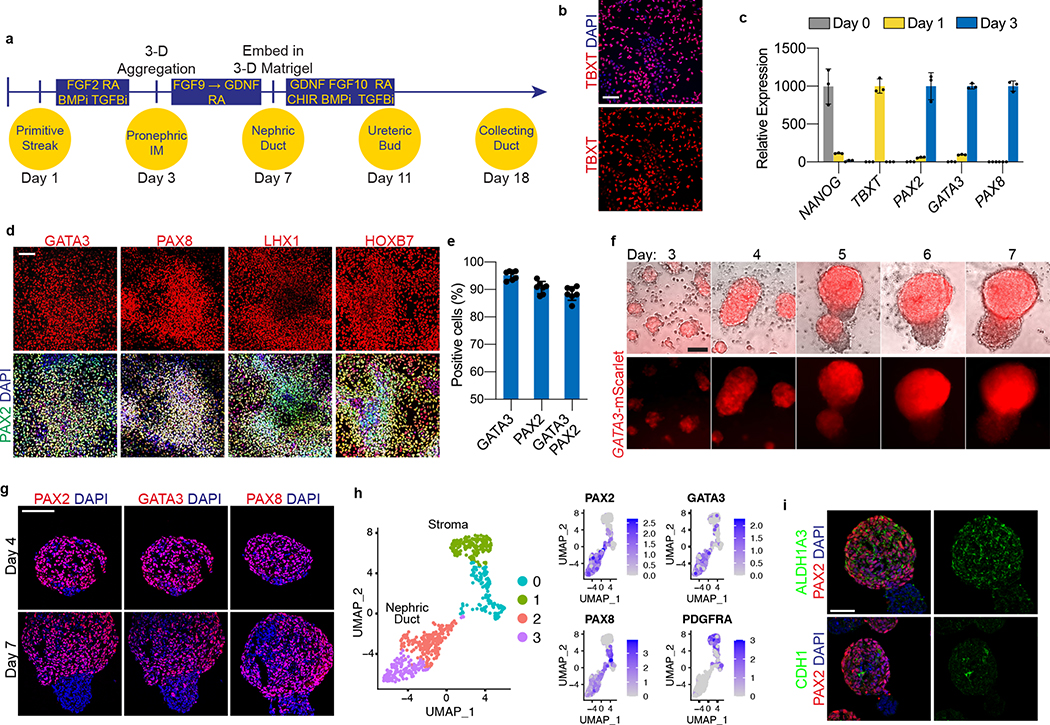
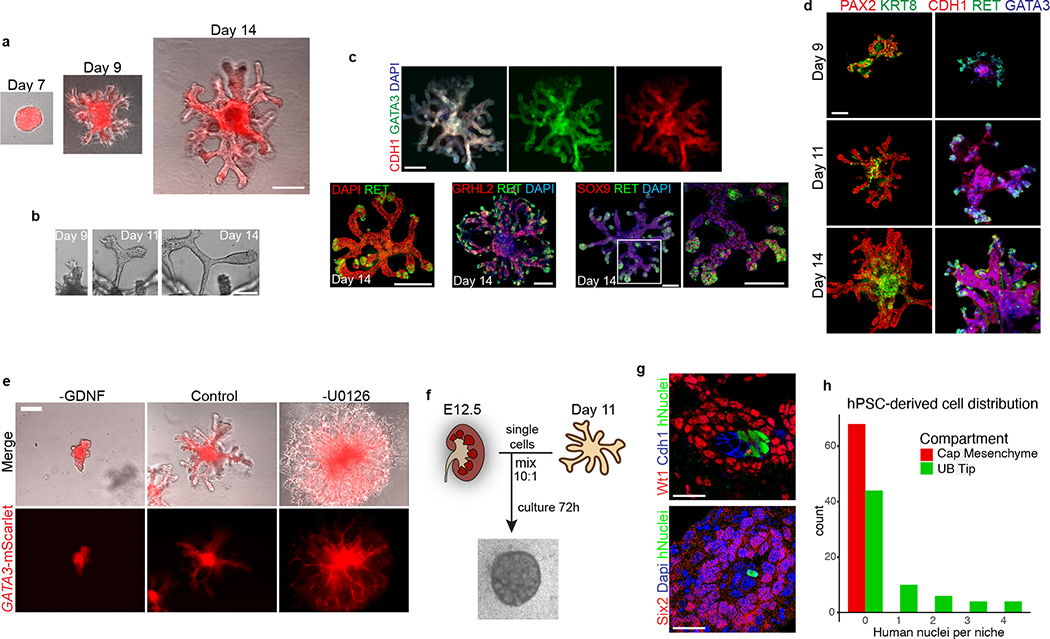
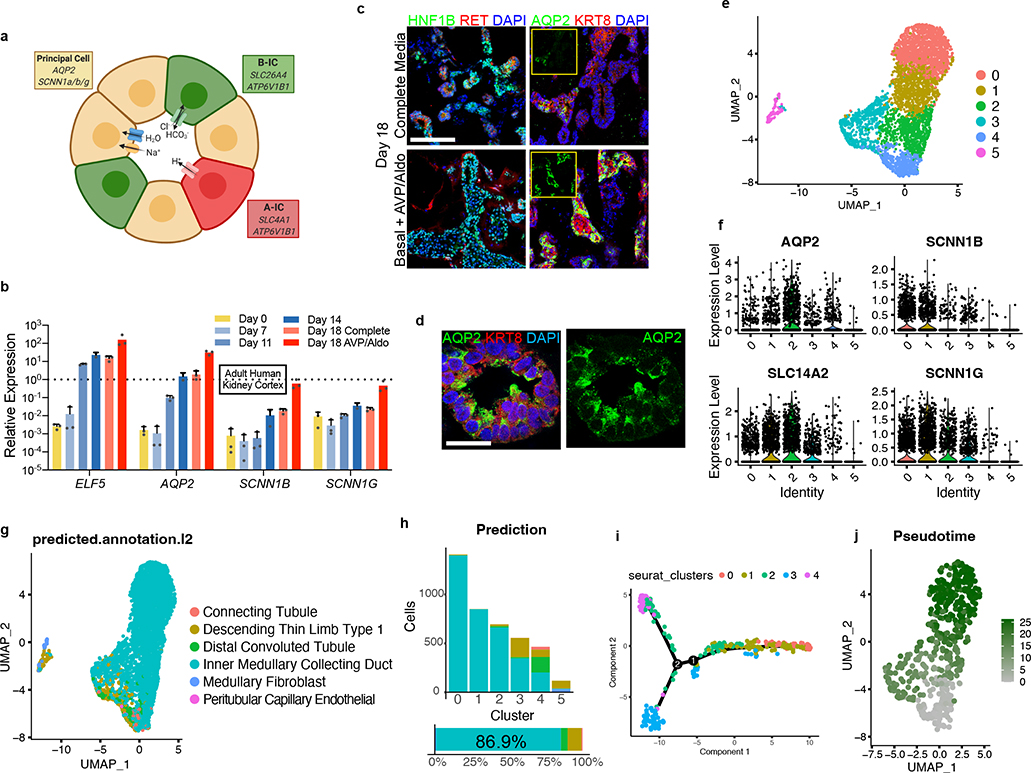
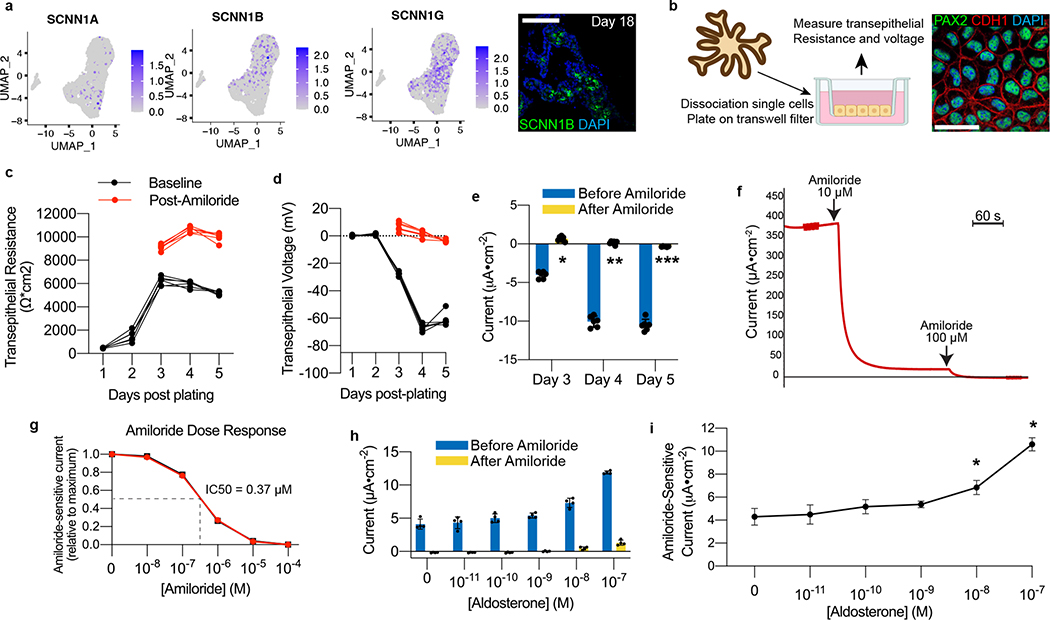
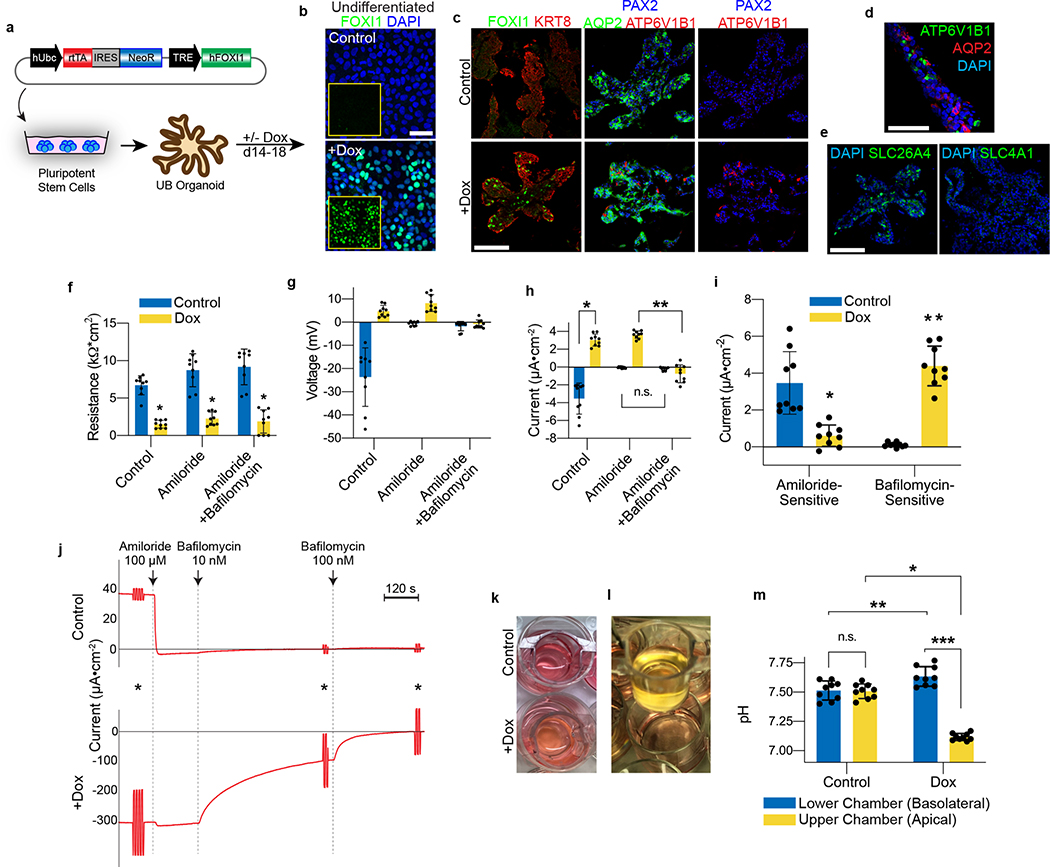
Directed differentiation of human pluripotent stem cells (hPSCs) into functional ureteric and collecting duct (CD) epithelia is essential to kidney regenerative medicine. Here we describe highly efficient, serum-free differentiation of hPSCs into ureteric bud (UB) organoids and functional CD cells. The hPSCs are first induced into pronephric progenitor cells at 90% efficiency and then aggregated into spheres with a molecular signature similar to the nephric duct. In a three-dimensional matrix, the spheres form UB organoids that exhibit branching morphogenesis similar to the fetal UB and correct distal tip localization of RET expression. Organoid-derived cells incorporate into the UB tips of the progenitor niche in chimeric fetal kidney explant culture. At later stages, the UB organoids differentiate into CD organoids, which contain >95% CD cell types as estimated by single-cell RNA sequencing. The CD epithelia demonstrate renal electrophysiologic functions, with ENaC-mediated vectorial sodium transport by principal cells and V-type ATPase proton pump activity by FOXI1-induced intercalated cells.


Conflict of interest statement

Competing financial interests

Dr. Bonventre is an inventor on kidney organoid patents assigned to Mass General Brigham (MGB), and is cofounder and holds equity in Goldfinch Bio. Dr. McCracken has kidney organoid patents pending. Dr. Bonventre’s interests were reviewed and are managed by BWH and MGB in accordance with their conflict-of-interest policies. The other authors have no competing financial interests to declare.

Figures

Extended Data Fig. 1
Extended Data Fig. 1. Generation of GATA3-mScarlet reporter allele.
Schematic representation depicting targeting scheme for CRISPR/Cas9-mediated knock-in of mScarlet into human GATA3 locus in H9 hESC line. The donor vector containing P2A-mScarlet and Hygro resistance cassette with flanking homology arms was co-transfected into cells with plasmid co-expressing Cas9 and gRNA targeting GATA3 stop codon.
Extended Data Fig. 2
Extended Data Fig. 2. Efficient induction of pronephric IM cells at day 3.
a, Brightfield micrographs demonstrating appearance of undifferentiated hESCs at day 0, as well cultures after 24 and 30 hours exposure to primitive streak-inducing factors. At 24 hours, there was still significant colony-like morphology consistent with incomplete induction of mesendoderm cells, but after six additional hours the colonies were nearly completely dissociated into single, mesenchymal-like cells. b, Quantification of IF staining for TBXT (as shown in Fig. 1b) revealed >95% efficiency after 30 hours exposure. n=6 quantified fields from three independent replicates. c, Timecourse qPCR analysis corresponding to Figure 1c. The primitive streak marker MIXL1 was maximally expressed at day 1 and was subsequently quickly down-regulated, while IM markers OSR1, HOXB7, HNF1B, and SOX9 were increased by day 3. n=3 independent biological replicates per timepoint. d, Efficient specification and expression of pronephric IM genes at day 3 was dependent on the combinatorial effects of FGF2, RA, TGFβ inhibition (A83-01), and BMP inhibition (LDN193189) during days 1–3. n=3 independent biological replicates per condition. e, In the pronephric IM cultures at days 3 and 7, there was low level of expression of posterior IM markers (WT1, SIX2, EYA1, and HOXA11), which were derived from a differentiation protocol for inducing metanephric progenitor cells. *, p<0.05; **p<0.005; two-tailed Student’s t-test individually comparing day 3 and day 7 against the day 9 posterior IM samples; n=4 biological replicates, data representative of 2 independent experiments. Specifically p-values for comparisons using day 3 were 0.005, 0.006, 0.0005, and 0.017 for WT1, SIX2, EYA1, and HOXA11, respectively; at day 7, they were 0.007, 0.007, 0.0002, and 0.015. f, From days 1–3, the TGFβ inhibitor A83-01 was required for suppression of definitive endoderm (SOX17) fate, whereas BMP inhibition with LDN193189 inhibited formation of lateral plate mesoderm (FOXF1). *p<0.005; two-tailed Student’s t-test; n=3 biological replicates, data representative of 2 independent experiments. Scale bar 200 μm (a). Column and error bars represent mean and standard deviation, respectively.
Extended Data Fig. 3
Extended Data Fig. 3. Characterization of nephric duct spheroids.
a, Pronephric IM cells aggregated at day 3 efficiently formed numerous compact spheroids that maintained high levels of GATA3 expression over the course of their development. b, When either FGF2 or FGF8 was used in place of FGF9 from days 3–5, the spheres were more loosely organized and exhibited lower expression of GATA3. c, Micrograph of a small region of nephric duct progenitors plated on a patterned microwell, demonstrating high degree of uniformity of size, shape, and structure of the spheroids. d, From days 4–7, the spheres maintained expression of early pronephric transcription factors LHX1 and HOXB7, and they also gradually acquired expression of nephric duct markers RET and EMX2. e, Over these several days of culture, qPCR analysis showed developmental increase in nephric duct genes RET, WNT11, WNT9B, and EMX2. n=3 independent biological replicates per timepoint. f, The leader cell marker ALDH1A3 was expressed in the ND clusters 2 and 3, while genes associated with more proximal ND (HOXB9 and TFAP2B) were less abundant. g-h, Heatmap and expression plots representing scRNA-seq data from day 7 revealed high expression of nephric duct markers in clusters 2 and 3, with complementary expression of stromal lineage genes in clusters 0 and 1 (in reference to UMAP in Fig. 1f). i, IF staining confirmed a high level of WT1-positivity in nephric duct lineage-negative cells at day 7. j, The differentiation of off-target lineages was not observed in the scRNA-seq dataset. Scale bars, 500 μm (a), 100 μm (b), 400 μm (c), 50 μm (d and h), 25 μm (i). Column and error bars represent mean and standard deviation, respectively.
Extended Data Fig. 4
Extended Data Fig. 4. UB organoid differentiation protocol is efficient when using hiPSCs.
a, Using the hiPSC line BJFF.6, a 30 hour exposure during the first stage of differentiation was also required for the primitive streak phenotype. b, AIM transcription factors PAX2, GATA3, LHX1, and HOXB7 were induced with very high efficiency by day 3. c, The hiPSC-derived AIM exhibited efficient formation of nephric duct spheroids in 96-well low attachment plates, which underwent similar molecular and morphological development compared to hESCs as shown in Figure 1. d, Nephric duct spheroids efficiently grew into branched UB organoids. e-f, hiPSC-derived UB organoids exhibited tip-stalk patterning and spontaneously formed differentiated AQP2-positive principal cells. Scale bars, 50 μm (a-d) and 100 μm (e-f).
Extended Data Fig. 5
Extended Data Fig. 5. Branching morphogenesis in UB organoids.
a, After embedding in 3-D matrix at day 7, the UB organoids exhibited several rounds of iterative branching during the first week of culture. The stereomicrograph of day 11 UB organoid demonstrates multiple terminal branching events, with each generation uniquely colored: 1=green, 2=red, 3=blue, 4=orange. b, A characteristic terminal bifurcation was demonstrated in the time course of micrographs. c, At later stages, such as day 18, branching was slowed and instead the distal UB tips formed enlarged knobs that more rarely underwent further cleavage events. d-e, Wholemount IF staining at days 9, 11, and 14 as shown in Fig. 2c with separation of channels. f, Expression of the transcription factor HNF1B increased between days 9–14. g, From day 7, the UB organoids showed a gradual decline in the tip marker WNT11 and a corresponding increase in the medullary stalk marker WNT7B. WNT9B, which is more broadly expressed in the stalk components, was maintained at relatively stable levels. n=3 independent biological replicates per timepoint. Scale bars, 50 μm (a-c) and 200 μm (d-f). Column and error bars represent mean and standard deviation, respectively.
Extended Data Fig. 6
Extended Data Fig. 6. UB progenitor cells participate in niche interactions in chimeric explants but not with hPSC-derived metanephric cells.
a, Cells from induced UB organoids and metanephric kidney organoids were dissociated at day 7, mixed and reaggregated, and cultured as spheres in suspension. Within two days (at day 9) the GATA3/KRT8-expressing UB cells had formed an epithelial network in the inner portion of the organoid. Metanephric cells (PAX2 only) were differentiating around the periphery of the structure in close association with the UB cells. However, we did not observe formation of capping mesenchyme structures or branching within the UB epithelium. b, Brightfield image with visualization of the UB epithelium using GATA3-mScarlet reporter confirmed the absence of significant branching morphogenesis. c, In chimeric explants with mouse fetal kidneys, the human induced UB cells (indicated by human nuclear antigen detection) incorporated into the UB tip (Cdh1-positive) at a high frequency, but never into the surrounding metanephric progenitors (Wt1 and Six2). Shown are six representative examples of progenitor niches that contained human cells. Scale bars, 200 μm (a and b) and 20 μm (c).
Extended Data Fig. 7
Extended Data Fig. 7. Characterization of CD organoids using scRNA-seq
a, UB and CD transcription factors were abundant in clusters 0–4, which contained >97% of the sequenced cells (b). c, Expression of markers associated with other differentiated nephron segments, including podocytes, proximal tubule, thick ascending limb of Henle’s loop (TAL), and distal convoluted tubule (DCT), was largely absent in the dataset. d, Mapping prediction scores from Azimuth analysis were notably higher in clusters 0–2, which contained the more differentiated principal cell populations, while the scores were fairly low in clusters 3 and 4. e, Similarly, the prediction scores for cells that mapped to alternative tubular fates (found almost exclusively in clusters 3 and 4) were generally much worse than those that mapped to collecting duct. f, UMAP of clusters 0–4 following random downsampling to 500 total cells that were used in Monocle trajectory analysis. g, The predicted lineage trajectory plotted by pseudotime, which corresponds to Fig. 3i.
Extended Data Fig. 8
Extended Data Fig. 8. Amiloride-sensitive sodium conductance in two-dimensional culture.
a, Data tables from voltmeter experiments using hESC-derived collecting duct cells. The transepithelial resistances and voltages were directly measured, from which short circuit currents were calculated and normalized to surface area of the transwell filter. b-c, Transepithelial voltage and resistance measurements in response to varying concentrations, including both pre- and post-amiloride treatment. Data shown (n=4 per dose) are representative of at least three independent experiments. d, Quantification of RNA-seq expression levels of potassium channels from microdissected mouse CD segments, including connecting tubule (CNT), cortical CD (CCD), outer medullary CD (OMCD) and inner medullary CD (IMCD). Kcnj1 and Kcnj10 were absent in the IMCD, while Kcnj13 and Kcnj16 were expressed in all CD regions. n=7 independent biological replicates per segment. e, In day 18 CD organoids, only KCNJ16 was expressed at high levels in the scRNA-seq dataset. Column and error bars represent mean and standard deviation, respectively.
Extended Data Fig. 9
Extended Data Fig. 9. CD organoids resemble the IMCD with respect to IC differentiation.
a, Region-specific expression from the mouse CD revealed absence of IC-related genes (Atp6v1g3, Foxi1, and Tfcp2l1) in the IMCD, and markers of transitional PC/ICs were either reduced (Sec23b, Parm1) or absent (Syt7) in the IMCD. n=3 independent biological replicates per timepoint. b, Expression in day 18 CD organoids was comparable to the IMCD, with absence of ATP6V1G3 and FOXI1 and low level of TFCP2L1. The transitional cell gene SEC23B was expressed throughout the principal clusters, but neither PARM1 nor SYT7 were abundant. Column and error bars represent mean and standard deviation, respectively.
Figure 1.
Figure 1.. Directed differentiation of hPSCs into pronephric IM and nephric duct spheres.
a, Schematized diagram of stepwise differentiation strategy for generation of ureteric bud and collecting duct organoids. b, Immunofluorescent (IF) staining of monolayer cultures at day 1 revealed efficient induction of TBXT-expressing mesendodermal progenitor cells. c, Gene expression analyses by qPCR revealed dynamic down- and up-regulation of pluripotency (NANOG) and primitive streak (TBXT) markers, respectively, after one day of induction. Following two subsequent days of exposure to IM-inducing factors, TBXT was repressed and there was robust activation of PAX2, PAX8, and GATA3. n=3 independent biological replicates per timepoint. d, IF staining of day 3 monolayer cultures demonstrated a high proportion of cells with co-expression of pronephric IM genes PAX2, PAX8, GATA3, LHX1, and HOXB7. e, Quantification of staining for GATA3 and PAX2 represented on histogram revealed a high efficiency of differentiation into pronephric IM fate. n=7 quantified fields from 3 independent biological replicates. f, Following aggregation of IM cells at day 3, the resulting structures underwent stereotypic morphogenetic events characterized in the timecourse of stereomicrographs and fluorescent imaging using GATA3-mScarlet reporter. By day 7, the GATA3+ cells arranged into a dense sphere that excluded a minority population of negative cells. g, IF staining of sections of nephric duct spheres at days 4 and 7 demonstrated maintenance of expression of PAX2, PAX8, and GATA3. h, UMAP representing scRNA-seq of cells isolated from spheres at day 7, which demonstrated the presence of both nephric duct (clusters 2 and 3) and stromal (clusters 0 and 1; PDGFRA+) lineages. i, The majority of cells at day 7 expressed the nephric duct leader fate marker ALDH1A3 with low levels of the mature epithelial marker CDH1. Scale bars 100 μm (b and d), 50 μm (f, g and i). Column and error bars represent mean and standard deviation, respectively.
Figure 2.
Figure 2.. Three-dimensional development of branching UB organoids.
a, Between days 7–14, the nephric duct spheres underwent extensive remodeling and growth into UB organoids, which grew in a pattern of elongating stalks and branching tips similar to the fetal UB. b, Bifurcative branching was frequently observed over this time period. c, Molecular analysis at day 14 reiterated a complex branched architecture and the entire epithelium exhibited expression of GATA3, GRHL2, SOX9, and CDH1. The progenitor marker and GDNF co-receptor RET was exclusively expressed in in the distal tip domains. d, Wholemount IF staining at days 9, 11, and 14 revealed uniform expression of PAX2 with progressive segregation of the tip (RET) and stalk (KRT8) domains. e, In the absence of exogenous GDNF, the nephric duct spheres largely failed to grow and branch. Conversely, removal of the MEK inhibitor U0126 from the culture medium led to a more disorganized branched plexus of fine epithelial cords with terminal filopodia rather than rounded UB-like tips. f, To functionally assess the competence of UB organoid cells, we mixed them with dissociated murine kidneys isolated at embryonic day (E) 12.5, pelleted the cells into chimeric aggregates, and cultured on filter disks for 72 hours. g, IF staining showed the incorporation of induced UB cells (indicated by a human-specific antibody) into the Cdh1-expressing UB tip domains but not in the Six2+Wt1+ nephron progenitor compartment. h, Histogram depicting the frequency at which we observed a human cell or cluster of cells in the examined progenitor niches. Scale bars, 200 μm (a and c-e), 100 μm (b) and 20 μm (g).
Figure 3.
Figure 3.. Differentiation of collecting duct epithelia from UB organoids.
a, Illustration demonstrating that the collecting duct epithelia comprise a mixture of principal cells, A-type, and B-type intercalated cells. b, Expression of markers ELF5, AQP2, SCNN1B, and SCNN1G increased over time, consistent with spontaneous formation and maturation of principal cells. When organoids were transitioned to a basal medium containing only AVP (10 nM) and Aldosterone (10 nM) from days 14–18, there was a marked increase in the expression of each of these genes. Dotted line represents expression observed in a sample of human kidney cortex. n=3 independent biological replicates per timepoint/condition. c, When the UB organoids were transitioned to the basal medium (with AVP/Aldo), the progenitor marker RET was downregulated in the epithelial tip domains, while AQP2 expression became more widespread and expressed at strikingly higher levels by IF. d, In numerous instances, AQP2 was localized in the epithelia nearer to the luminal or apical membrane, albeit it was not strictly apically localized. e, UMAP of scRNA-seq analysis of day 18 organoids that were cultured for four days in basal media with AVP/Aldo. f, Violin plots demonstrate expression of principal cell markers in clusters 0–4, which appear to be related given close association on UMAP, but not in cluster 5. g-h, Accordingly, integration and reference mapping to adult human kidney dataset predicted an ‘inner medullary collecting duct’ in 86.9% of cells in the dataset. While clusters 0–2 were nearly uniformly mapped to a collecting duct fate, clusters 3 and 4 contained a small proportion of cells that mapped to alternative tubular fates, namely the descending thin limb and distal convoluted tubule. i-j, Lineage trajectory analysis in Monocle predicted clusters 0 and 1 to be most differentiated cell types, while clusters 3 and 4 represented the earliest developmental stages in pseudotime. Scale bars, 100 μm (c) and 20 μm (d). Column and error bars represent mean and standard deviation, respectively.
Figure 4.
Figure 4.. hPSC-derived model for interrogating ENaC-mediated sodium transport.
a, Expression of the ENaC subunits SCNN1B and SCNN1G was abundant in scRNA-seq data, and we detected SCNN1B at the protein level in day 18 organoids. b, To explore functional capabilities, organoids at day 18 were dissociated and plated onto two-dimensional transwell filters for electrophysiological interrogation. This led to confluent epithelia that maintained expression of collecting duct markers PAX2 and CDH1. c-d, As the cells became confluent, there was at first a steep increase and then plateau in the transepithelial resistance, which was then followed by the emergence of a transepithelial voltage. The voltage was entirely suppressible within three minutes of addition of the ENaC antagonist amiloride (10 μM), which also raised the resistance across the epithelium. e, The resulting current generated was calculated using Ohm’s Law, and it was completely ablated immediately following addition of amiloride, confirming the conductance was ENaC-dependent. *p=5.3×10⁻⁹, **p=5.7×10⁻⁸, ***p=4.5×10⁻⁶; two-tailed student’s t-test comparing results before and after amiloride; n=6 biological replicates, data representative of 3 independent experiments. f, Under closed-circuit conditions with voltage clamping in Ussing chamber, the current produced by the epithelium was similarly sensitive to amiloride, and it was completely abolished upon increasing the concentration to 100 μM. g, Amiloride induced a dose-dependent inhibition of transepithelial current in Ussing chamber, with representative dose-response curves shown from two independent wells. h-i, Addition of aldosterone for 24 hours led to a dose-dependent increase in transepithelial current measured under closed circuit conditions, and up to a maximum of approximately 2.5-fold increase in amiloride-sensitive current. *p<0.005; two-tailed student’s t-test compared to no aldosterone; n=4 independent biological replicates. Scale bars, 100 μm (a) and 20 μm (b). Column and error bars represent mean and standard deviation, respectively.
Figure 5.
Figure 5.. FOXI1 expression is sufficient for intercalated cell fate determination.
a, hESCs were transduced with lentivirus encoding a doxycycline (dox)-inducible hFOXI1 construct, and the cells were differentiated into UB organoids. b, In the undifferentiated state, FOXI1 expression was not observed in the absence of dox, but it was widely induced after exposure to dox for 48 hours. c, While control organoids exhibited no expression of FOXI1 or IC markers, the short exposure to dox induced formation of FOXI1- and ATP6V1B1-expressing ICs in a salt-and-pepper distribution. AQP2 expression was maintained in some cells but was mutually exclusive with the induced ICs. d, In the dox-induced organoids at day 18, the epithelium comprised an assortment of AQP2-expressing principal cells and ATP6V1B1-positive ICs. e, In the dox-induced organoids, only B-ICs were observed that expressed SLC26A4, while there were no SLC4A1-expressing A-ICs. f, In the 2D cell culture model, doxycycline-treated cells exhibited significant reduction in transepithelial resistance. *p<0.0005; two-tailed student’s t-test. g-h, While control cells had a negative transepithelial voltage and current that was suppressed by amiloride, the doxycycline-treated cells had a positive baseline potential and current that was augmented by amiloride but completely suppressed by the V-ATPase inhibitor bafilomycin (10 nM). *p=2×10⁻⁶, **p=1.3×10⁻⁷, two-tailed student’s t-test (h). i, Therefore control cells displayed amiloride-sensitive current while doxycycline induced a predominantly bafilomycin-sensitive current. *p=2.5×10⁻⁴, **p=1.0×10⁻⁶, two-tailed student’s t-test. In f-i, n=9 independent biological replicates per condition over two separate experiments. j, Experiments in Ussing chamber confirmed that FOXI1 expression resulted in bafilomycin-sensitive rather than amiloride-sensitive short-circuit current. Shown are representative tracings from two independent experiments. Asterisks indicate 1V pulses to assess transepithelial resistance. k, Doxycycline-treated cells induced acidification of the cell culture medium, which (l) was only observed in the apical chamber of the transwells. m, Measured using a pH meter, the FOXI1-induced cells generated a pH gradient of ~0.5 units between the upper and lower chambers of the transwell. N=9 independent biological replicates per condition. *p=1.6×10⁻⁹, **p=0.007, ***p=7.8×10⁻⁹, two-tailed student’s t-test. The data shown in k-m have been observed in more than 8 independent experiments. Scale bars, 50 μm (b-c) and 100 μm (d-e). Column and error bars represent mean and standard deviation, respectively.

Comment in

References

    1. Kim J, Koo BK & Knoblich JA Human organoids: model systems for human biology and medicine. Nat Rev Mol Cell Biol 21, 571–584 (2020). - PMC - PubMed
    1. Lehmann R et al. Human organoids: a new dimension in cell biology. Mol Biol Cell 30, 1129–1137 (2019). - PMC - PubMed
    1. McMahon AP Development of the Mammalian Kidney. Curr Top Dev Biol 117, 31–64 (2016). - PMC - PubMed
    1. Takasato M et al. Kidney organoids from human iPS cells contain multiple lineages and model human nephrogenesis. Nature 526, 564–568 (2015). - PubMed
    1. Morizane R et al. Nephron organoids derived from human pluripotent stem cells model kidney development and injury. Nat Biotechnol 33, 1193–1200 (2015). - PMC - PubMed

Publication types

Substances