. 2022 Nov;47(11):3746-3757.
doi: 10.1007/s00261-022-03647-6. Epub 2022 Aug 29.

Assessment of hepatic fibrosis and inflammation with look-locker T1 mapping and magnetic resonance elastography with histopathology as reference standard

Affiliations

Assessment of hepatic fibrosis and inflammation with look-locker T1 mapping and magnetic resonance elastography with histopathology as reference standard

Sophie von Ulmenstein et al. Abdom Radiol (NY). 2022 Nov.

Abstract

Purpose: To compare the diagnostic performance of T1 mapping and MR elastography (MRE) for staging of hepatic fibrosis and grading inflammation with histopathology as standard of reference.

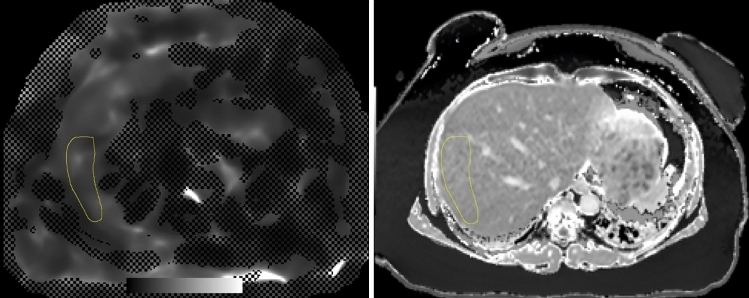
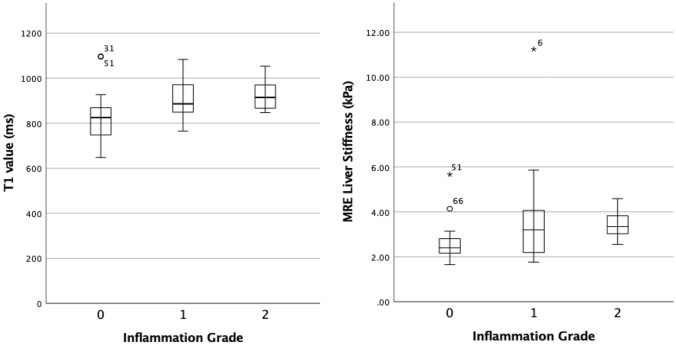
Methods: 68 patients with various liver diseases undergoing liver biopsy for suspected fibrosis or with an established diagnosis of cirrhosis prospectively underwent look-locker inversion recovery T1 mapping and MRE. T1 relaxation time and liver stiffness (LS) were measured by two readers. Hepatic fibrosis and inflammation were histopathologically staged according to a standardized fibrosis (F0-F4) and inflammation (A0-A2) score. For statistical analysis, independent t test, and Mann-Whitney U test and ROC analysis were performed, the latter to determine the performance of T1 mapping and MRE for fibrosis staging and inflammation grading, as compared to histopathology.

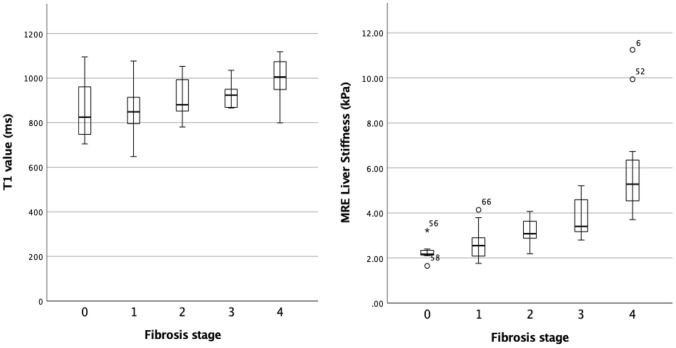
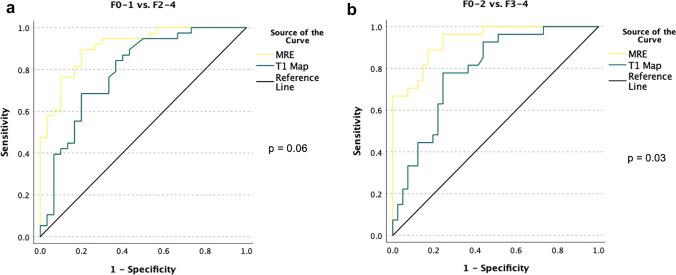
Results: Histopathological analysis diagnosed 9 patients with F0 (13.2%), 21 with F1 (30.9%), 11 with F2 (16.2%), 10 with F3 (14.7%), and 17 with F4 (25.0%). Both T1 mapping and MRE showed significantly higher values for patients with significant fibrosis (F0-1 vs. F2-4; T1 mapping p < 0.0001, MRE p < 0.0001) as well as for patients with severe fibrosis or cirrhosis (F0-2 vs. F3-4; T1 mapping p < 0.0001, MRE p < 0.0001). T1 values and MRE LS were significantly higher in patients with inflammation (A0 vs. A1-2, both p = 0.01). T1 mapping showed a tendency toward lower diagnostic performance without statistical significance for significant fibrosis (F2-4) (AUC 0.79 vs. 0.91, p = 0.06) and with a significant difference compared to MRE for severe fibrosis (F3-4) (AUC 0.79 vs. 0.94, p = 0.03). For both T1 mapping and MRE, diagnostic performance for diagnosing hepatic inflammation (A1-2) was low (AUC 0.72 vs. 0.71, respectively).

Conclusion: T1 mapping is able to diagnose hepatic fibrosis, however, with a tendency toward lower diagnostic performance compared to MRE and thus may be used as an alternative to MRE for diagnosing hepatic fibrosis, whenever MRE is not available or likely to fail due to intrinsic factors of the patient. Both T1 mapping and MRE are probably not sufficient as standalone methods to diagnose hepatic inflammation with relatively low diagnostic accuracy.

Keywords: Biopsy; Fibrosis; Liver; MR elastography; T1 mapping.


Conflict of interest statement

Dr Segna reports traveling fees from AbbVie, Vifor, and Gilead and a research grant from the Novartis Foundation for Medical-Biological Research unrelated to this project. All other authors declare no conflict of interest regarding the publication of this article.

Figures

Fig. 1
Fig. 1
Example of the identical size and positioning of the ROI on the T1 map and MRE confidence map performed with ImageJ
Fig. 2
Fig. 2
Flowchart of patient inclusion
Fig. 3
Fig. 3
Simple Boxplot of the mean T1 values and mean MRE LS values by Fibrosis stages
Fig. 4
Fig. 4
51-year-old man with low-stage fibrosis (F1) caused by an unknown liver disease. The T1 Map (left) showed a mean T1 relaxation time of 671 ms and MRE (middle) showed a mean liver stiffness value of 2.10 kPa. Correlating histology image with Sirius red staining at 300 × magnification (right)
Fig. 5
Fig. 5
65-year-old male with cirrhosis (F4) caused by ALD. The T1 map (left) showed a mean T1 relaxation time of 1098 ms and MRE (middle) a mean stiffness value of 5.91 kPa. Correlating histology image with Sirius red staining at 300 × magnification (right)
Fig. 6
Fig. 6
Simple Boxplot of the mean T1 values and mean MRE LS values by Inflammation grade
Fig. 7
Fig. 7
a ROC of the diagnostic performance of MRE (yellow line) and T1 map (green line) for fibrosis stages. The AUC showed similar results in distinguishing no or low fibrosis stages (F0-1) from significant fibrosis stages (F2-4): AUC value T1 map 0.79 vs. AUC value MRE 0.91 (p = 0.06). b ROC of the diagnostic performance of MRE (yellow line) and T1 map (green line) for fibrosis stages. The AUC showed significantly lower detection of severe fibrosis (F3-4) for T1 mapping: AUC value T1 map 0.79 vs. AUC value MRE 0.94 (p = 0.03)
Fig. 8
Fig. 8
a ROC of the diagnostic performance of MRE (yellow line) and T1 map (green line) for inflammation activity grading. The AUC showed a low, non-significant performance in the detection of moderate inflammation (A2) for both MRE (AUC 0.67, p = 0.10) and T1 map (AUC 0.65, p = 0.13). b ROC of the diagnostic performance of MRE (yellow line) and T1 map (green line) for inflammation activity grading. The AUC showed a low, but significant performance in the detection of low to moderate inflammation (A1-2) for both MRE (AUC 0.71, p = 0.01) and T1 map (AUC 0.72, p = 0.01)

References

    1. Ioannou GN, Splan MF, Weiss NS, McDonald GB, Beretta L, Lee SP. Incidence and predictors of hepatocellular carcinoma in patients with cirrhosis. Clin Gastroenterol Hepatol Off Clin Pract J Am Gastroenterol Assoc. 2007;5(938–945):945.e1–4. doi: 10.1016/j.cgh.2007.02.039. - DOI - PubMed
    1. Sangiovanni A, Prati GM, Fasani P, Ronchi G, Romeo R, Manini M, Del Ninno E, Morabito A, Colombo M. The natural history of compensated cirrhosis due to hepatitis C virus: A 17-year cohort study of 214 patients. Hepatol Baltim Md. 2006;43:1303–1310. doi: 10.1002/hep.21176. - DOI - PubMed
    1. Ratziu V, Charlotte F, Heurtier A, Gombert S, Giral P, Bruckert E, Grimaldi A, Capron F, Poynard T, LIDO Study Group Sampling variability of liver biopsy in nonalcoholic fatty liver disease. Gastroenterology. 2005;128:1898–1906. doi: 10.1053/j.gastro.2005.03.084. - DOI - PubMed
    1. Merriman RB, Ferrell LD, Patti MG, Weston SR, Pabst MS, Aouizerat BE, Bass NM. Correlation of paired liver biopsies in morbidly obese patients with suspected nonalcoholic fatty liver disease. Hepatol Baltim Md. 2006;44:874–880. doi: 10.1002/hep.21346. - DOI - PubMed
    1. Choi YR, Lee JM, Yoon JH, Han JK, Choi BI. Comparison of magnetic resonance elastography and gadoxetate disodium-enhanced magnetic resonance imaging for the evaluation of hepatic fibrosis. Invest Radiol. 2013;48:607–613. doi: 10.1097/RLI.0b013e318289ff8f. - DOI - PubMed

Publication types