. 2022 Dec;6(12):1625-1633.
doi: 10.1038/s41562-022-01425-4. Epub 2022 Aug 29.

Socioeconomic roots of academic faculty

Affiliations

Socioeconomic roots of academic faculty

Allison C Morgan et al. Nat Hum Behav. 2022 Dec.

Abstract

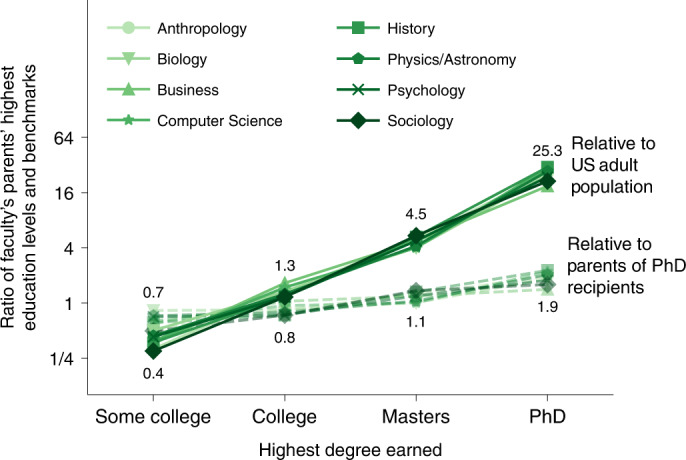
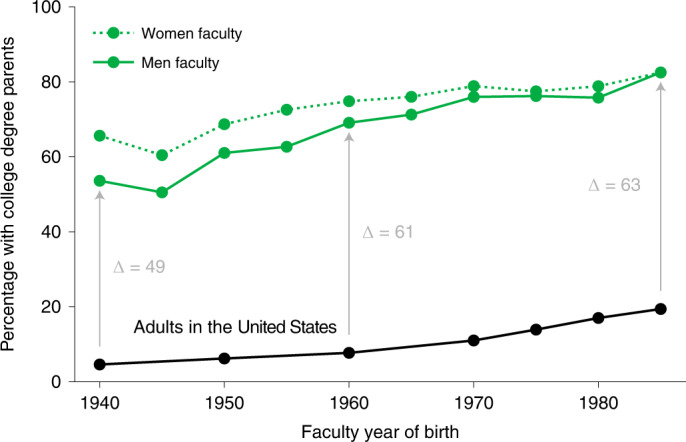
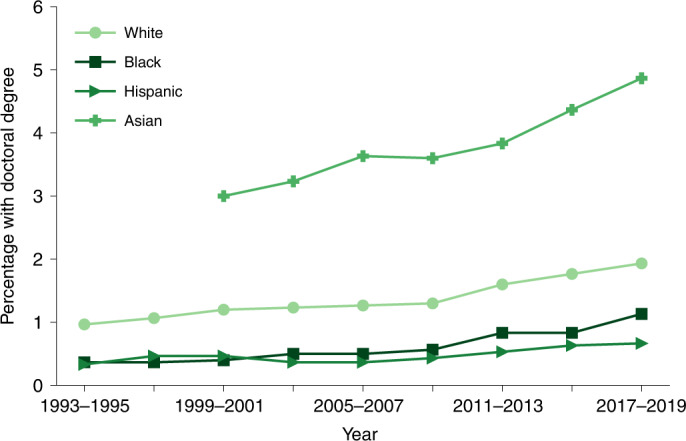
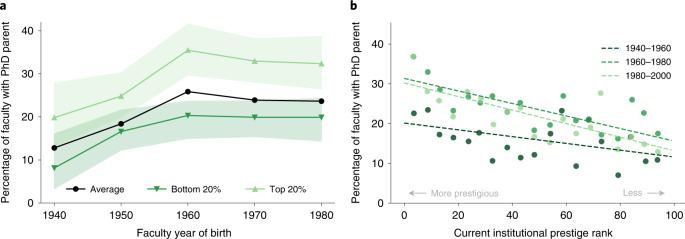
Despite the special role of tenure-track faculty in society, training future researchers and producing scholarship that drives scientific and technological innovation, the sociodemographic characteristics of the professoriate have never been representative of the general population. Here we systematically investigate the indicators of faculty childhood socioeconomic status and consider how they may limit efforts to diversify the professoriate. Combining national-level data on education, income and university rankings with a 2017-2020 survey of 7,204 US-based tenure-track faculty across eight disciplines in STEM, social science and the humanities, we show that faculty are up to 25 times more likely to have a parent with a Ph.D. Moreover, this rate nearly doubles at prestigious universities and is stable across the past 50 years. Our results suggest that the professoriate is, and has remained, accessible disproportionately to the socioeconomically privileged, which is likely to deeply shape their scholarship and their reproduction.


Conflict of interest statement

The authors declare no competing interests.

Figures

Fig. 1
Fig. 1. Ratios of faculty parents’ education to broader populations.
Percentages of faculty members by their parents’ educational attainment levels (n = 7,204) divided by either percentages of the US adult population in those educational attainment levels (solid) or percentages of Ph.D. recipients with parents’ in those educational attainment levels (dashed),. Disciplines denoted by symbols.
Fig. 2
Fig. 2. Percentages of faculty with college-educated parents by gender and across time.
Percentages of faculty reporting their parents’ highest level of education was at least a college degree by faculty year of birth (green), compared with the fraction of US adults earning a college degree or higher in a given year (black). Grey arrows show the difference between men faculty and US adult trends.
Fig. 3
Fig. 3. Parental support by education level.
Amount of support parents provided for academic careers on a scale of 1 (None at all) to 5 (A lot), stratified by faculty members’ parents’ highest education levels.
Fig. 4
Fig. 4. Parental income distribution.
Average income distribution estimated using faculty members’ childhood zip codes (green), compared with the income distribution across the 1998 US population (black).
Fig. 5
Fig. 5. Ph.D. attainment by racial or ethnic group.
Percentages of white, Black, Hispanic and Asian adults (at least 25 years old) in the US population who hold doctorate degrees. Trends are smoothed with averages every three years.
Fig. 6
Fig. 6. Trends in the percentage of faculty with a Ph.D. parent.
a, Percentage of faculty with at least one parent holding a Ph.D., stratified by prestige of the faculty’s current institution. Green upward triangles describe faculty at the top 20% of institutions by USNWR or NRC ranking, and downward triangles the bottom 20% of ranked institutions. Shaded regions denote empirical 95% confidence intervals. The black line describes the average proportion of faculty with Ph.D. parents. b, Current institutional ranking of professors surveyed and the percentage of surveyed faculty at that institution who have a parent with a Ph.D. Dots indicate empirical estimates for 1,360 universities of more to less prestige; lines show a stable negative relationship between increasing institutional ranking and having a Ph.D. parent for faculty born in 1940–1960 (dark green), 1960–1980 (medium green) and 1980–2000 (light green).

References

    1. Riegle-Crumb C, King B, Irizarry Y. Does STEM stand out? Examining racial/ethnic gaps in persistence across postsecondary fields. Educ. Res. 2019;48:133–144. doi: 10.3102/0013189X19831006. - DOI - PMC - PubMed
    1. McLeod PL, Lobel SA, Cox Jr TH. Ethnic diversity and creativity in small groups. Small Group Res. 1996;27:248–264. doi: 10.1177/1046496496272003. - DOI
    1. Milem, J. F. in Compelling Interest: Examining the Evidence on Racial Dynamics in Higher Education (eds Chang, M. J., et al.) 126–169 (Stanford Univ. Press, 2003).
    1. Blau, P. M. & Duncan, O. D. The American Occupational Structure (John Wiley & Sons, Inc., 1967).
    1. Hout, M. & Janus, A. in Whither Opportunity? Rising Inequality, Schools, and Children’s Life Chances (eds Duncan, G. J. & Murnane, R. J.) 165–186 (Russell Sage Foundation, 2011).

Publication types