. 2022 Oct;3(10):1151-1164.
doi: 10.1038/s43018-022-00416-8. Epub 2022 Aug 29.

Multimodal integration of radiology, pathology and genomics for prediction of response to PD-(L)1 blockade in patients with non-small cell lung cancer

Collaborators, Affiliations

Multimodal integration of radiology, pathology and genomics for prediction of response to PD-(L)1 blockade in patients with non-small cell lung cancer

Rami S Vanguri et al. Nat Cancer. 2022 Oct.

Abstract

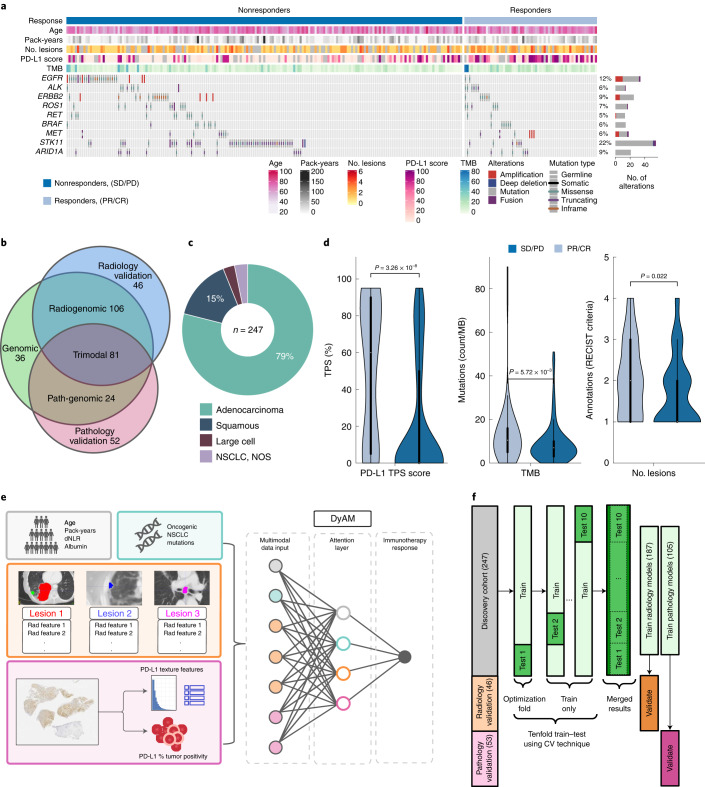
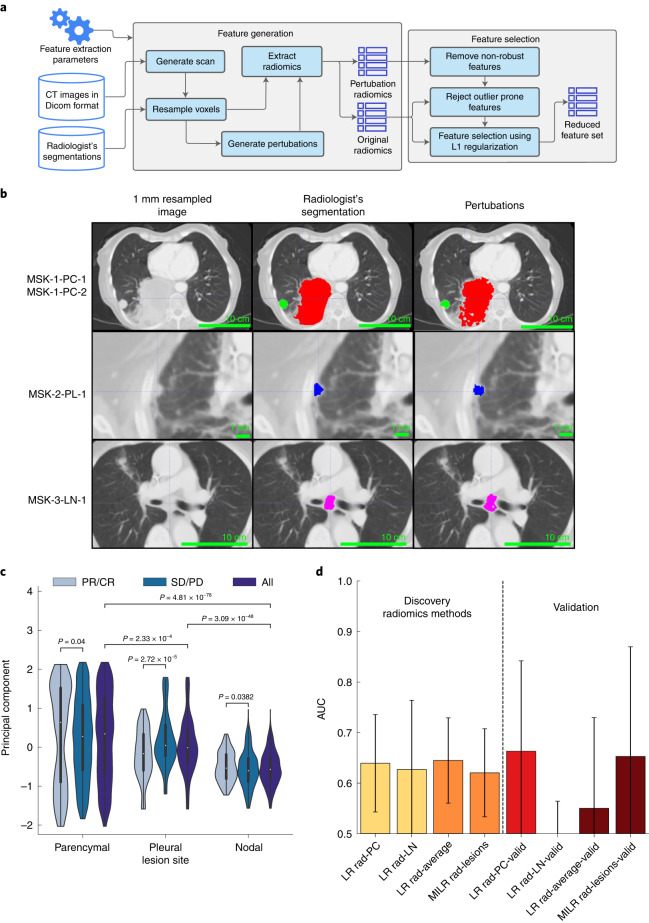
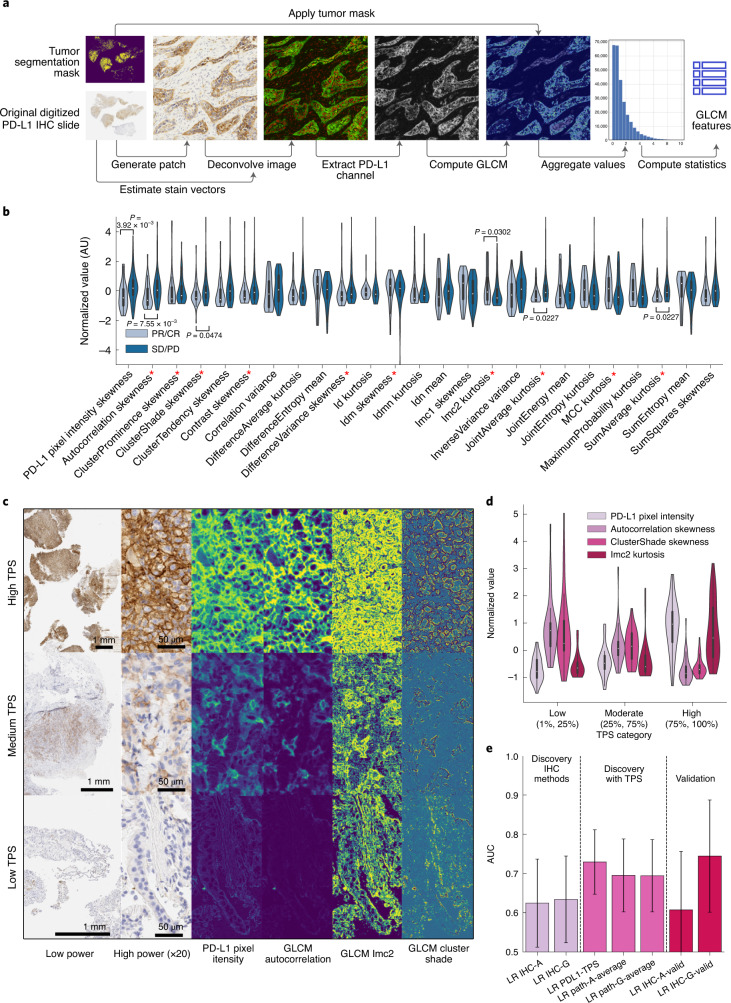
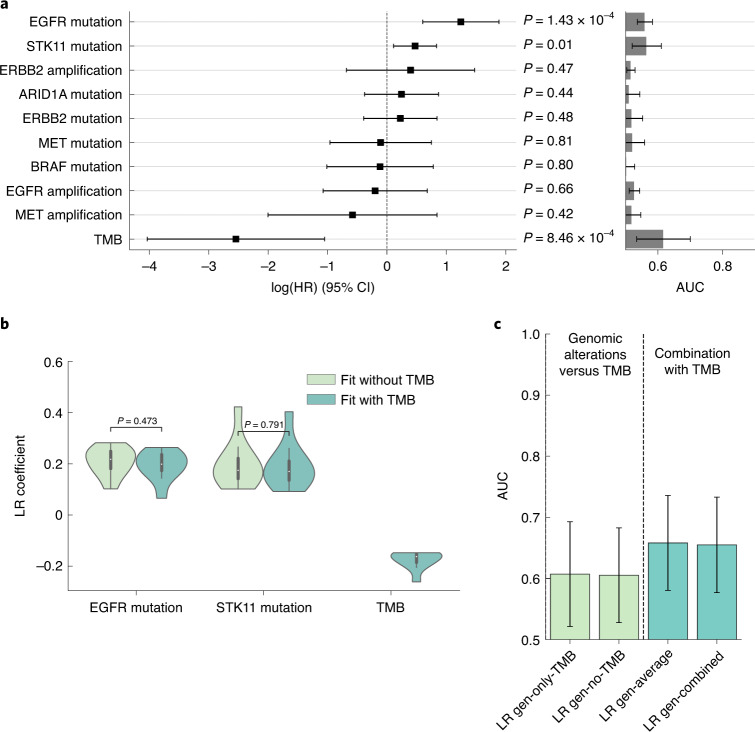
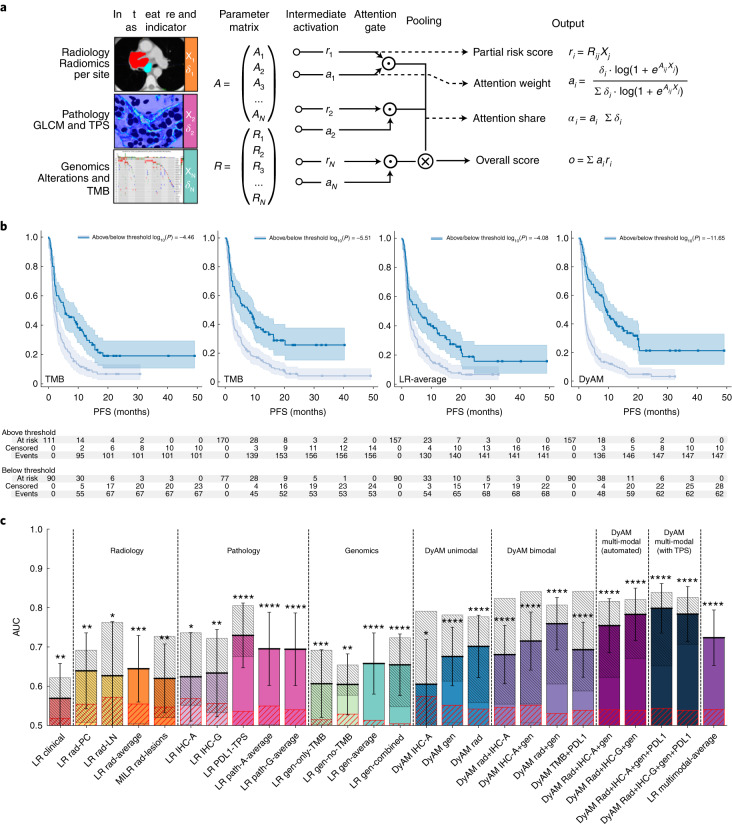
Immunotherapy is used to treat almost all patients with advanced non-small cell lung cancer (NSCLC); however, identifying robust predictive biomarkers remains challenging. Here we show the predictive capacity of integrating medical imaging, histopathologic and genomic features to predict immunotherapy response using a cohort of 247 patients with advanced NSCLC with multimodal baseline data obtained during diagnostic clinical workup, including computed tomography scan images, digitized programmed death ligand-1 immunohistochemistry slides and known outcomes to immunotherapy. Using domain expert annotations, we developed a computational workflow to extract patient-level features and used a machine-learning approach to integrate multimodal features into a risk prediction model. Our multimodal model (area under the curve (AUC) = 0.80, 95% confidence interval (CI) 0.74-0.86) outperformed unimodal measures, including tumor mutational burden (AUC = 0.61, 95% CI 0.52-0.70) and programmed death ligand-1 immunohistochemistry score (AUC = 0.73, 95% CI 0.65-0.81). Our study therefore provides a quantitative rationale for using multimodal features to improve prediction of immunotherapy response in patients with NSCLC using expert-guided machine learning.


Conflict of interest statement

J.L. has received honoraria from Targeted Oncology and Physicians’ Education Resource. M.D.H. as of November 2021, is an employee of AstraZeneca; has grants from BMS; and personal fees from Achilles; Adagene; Adicet; Arcus; AstraZeneca; Blueprint; BMS; DaVolterra; Eli Lilly; Genentech/Roche; Genzyme/Sanofi; Janssen; Immunai; Instil Bio; Mana Therapeutics; Merck; Mirati; Natera; Pact Pharma; Shattuck Labs; and Regeneron; as well as equity options from Factorial, Immunai, Shattuck Labs and Arcus. A patent filed by MSK related to the use of TMB to predict response to immunotherapy (PCT/US2015/062208) is pending and licensed by PGDx. T.J.H. receives funding from Bristol Myers Squibb and Calico labs. M.S.G. is a consultant for Ultimate Opinions in Medicine. J.L.S. reports stock ownership in Pfizer, Thermo Fisher Scientific, Merck & Co. and Chemed Corp. S.P.S. is a shareholder and consultant for Imagia Canexia Health. The remaining authors declare no competing interests.

Figures

Fig. 1
Fig. 1. Multimodal cohort characteristics and schema outlining the project.
a, Multimodal cohort heat map listing clinical, pathological, radiomic and genomic characteristics for n = 247 patients. The stacked bar plot shows the number of patients with a genomic alteration, where the colors correspond to alteration types. b, Cohort modality overview Venn diagram, with the number of patients exclusively in each category. c, Lung cancer histology breakdown. d, Distribution of PD-L1 TPS (n = 201 patients), TMB (n = 247 patients) and number of annotated lesions (n = 187 patients) between responders (PR/CR) and nonresponders (SD/PD). The interior box-and-whisker bars show the mean as a white dot, the IQR (25–75%) as a black bar and the minimum and maximum as whiskers up to 1.5 × IQR. P values were obtained from a two-sided Mann–Whitney–Wilcoxon test. e, Analysis overview using DyAM to integrate multiple modalities to predict immunotherapy response. f, Train–test–validate, breakdown and optimization scheme. CV, cross-validation. Source data
Fig. 2
Fig. 2. Extraction of CT radiomics features and association with response.
a, Radiomics feature extraction pipeline using expert segmented thoracic CT scans. Superpixel-based perturbations on original segmentations used for feature selection. b, Three expert CT segmentation examples including lung parenchymal (PC) (top), pleural (PL) (middle) and lymph node (LN) lesions (bottom) representative of n = 187 patients, with the original image, segmentation and randomized contour example. c, Principal-component decomposition distribution of radiomics features for superpixel-based perturbations across tissue sites. The interior box-and-whisker bars show the mean as a white dot, the IQR (25–75%) as a black bar and the minimum and maximum as whiskers up to 1.5 × IQR. P values were obtained from the two-sided Mann–Whitney–Wilcoxon test for n = 2,040 PC perturbations with n = 540 in the responding group and n = 1,500 in the nonresponding group; n = 330 PL perturbations with n = 130 in the responding group and n = 200 in the nonresponding group; and n = 960 LN perturbations with n = 360 in the responding group and n = 600 in the nonresponding group. d, Response prediction performance using LR classifiers for each type of lesion as well as averaging-based patient-level prediction aggregation by averaging (LR Rad-Average) outcomes across all lesions and the multiple-instance learning model. Results with AUC < 0.5 are not shown. The bar height and error bar represent the AUC and associated 95% CI based on DeLong’s method for n = 187 and n = 46 patients in the multimodal and validation cohorts, respectively. Source data
Fig. 3
Fig. 3. PD-L1 immunohistochemistry feature derivation and prediction of response.
a, Analysis pipeline to extract image-based IHC texture starting from scanned PD-L1 IHC slides. b, Normalized-value distributions of GLCM and pixel intensity-derived image features stratified by response for the best performing summary statistic in each GLCM class. Features indicated by the red asterisk emerged as salient features in the LR fit with n = 42 responders and n = 63 nonresponders. c, Three representative PD-L1 IHC slides from n = 105 samples corresponding to the maximum (top), median (middle) and minimum (bottom) of the GLCM autocorrelation distribution, with low power, high power, stain intensity and pixel-wise GLCM sample patches. d, Correspondence of the example GLCM features in c between low, medium and high bins of TPS. The interior box-and-whisker bars show the mean as a white dot, the IQR (25–75%) as a black bar and the minimum and maximum as whiskers up to 1.5 × IQR for n = 105 samples. e, Response prediction performance using LR classifiers with PD-L1 features including TPS (LR PD-L1-TPS), pixel and GLCM autocorrelation image features (LR IHC-A), only the complete GLCM features (LR IHC-G) and the result of aggregating patient-level predictions by averaging classifier outcomes from LR IHC-A, IHC-G and LR PD-L1-TPS (LR Path-Average). The bar height and error bar represent the merged AUC and associated 95% CI based on DeLong’s method for n = 105 and n = 52 patients in the multimodal and validation cohorts, respectively. Source data
Fig. 4
Fig. 4. Modeling of response from genomic alterations and TMB.
a, aHRs using Cox proportional hazard model analysis of genomic variables alongside single feature AUCs. P values were obtained from the likelihood-ratio test for n = 247 patients. b, Comparison of EGFR and STK11 feature coefficients with and without the inclusion of TMB in the model for n = 10 fits. The interior box-and-whisker bars show the mean as a white dot, the IQR (25–75%) as a black bar and the minimum and maximum as whiskers up to 1.5 × IQR. c, AUCs resulting from models using only TMB, genomic alterations (without TMB), averaging predictions from the TMB and alterations models and fitting a model with both TMB and genomic alterations. The bar height and error bar represent the AUC and associated 95% CI based on DeLong’s method for n = 247 patients with genomic data. Source data
Fig. 5
Fig. 5. DyAM-based unimodal and multimodal prediction of response.
a, DyAM was used for multimodal integration. CT segmentation-derived features were separated by lesion type (lung PC, PL and LN) with separate attention weights applied. Attention weights are also used for genomics and PD-L1 IHC-derived features to result in a final prediction of response. The model’s modality specific risk score, attention scores and overall score can be analyzed. Mets, metastases. b, Overall score analysis: Kaplan–Meier survival analysis using DyAM to integrate all three modes of data results in significant separation of responders from nonresponders. P values were obtained from the log-rank test. c, Response predictions summary plot with combinations of input data modalities using DyAM and LR models. The coarse, red-hatched regions represent the 1-sigma error on the permutation-tested AUC measurement and the fine, gray-hatched regions represent the 1-sigma error from repeated subsampling. The bar height and error bar represent the AUC and associated 95% CI based on DeLong’s method. For n = 247 patients for the clinical result, n = 187 for the radiology results, n = 105 for the pathology results, n = 247 for the genomic results and n = 247 for the multimodal LR and DyAM results. The asterisks indicate the number of s.d. between the merged AUC and the permutation-tested AUC, with 1–4 asterisks representing 1–4 + s.d. Source data
Fig. 6
Fig. 6. DyAM-based multimodal analysis.
a, HRs and single feature AUCs of covariates. Overall risk score analysis: forest plot of the DyAM model score with respect to other clinical variables (left). Partial risk score analysis: forest plot of the modality specific risk scores from LR compared to DyAM (right). The vertical dashed lines represent a null HR. P values were obtained from the likelihood-ratio test. The bar height and error bar represent the AUC and associated 95% CI based on DeLong’s method for n = 247 patients. b, A zoom in of the first 12 months separated by quartile showing separation of early progression events. P values were obtained from the log-rank test. c, Alpine plots comparing the overall model score after reweighting the input modalities as a function of a multiplier to a single modality’s attention, for the model’s AUC (left), HR (middle) and PFS ratio at 4 months in the lower and higher quartiles (right). For the reweighted AUCs, HRs and PFS ratios, the error bar represents the 68% or 1-sigma CIs based on DeLong’s method, the HR covariance matrix and Poisson standard error on the number of progression events, respectively. Source data
Extended Data Fig. 1
Extended Data Fig. 1. F1, precision and recall score summary plot.
The F1-score (top), precision score (middle) and recall score (bottom) for all models tested. The bar heigh represents the metric calculated on the merged classifier results across the entire cohort with N = 247 patients. Source data
Extended Data Fig. 2
Extended Data Fig. 2. Weights for the LR Clinical model.
Coefficient results for clinical features from the 10-fold train–test scheme for the LR Clinical model. The box-and-whisker plots show the mean and the interquartile range (25–75%) as boxes, the minimum and maximum as whiskers up to 1.5 times the IQR and datapoints outside the IQR range as diamonds, for N = 10 fits. The adjoined bar plot shows the number of times, for a given feature, the following criteria were satisfied: (1) if applicable, the feature was selected as part of the radiomics filtering process, (2) the magnitude of the feature’s weight was at least 1 standard deviation from zero and (3) the magnitude of the feature’s weight was greater than 0.01. Only coefficients selected more than once are shown, up to 100. Source data
Extended Data Fig. 3
Extended Data Fig. 3. Weights for the LR Rad-PC model.
Coefficient results for the parenchymal radiomics features from the 10-fold train–test scheme for the LR Rad-PC model. The box-and-whisker plots show the mean and the interquartile range (25–75%) as boxes, the minimum and maximum as whiskers up to 1.5 times the IQR and datapoints outside the IQR range as diamonds, for N = 10 fits. The adjoined bar plot shows the number of times, for a given feature, the following criteria were satisfied: (1) if applicable, the feature was selected as part of the radiomics filtering process, (2) the magnitude of the feature’s weight was at least 1 standard deviation from zero and (3) the magnitude of the feature’s weight was greater than 0.01. Only coefficients selected more than once are shown, up to 100. Source data
Extended Data Fig. 4
Extended Data Fig. 4. Weights for the LR Rad-LN model.
Coefficient results for the lymph node radiomics features from the 10-fold train–test scheme for the LR Rad-LN model. The box-and-whisker plots show the mean and the interquartile range (25–75%) as boxes, the minimum and maximum as whiskers up to 1.5 times the IQR and datapoints outside the IQR range as diamonds, for N = 10 fits. The adjoined bar plot shows the number of times, for a given feature, the following criteria were satisfied: (1) if applicable, the feature was selected as part of the radiomics filtering process, (2) the magnitude of the feature’s weight was at least 1 standard deviation from zero and (3) the magnitude of the feature’s weight was greater than 0.01. Only coefficients selected more than once are shown, up to 100. Source data
Extended Data Fig. 5
Extended Data Fig. 5. Weights for the LR IHC-A model.
Coefficient results for the intensity-based PD-L1 intensity features from the 10-fold train–test scheme for the LR IHC-A model. The box-and-whisker plots show the mean and the interquartile range (25–75%) as boxes, the minimum and maximum as whiskers up to 1.5 times the IQR and datapoints outside the IQR range as diamonds, for N = 10 fits. The adjoined bar plot shows the number of times, for a given feature, the following criteria were satisfied: (1) if applicable, the feature was selected as part of the radiomics filtering process, (2) the magnitude of the feature’s weight was at least 1 standard deviation from zero and (3) the magnitude of the feature’s weight was greater than 0.01. Only coefficients selected more than once are shown, up to 100. Source data
Extended Data Fig. 6
Extended Data Fig. 6. Weights for the LR IHC-G model.
Coefficient results for all GLCM-based PD-L1 texture features from the 10-fold train–test scheme for the LR IHC-G model. The box-and-whisker plots show the mean and the interquartile range (25–75%) as boxes, the minimum and maximum as whiskers up to 1.5 times the IQR and datapoints outside the IQR range as diamonds, for N = 10 fits. The adjoined bar plot shows the number of times, for a given feature, the following criteria were satisfied: (1) if applicable, the feature was selected as part of the radiomics filtering process, (2) the magnitude of the feature’s weight was at least 1 standard deviation from zero and (3) the magnitude of the feature’s weight was greater than 0.01. Only coefficients selected more than once are shown, up to 100. Source data
Extended Data Fig. 7
Extended Data Fig. 7. Weights for DyAM Rad+IHC-G + Gen model.
Parameter weight results for combined radiomic, GLCM-based PD-L1 texture and genomic features for the DyAM Rad+IHC-G + Gen model. The box-and-whisker plots show the mean and the interquartile range (25–75%) as boxes, the minimum and maximum as whiskers up to 1.5 times the IQR and datapoints outside the IQR range as diamonds, for N = 10 fits. The adjoined bar plot shows the number of times, for a given feature, the following criteria were satisfied: (1) if applicable, the feature was selected as part of the radiomics filtering process, (2) the magnitude of the feature’s weight was at least 1 standard deviation from zero and (3) the magnitude of the feature’s weight was greater than 0.01. Only coefficients selected more than once are shown, up to 100. Source data
Extended Data Fig. 8
Extended Data Fig. 8. Weights for the DyAM Rad+IHC-A + Gen+PD-L1 model.
Parameter weight results for combined radiomic, intensity-based PD-L1 texture, genomic and TPS features for the DyAM Rad+IHC-G + Gen model. The box-and-whisker plots show the mean and the interquartile range (25–75%) as boxes, the minimum and maximum as whiskers up to 1.5 times the IQR and datapoints outside the IQR range as diamonds, for N = 10 fits. The adjoined bar plot shows the number of times, for a given feature, the following criteria were satisfied: (1) if applicable, the feature was selected as part of the radiomics filtering process, (2) the magnitude of the feature’s weight was at least 1 standard deviation from zero and (3) the magnitude of the feature’s weight was greater than 0.01. Only coefficients selected more than once are shown, up to 100. Source data
Extended Data Fig. 9
Extended Data Fig. 9. Receiver operating characteristics for all models using the 10-fold train–test breakdown.
ROC curves showing the results from individual folds as thin colored lines, the averaged and ±1 standard deviation ROC curve calculated from the distribution of the true positive rate in bins of the false positive rate across all folds as a blue curve surrounded by a gray band and the merged AUC as a black curve. For each model and fold result, the subset of N = 247 patients included depending on the available modalities and train–test split is indicated. Source data
Extended Data Fig. 10
Extended Data Fig. 10. Receiver operating characteristics for all models using repeated subsampling.
ROC curves showing the results from the first 10 subsamples as thin colored lines and the averaged and ±1 standard deviation ROC curve calculated from the distribution of the true positive rate in bins of the false positive rate across all subsamples as a blue curve surrounded by a gray band. For each model and fold result, the subset of N = 247 patients included depending on the available modalities and train–test split is indicated. Source data

References

    1. Topalian SL, et al. Safety, activity, and immune correlates of anti-PD-1 antibody in cancer. N. Engl. J. Med. 2012;366:2443–2454. - PMC - PubMed
    1. Callahan MK, Wolchok JD. Recruit or reboot? How does anti-PD-1 therapy change tumor-infiltrating lymphocytes? Cancer Cell. 2019;36:215–217. - PubMed
    1. Gandhi L, et al. Pembrolizumab plus chemotherapy in metastatic non-small-cell lung cancer. N. Engl. J. Med. 2018;378:2078–2092. - PubMed
    1. Hellmann MD, et al. Nivolumab plus ipilimumab in advanced non-small-cell lung cancer. N. Engl. J. Med. 2019;381:2020–2031. - PubMed
    1. Paz-Ares L, et al. Pembrolizumab plus chemotherapy for squamous non-small-cell lung cancer. N. Engl. J. Med. 2018;379:2040–2051. - PubMed

Publication types

MeSH terms

Substances

LinkOut - more resources