. 2022 Dec 19;145(12):4368-4384.
doi: 10.1093/brain/awac313.

DJ-1 is an essential downstream mediator in PINK1/parkin-dependent mitophagy

Affiliations

DJ-1 is an essential downstream mediator in PINK1/parkin-dependent mitophagy

Dorien Imberechts et al. Brain. .

Abstract

Loss-of-function mutations in the PRKN, PINK1 and PARK7 genes (encoding parkin, PINK1 and DJ-1, respectively) cause autosomal recessive forms of Parkinson's disease. PINK1 and parkin jointly mediate selective autophagy of damaged mitochondria (mitophagy), but the mechanisms by which loss of DJ-1 induces Parkinson's disease are not well understood. Here, we investigated PINK1/parkin-mediated mitophagy in cultured human fibroblasts and induced pluripotent stem cell-derived neurons with homozygous PARK7 mutations. We found that DJ-1 is essential for PINK1/parkin-mediated mitophagy. Loss of DJ-1 did not interfere with PINK1 or parkin activation after mitochondrial depolarization but blocked mitophagy further downstream by inhibiting recruitment of the selective autophagy receptor optineurin to depolarized mitochondria. By contrast, starvation-induced, non-selective autophagy was not affected by loss of DJ-1. In wild-type fibroblasts and induced pluripotent stem cell-derived dopaminergic neurons, endogenous DJ-1 translocated to depolarized mitochondria in close proximity to optineurin. DJ-1 translocation to depolarized mitochondria was dependent on PINK1 and parkin and did not require oxidation of cysteine residue 106 of DJ-1. Overexpression of DJ-1 did not rescue the mitophagy defect of PINK1- or parkin-deficient cells. These findings position DJ-1 downstream of PINK1 and parkin in the same pathway and suggest that disruption of PINK1/parkin/DJ-1-mediated mitophagy is a common pathogenic mechanism in autosomal recessive Parkinson's disease.

Keywords: DJ-1; Parkinson’s disease; autophagy; mitophagy; optineurin.


Figures

Figure 1
Figure 1
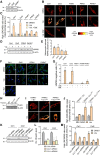
Impaired mitophagy in DJ-1-deficient human fibroblasts. (A) WB for endogenous DJ-1 in fibroblasts from healthy controls (Ctrl1, Ctrl2) and a PD patient with homozygous PARK7 mutations. (B and C) Fibroblasts from healthy controls and PD patients with homozygous PINK1, compound heterozygous PRKN and homozygous PARK7 mutations were transfected with mito-Keima and treated for 48 h with DMSO, valinomycin (Val., 1 µM) and bafilomycin A1 (Baf., 100 nM), followed by live ratiometric imaging. High (543:458) ratio signal corresponds to mito-Keima present in lysosomes. (C) High (543:458) ratio area/total mitochondrial area was quantified as an index of mitophagy (n = 3–5). *P < 0.001 compared with all conditions other than Ctrl Val. (D and E) Fibroblasts from healthy controls and patients with PRKN or PARK7 mutations were treated for 48 h with DMSO or Val., followed by western. (E) Quantification (n = 5). *P < 0.05 compared with PRKN and PARK7. (F and G) Fibroblasts were treated as indicated for 48 h and immunostained for mitochondrial marker HSP60. Nuclei were stained with TOTO-3. Arrows indicate examples of cells without detectable HSP60 staining. (G) Quantification of percentage cells without detectable HSP60 (n = 3, with at least 200 cells analysed per condition in each of the three experiments). *P < 0.0001 compared with all conditions other than Ctrl Val. (H) WB of Ctrl1 fibroblasts transfected with empty vector (EV) or FLAG-tagged wild-type (WT) or C106A DJ-1. (I and J) PARK7 mutant fibroblasts were cotransfected with mito-Keima and either EV or FLAG-tagged WT or C106A DJ-1. After 24 h, cells were treated with DMSO or Val. (1 µM) for 48 h, followed by mito-Keima imaging. (J) Quantification (n = 3). *P < 0.0001 compared with EV Val. and all DMSO conditions. (K and L) Control fibroblasts were transfected with the indicated siRNAs for 72 h, followed by western. (L) Quantification (n = 3). *P < 0.05 compared with all other conditions in the same subject. (M) Control fibroblasts were transfected with mito-Keima and the indicated siRNAs. After 72 h, cells were treated with DMSO or Val. (1 µM) for 48 h, followed by mito-Keima imaging and quantification (n = 3). *P < 0.005 compared with all other conditions in the same subject. Scale bars = 10 µm. Illustrations of mito-Keima imaging in the siRNA-transfected cells are shown in Supplementary Fig. 6.
Figure 2
Figure 2
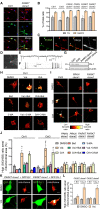
Impaired mitophagy in DJ-1-deficient iPSC-derived human neurons. (A and B) On Day 50 after neuronal induction, iPSC-derived neuronal cultures from healthy controls (Ctrl1, Ctrl3) and PD patients with PRKN (clones 1 and 2) and PARK7 mutations (clones 1 and 2) were immunostained for MAP2 and tyrosine hydroxylase (TH). Nuclei were stained with TOTO-3. Scale bar = 20 μm. TH and MAP2 immunostainings of neuronal cultures derived from Ctrl3, PRKN mutant (clones 1 and 2) and PARK7 mutant (clone 2) iPSCs are shown in Supplementary Fig. 8. (B) Quantification of percentage of TH- and MAP2-positive cells (n = 3–6). (C) Immunostaining for PSD-95, synaptophysin (Syn) and TH in neurites from Ctrl3. Arrows indicate colocalization of PSD-95 and Syn. Scale bar = 2 μm. (D) Phase contrast image of iPSC-derived neuron (Ctrl3) during patch-clamp recording. (E) Whole-cell voltage clamp recording of iPSC-derived neuron (Ctrl3) showing spontaneous excitatory postsynaptic currents (Vholding = −70 mV). (F) Current-clamp recording of iPSC-derived neuron (Ctrl3) showing spontaneous action potentials and irregular bursting behaviour. Vrest = −64 mV. (G) WB for endogenous DJ-1 in iPSC-derived neuronal cultures from healthy controls and PD patient with PARK7 mutations (clones 1 and 2). (HJ) On Day 48 after neuronal induction, neurons from healthy controls and PD patients with PRKN (clones 1 and 2) and PARK7 mutations (clones 1 and 2) were transduced with mito-Keima lentivirus. After 48 h, cells were treated for 24 h with DMSO, valinomycin (Val., 1 μM), a combination of oligomycin (10 µM) and antimycin (4 µM) (O/A), bafilomycin A1 (Baf., 100 nM) or 3-methyladenine (3-MA, 10 mM), as indicated, followed by live ratiometric mito-Keima imaging. Scale bar = 10 μm. (J) High (543:458) ratio area:total mitochondrial area was quantified as an index of mitophagy (n = 3–4). *P < 0.005 compared with all conditions other than Ctrl Val. and Ctrl O/A. (K and L) On day 46 after neuronal induction, PARK7 mutant neurons (clones 1 and 2) were transduced with either GFP-tagged empty vector (EV) or GFP-tagged WT DJ-1 lentivirus. On day 48, cells were transduced with mito-Keima lentivirus. After 24 h, cells were treated as indicated for 24 h, followed by mito-Keima imaging. Scale bar = 10 μm. (L) Quantification (n = 3). *P < 0.0001 compared with all other conditions in the same clone.
Figure 3
Figure 3
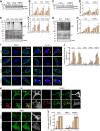
Non-selective autophagy is preserved in PARK7 mutant fibroblasts and neurons. (A and B) Fibroblasts from healthy controls (Ctrl1, Ctrl2) and PD patients with homozygous PINK1, compound heterozygous PRKN or homozygous PARK7 mutations were transfected with Keima and incubated either in standard culture medium (DMEM) or in EBSS for 4 h to trigger starvation-induced autophagy, in the presence or absence of bafilomycin A1 (Baf., 100 nM), followed by live ratiometric Keima imaging. High (543:458) ratio signal corresponds to Keima present inside lysosomes. (B) Quantification (n = 3). *P < 0.0001 compared with all other conditions in the same subject. (C and D) Ctrl1 and PARK7 mutant fibroblasts were incubated for 4 h in DMEM or EBSS in the presence or absence of Baf. (100 nM), followed by WB for LC3. (D) Quantification (n = 8). *P < 0.0001 compared with all other conditions in the same subject. (E and F) Neurons from Ctrl1 and a PD patient with PARK7 mutations (clone 1) were transduced with Keima lentivirus and incubated in EBSS for 4 h or treated with the mTOR inhibitor Torin1 (1 µM), Baf. (100 nM) or 3-methyladenine (3-MA, 10 mM) for 24 h, followed by live Keima imaging. (F) Quantification (n = 3–6). *P < 0.001 compared with the basal, EBSS and Torin1 conditions in the same subject. Scale bars = 10 μm.
Figure 4
Figure 4
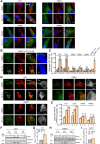
PINK1 accumulation and activity is intact in PARK7 mutant cells. (A and B) Healthy control (Ctrl1, Ctrl2) and PARK7 mutant fibroblasts were treated with valinomycin (Val., 1 µM) for the indicated time, followed by WB for endogenous PINK1. (B) Quantification (n = 4). *P < 0.05 compared with DMSO in the same subject. (C and D) Ctrl1 and PARK7 mutant (clone 1) iPSC-derived neurons were treated with Val. (1 µM) for the indicated time, followed by western for endogenous PINK1. (D) Quantification (n = 6). *P < 0.05 compared with DMSO in the same subject. (E and F) Ctrl1, Ctrl2, PINK1 mutant and PARK7 mutant fibroblasts were treated with Val., followed by western for endogenous phospho-ubiquitin (p-Ub) and total Ub. (F) Quantification (n = 4–5). *P < 0.05 compared with DMSO in the same subject. #P < 0.05 compared with Ctrl1, Ctrl2 and PARK7 after the same duration of Val. exposure. (G and H) Ctrl1 and PARK7 mutant (clone 1) neurons were treated with Val. (1 µM) as indicated, followed by western for endogenous p-Ub and total Ub. (H) Quantification (n = 4). *P < 0.05 compared with DMSO in the same subject. (I and J) Ctrl1, Ctrl2, PINK1, PRKN and PARK7 mutant fibroblasts were treated with DMSO or valinomycin (Val., 1 µM) for the indicated time and immunostained for endogenous phospho-ubiquitin (p-Ub) and the mitochondrial marker ATP5F1B. Nuclei were stained with TOTO-3. Arrowheads in I indicate examples of p-Ub puncta that colocalize with mitochondria. (J) Quantification of the percentage of cells with p-Ub/ATP5F1B colocalization (n = 3). *P < 0.05 compared with Ctrl1, Ctrl2 and PARK7 after the same duration of Val. exposure. #P < 0.005 compared with Val. 1, 3, 6 and 12 h in the same subject. (K and L) On day 50 after neuronal induction, Ctrl1, PRKN (clone 1) and PARK7 (clone 1) mutant neurons were treated with DMSO or Val. (1 µM) for the indicated time and immunostained for endogenous p-Ub, ATP5F1B and tyrosine hydroxylase (TH). Arrowheads in K indicate examples of p-Ub puncta that colocalize with mitochondria. (L) Quantification of the percentage of TH-positive cells with p-Ub/ATP5F1B colocalization (n = 3). *P < 0.0001 compared with Ctrl1 and PARK7 after the same duration of Val. exposure. #P < 0.0001 compared with all Val. conditions in the same subject. Scale bars = 10 µm.
Figure 5
Figure 5
Parkin activation is intact in PARK7 mutant cells. (A and B) Control and PARK7 mutant fibroblasts were transfected with FLAG-parkin. After 24 h cells were treated with DMSO or Val. (1 µM) for the indicated time and immunostained for FLAG and the mitochondrial marker ATP5F1B. Nuclei were stained with TOTO-3. Arrowheads indicate parkin puncta on mitochondria. Scale bar = 10 µm. (B) Quantification (n = 3). *P < 0.0001 compared with all Val. conditions in the same subject. (C and D) Control, PRKN mutant and PARK7 mutant fibroblasts were treated with DMSO or valinomycin (Val., 1 µM) for 3 h, followed by western for mitofusin 2 (MFN2). Red arrowheads indicate ubiquitinated MFN2. (D) Quantification (n = 3). *P < 0.05 compared with DMSO in the same subject. #P < 0.05 compared with Val. in Ctrl1, Ctrl2 and PARK7.
Figure 6
Figure 6
Optineurin recruitment to depolarized mitochondria is impaired in PARK7 mutant fibroblasts and neurons. (AC) Control (Ctrl1, Ctrl2), PINK1, PRKN and PARK7 mutant fibroblasts were transfected with GFP-tagged optineurin (GFP-OPTN). (B and C) PARK7 mutant fibroblasts were cotransfected with GFP-OPTN and either empty vector (EV) or DJ-1-FLAG. (AC) After 24 h cells were treated with DMSO or valinomycin (Val., 1 µM) for the indicated time, and immunostained for the mitochondrial marker ATP5F1B and FLAG. Nuclei in A were stained with TOTO-3. Arrowheads indicate GFP-OPTN puncta on mitochondria. Immunostaining images for Ctrl2 and for PARK7 + EV are shown in Supplementary Fig. 9A and B , respectively. (C) Quantification of the percentage of cells showing GFP-OPTN/ATP5F1B colocalization (n = 3). #P < 0.0001 compared with DMSO in the same subject. *P < 0.0001 compared with Ctrl1, Ctrl2 and PARK7 + DJ-1 after the same duration of Val. exposure. (D and E) iPSC-derived control, PRKN (clone 1) and PARK7 (clone 1) mutant neurons were treated with DMSO or Val. (1 µM) for the indicated time and immunostained for endogenous OPTN, ATP5F1B and tyrosine hydroxylase (TH). Arrowheads indicate colocalization of OPTN with mitochondria. (E) Quantification of the percentage of TH-positive cells showing OPTN/ATP5F1B colocalization (n = 3). *P < 0.0001 compared with all Val. conditions in the same subject. #P < 0.001 compared with Ctrl1 and Ctrl3 after the same duration of Val. exposure. Scale bars = 10 µm. (FI) Ctrl1 neurons (F and G) and PARK7 mutant neurons (H and I) were treated with DMSO or Val. for 6 h, followed by subcellular fractionation and western blotting of total (Tot.), cytosolic (Cyt.) and mitochondrial (Mit.) fractions for endogenous OPTN, ATP5F1B and the non-mitochondrial protein COPB1. Equal amounts of protein (15 µg) were loaded for all fractions. This amount of 15 µg corresponded to nearly the entire mitochondrial fraction and to only ∼5% of the cytosolic fraction, explaining why the ∼2.5-fold increase in mitochondrial optineurin after valinomycin treatment in Ctrl1 cells (F and G) did not result in a visible decrease of optineurin in the cytosolic fraction. (G and I) Quantification of OPTN/ATP5F1B (normalized to DMSO) in the mitochondrial fraction (n = 4). *P < 0.001 compared with DMSO (G).
Figure 7
Figure 7
DJ-1 translocates to depolarized mitochondria in close proximity with optineurin in wild-type fibroblasts and neurons. (A and B) Control (Ctrl1) fibroblasts were treated with DMSO or valinomycin (Val., 1 µM) for the indicated time and immunostained for endogenous DJ-1 and the mitochondrial marker ATP5F1B. Nuclei were stained with TOTO-3. Arrowheads indicate examples of DJ-1 puncta that colocalize with mitochondria. (B) Quantification of the percentage cells with DJ-1/ATP5F1B colocalization (n = 3). For comparison, the time course of GFP-optineurin (GFP-OPTN)/ATP5F1B colocalization is also shown (n = 3). *P < 0.005 compared with the 3, 6, 12 and 24 h Val. condition for DJ-1/ATP5F1B colocalization. $P < 0.0001 compared with the 3 and 6 h Val. condition for GFP-OPTN/ATP5F1B colocalization. (C and D) Ctrl1 neurons were treated with Val. (1 µM) for the indicated time and immunostained for endogenous DJ-1, ATP5F1B and tyrosine hydroxylase (TH). Arrowheads indicate examples of DJ-1 puncta that colocalize with mitochondria. (D) Quantification of the percentage of TH-positive cells with DJ-1/ATP5F1B colocalization (n = 3). *P < 0.05 compared with the 3 and 12 h Val. condition. (E and F) Ctrl1 neurons were treated with DMSO or Val. for 6 h, followed by subcellular fractionation and western blotting of total (Tot.), cytosolic (Cyt.) and mitochondrial (Mit.) fractions for endogenous DJ-1, ATP5F1B and the non-mitochondrial protein COPB1. Equal amounts of protein (15 μg) were loaded for all fractions. This amount of 15 µg corresponded to nearly the entire mitochondrial fraction and to only ∼5% of the cytosolic fraction, explaining why the ∼2-fold increase in mitochondrial DJ-1 after valinomycin treatment in Ctrl1 cells (E and F) did not result in a visible decrease of DJ-1 in the cytosolic fraction. (F) Quantification of DJ-1/ATP5F1B (normalized to DMSO) in the mitochondrial fraction (n = 6). *P < 0.0001 compared with DMSO. (G and H) Ctrl1 fibroblasts were transfected with GFP-OPTN and after 24 h cells were treated with DMSO or Val. (1 µM) for the indicated time and immunostained as indicated. Arrowheads indicate examples of colocalization. (H) Percentages were quantified of cells with colocalization of DJ-1/GFP-OPTN/ATP5F1B. *P < 0.0001 compared with the 3 and 6 h Val. condition. (I and J) Ctrl1 fibroblasts were treated with DMSO or Val. for 6 h, followed by proximity ligation (PLA) with antibodies against endogenous OPTN and DJ-1 and immunostaining for the mitochondrial marker HSP60. Arrowheads indicate examples of PLA dots that colocalize with mitochondria. (J) Quantification (n = 3). *P < 0.0001 compared with DMSO. Scale bars = 5 µm. (K) Ctrl1 fibroblasts were transfected (Transf.) with empty vector (EV) of FLAG-tagged DJ-1, as indicated, and treated with DMSO or Val. for 6 h. After coimmunoprecipitation with anti-FLAG beads, the input and immunoprecipitate (IP) were analysed by sodium dodecyl-sulphate–polyacrylamide gel electrophoresis and western blotting using the indicated antibodies. The shown example is representative of six experiments.
Figure 8
Figure 8
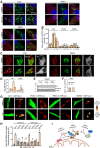
DJ-1 translocation to depolarized mitochondria depends on PINK1 and parkin. (A and B) Control (Ctrl1), PINK1 and PRKN mutant fibroblasts were treated with DMSO or valinomycin (Val., 1 µM) for the indicated time and immunostained for endogenous DJ-1 and ATP5F1B. Nuclei were stained with TOTO-3. Arrows indicate DJ-1 puncta on mitochondria. (B) Quantification (n = 3). #P < 0.05 compared with the 3, 6, 12 and 24 h Val. conditions in the same subject. *P < 0.0001 compared with Ctrl1 after the same duration of Val. exposure. (C and D) Control (Ctrl1) and PRKN mutant (clone 1) neurons were treated with DMSO or Val. (1 µM) for the indicated time and immunostained for endogenous DJ-1, ATP5F1B and tyrosine hydroxylase (TH). Arrowheads indicate DJ-1 puncta that colocalize with mitochondria. (D) Quantification (n = 3). #P < 0.005 compared with Ctrl1 after the same duration of Val. exposure. *P < 0.0001 compared with DMSO in the same subject. §P < 0.001 compared with DMSO in the same subject. (E and F) PRKN mutant neurons were treated with DMSO or Val. for 6 h, followed by subcellular fractionation and western blotting of total (Tot.), cytosolic (Cyt.) and mitochondrial (Mit.) fractions for endogenous DJ-1, the mitochondrial protein ATP5F1B and the non-mitochondrial protein COPB1. Equal amounts of protein (15 μg) were loaded for all fractions. (F) Quantification of DJ-1/ATP5F1B (normalized to DMSO) in the mitochondrial fraction (n = 4; P = 0.92 for DMSO versus Val.). (G and H) Ctrl1, PINK1, PRKN and PARK7 mutant fibroblasts were transfected with mito-Keima and either GFP empty vector (EV) or GFP-tagged wild-type DJ-1. After 24 h, cells were treated for 48 h with DMSO or Val. (1 µM), followed by live mito-Keima imaging. (H) Quantification (n = 3). *P < 0.0001 compared with DMSO in the same subject. #P < 0.0001 compared with Val. in Ctrl1 + GFP-EV. $P < 0.001 compared with Val. in Ctrl1 + GFP-DJ-1 and with Val. in PARK7 + GFP-DJ-1. Scale bars = 10 µm. (I) Model (drawn with Biorender.com). After mitochondrial depolarization PINK1 activates parkin by phosphorylating ubiquitin and parkin. Activated parkin catalyses formation of ubiquitin (Ub) chains on mitochondria. DJ-1 facilitates recruitment of optineurin (OPTN) to mitochondrial ubiquitin chains and interacts with OPTN either directly or indirectly via an unknown (indicated by ?) binding partner. PINK1, PRKN and PARK7 mutations interfere with three successive steps in the pathway. P = phosphate; ΔΨm = mitochondrial depolarization.

Comment in

References

    1. GBD 2016 Parkinson’s Disease Collaborators . Global, regional and national burden of Parkinson’s disease. 2016. 1990-2016: A systematic analysis for the global burden of disease study 2016. Lancet Neurol. 2018;17:939–53. - PMC - PubMed
    1. Poewe W, Seppi K, Tanner CM, et al. . Parkinson disease. Nat Rev Dis Primers. 2017;3:17013. - PubMed
    1. Bandres-Ciga S, Diez-Fairen M, Kim JJ, Singleton AB. Genetics of Parkinson’s disease: An introspection of its journey towards precision medicine. Neurobiol Dis. 2020;137:104782. - PMC - PubMed
    1. Wittke C, Petkovic S, Dobricic V, et al. . Genotype-phenotype relations for the atypical parkinsonism genes: MDSGene systematic review. Mov Disord. 2021;36:1499–110. - PMC - PubMed
    1. Malpartida AB, Williamson M, Narendra DP, Wade-Martins R, Ryan BJ. Mitochondrial dysfunction and mitophagy in Parkinson’s disease: From mechanism to therapy. Trends Biochem Sci. 2021;46:329–43. - PubMed

Publication types