. 2022 Sep 9;50(16):9212-9225.
doi: 10.1093/nar/gkac716.

Lysine 27 dimethylation of Drosophila linker histone dH1 contributes to heterochromatin organization independently of H3K9 methylation

Affiliations

Lysine 27 dimethylation of Drosophila linker histone dH1 contributes to heterochromatin organization independently of H3K9 methylation

Jordi Bernués et al. Nucleic Acids Res. .

Abstract

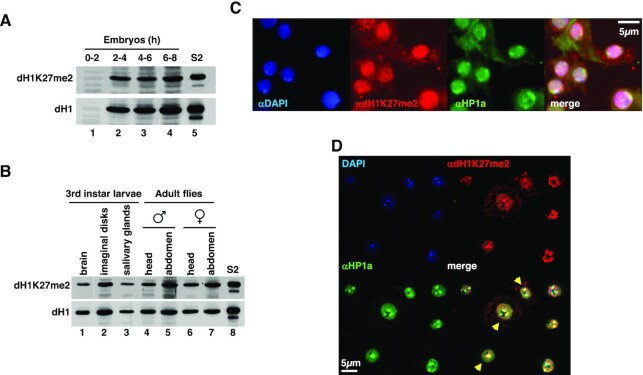
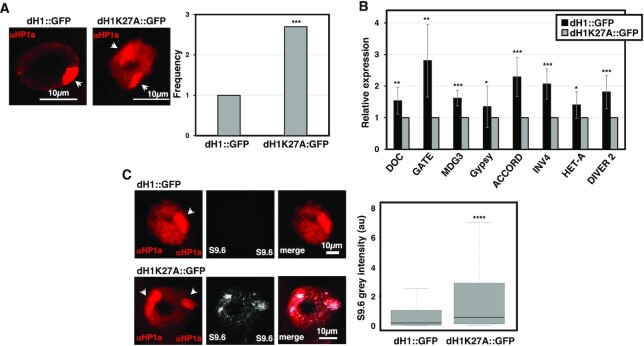
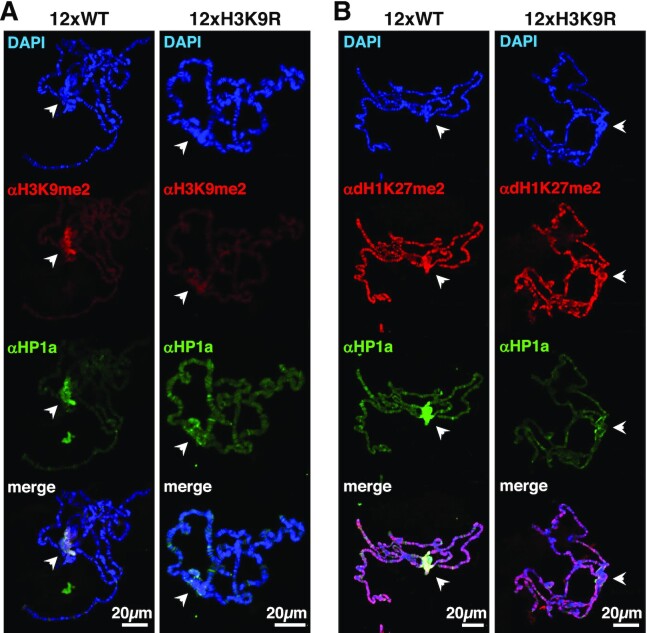
Post-translational modifications (PTMs) of core histones are important epigenetic determinants that correlate with functional chromatin states. However, despite multiple linker histone H1s PTMs have been identified, little is known about their genomic distribution and contribution to the epigenetic regulation of chromatin. Here, we address this question in Drosophila that encodes a single somatic linker histone, dH1. We previously reported that dH1 is dimethylated at K27 (dH1K27me2). Here, we show that dH1K27me2 is a major PTM of Drosophila heterochromatin. At mitosis, dH1K27me2 accumulates at pericentromeric heterochromatin, while, in interphase, it is also detected at intercalary heterochromatin. ChIPseq experiments show that >98% of dH1K27me2 enriched regions map to heterochromatic repetitive DNA elements, including transposable elements, simple DNA repeats and satellite DNAs. Moreover, expression of a mutated dH1K27A form, which impairs dH1K27me2, alters heterochromatin organization, upregulates expression of heterochromatic transposable elements and results in the accumulation of RNA:DNA hybrids (R-loops) in heterochromatin, without affecting H3K9 methylation and HP1a binding. The pattern of dH1K27me2 is H3K9 methylation independent, as it is equally detected in flies carrying a H3K9R mutation, and is not affected by depletion of Su(var)3-9, HP1a or Su(var)4-20. Altogether these results suggest that dH1K27me2 contributes to heterochromatin organization independently of H3K9 methylation.


Figures

Figure 1.
Figure 1.
Ubiquitous expression of dH1meK27me2. (A) WB analysis with αdH1 and αdH1K27me2 of perchloric acid (PCA) extracts from w1118embryos staged after egg laying for the indicated time periods (lanes 1–4). Lane 5 shows a PCA extract from S2 cells as control. (B) WB analysis with αdH1 and αdH1meK27me2 of PCA extracts from the indicated w1118 larval organs (lanes 1–3), and head and abdomen of adult male (lanes 4 and 5) and female (lanes 6 and 7) flies. Lane 8 shows a PCA extract from S2 cells as control. (C) Immunostaining of w1118larval brain squashes with αdH1K27me2 (in red) and αHP1a (in green). DNA was stained with DAPI (in blue). Scale bar corresponds to 5 μm. (D) Immunostaining of interphase S2 cells with αdH1K27me2 (in red) and αHP1a (in green). DNA was stained with DAPI (in blue). Yellow arrows indicate nuclei in which αdH1K27me2 signal accumulates at αHP1a foci. Scale bar corresponds to 5μm.
Figure 2.
Figure 2.
dH1K27me2 pattern in polytene chromosomes. (A) Immunostaining of w1118 polytene chromosomes with αdH1K27me2 (in red) and αHP1a (in green). DNA was stained with DAPI (in blue). Scale bar corresponds to 20μm. (B) Enlarged image of region 1 in A. Arrows indicate the chromocenter and chromosome 4. Scale bar corresponds to 10 μm (C) Enlarged image of region 2 in A showing overlapping of αdH1K27me2 bands (in red) with DAPI bands (in blue). Scale bar corresponds to 10 μm
Figure 3.
Figure 3.
Pericentromeric accumulation of dH1K27me2 in metaphase chromosomes. (A) Metaphase chromosome spreads from w1118 larval brain squashes immunostained with αdH1K27me2 (in red, left) and αdH1 (in red, right). DNA was stained with DAPI (in blue). Scale bars correspond to 20μm. (B) Metaphase chromosome spreads from S2 cells immunostained with αdH1K27me2 (in red, top) and αdH1 (in red, bottom). DNA was stained with DAPI (in blue). Scale bars correspond to 20 μm. (C) Metaphase chromosome spreads from Kc167 cells immunostained with αdH1K27me2 (in red). DNA was stained with DAPI (in blue). Scale bar corresponds to 20 μm.
Figure 4.
Figure 4.
αdH1K27me2 ChIPseq analysis in S2 cells. (A) Chromosomal distribution of the identified dH1K27me2 enriched regions. chr2L and chr2R, and chr3L and chr3R correspond to chromosome 2 and 3 left and right arms respect to the position of the centromere, respectively. Asterisks indicate dH1K27me2 enriched regions clustering at pericentromeric regions. chr4 and chrX are oriented with the centromere to the right. chr2LHet, chr2RHet, chr3LHet, chr3RHet, chrXHet and chrYHet correspond to partially assembled pericentromeric heterochromatin regions of the indicated chromosomes. chrU and chrUextra correspond to unassembled highly repetitive heterochromatic regions. chrM corresponds to the mitochondrial chromosome. (B) The proportion of dH1K27me2 enriched regions assigned to each of the nine chromatin epigenetic states according to (3). NA: dH1K27me2 enriched regions that could not be assigned to any chromatin state. (C) Permutation analysis showing statistical significance of the association of dH1K27me2 enriched regions with chromatin state 7 (heterochromatin) according to (3). The frequency of the number of overlaps is presented based on 5000 random permutations of the experimentally identified regions. The average expected number of overlaps (black) is compared with the observed number of overlaps (green). The α = 0.05 confidence interval is indicated (red). z-score and permutation test P-value of the difference are also indicated. (D) Pie graph showing the proportion of identified dH1K27me2 enriched regions as a function of their content in repeated sequences. (E) ChIP-qPCR analysis with αdH1K27me2 (blue bars), αH4K20me3 (red bars) and αH3K9me2 (gray bars) at the indicated genomic region is presented as the fold enrichment respect to U6 as a control region. Error bars are s.e.m. P-values respect to U6 are indicated (*<0.1; **<0.05; ***<0.001; two-tailed Student's t-test). (F) Coverage profiles for αdH1 and αdH1K27me2 ChIPseqs are presented for the indicated genomic regions. Genomic organization and Dm3 coordinates of the regions are indicated. Blue bars indicate dH1K27me2-enriched regions. (G) The fraction of total ChIPseq reads at dH1K27me2 enriched regions are presented for αdH1 and αdH1K27me2 ChIPseqs (P-value < 2.2 × 10–16; Pearson's chi-squared test with Yates' continuity correction).
Figure 5.
Figure 5.
Expression of dH1K27A::GFP reduces dH1K27me2. Polytene chromosomes from flies expressing wild-type dH1::GFP (center) and mutant dH1K27A::GFP (bottom) were mixed with polytene chromosomes from control flies (top) and co-immunostained with αGFP (in yellow, to distinguish control and GFP-expressing chromosomes), αdH1K27me2 (in red) and αHP1a (in green). Expression was induced with Nub-GAL4 at 29°C. DNA was stained with DAPI (in blue). Arrowheads indicate the chromocenter. Scale bars correspond to 20 μm.
Figure 6.
Figure 6.
Expression of dH1K27A::GFP impacts heterochromatin organization. (A) Expression of dH1K27A::GFP results in a split-chromocenter phenotype. On the left, nuclei in whole salivary glands from flies expressing dH1::GFP (left) and dH1K27A::GFP (right) were immunostained with αHP1a (in red). Expression was induced with Da-GAL4. Arrowheads indicate the chromocenter. Scale bars correspond to 10 μm. On the right, quantitative analysis of the results. The normalized frequencies of nuclei showing split chromocenter are shown for flies expressing dH1::GFP (N = 280) or mutant dH1K27A::GFP (N = 325). (P-value: ***<0.001; two-tailed Fischer F exact test). (B). RT-qPCR analysis of total RNAs extracted from larvae overexpressing dH1::GFP or dH1K27A::GFP. Expression was induced with Da-GAL4. Results were normalized to RPL32 and fold changes vs dH1::GFP are presented. Error bars are s.e.m. P-values are indicated (**P < 0.05, ***P < 0.01; Benjamini–Hochberg mixed linear model). (C) Expression of dH1K27A::GFP enhances R-loops formation at the chromocenter. On the left, immunostaining with S9.6 antibodies (in gray) and αHP1a (in red) of nuclei from intact salivary glands expressing dH1::GFP or dH1K27A::GFP. Expression was induced with Da-GAL4. Arrowheads indicate the chromocenter. Scale bar corresponds to 10 μm. On the right, quantitative analysis of the results. The integrated grey intensity with S9.6 at the chromocenter is shown for nuclei from intact salivary glands expressing dH1::GFP (N = 699) or dH1K27A::GFP (N = 405). (P-value: ****< 0.0001; Kruskal–Wallis test).
Figure 7.
Figure 7.
dH1K27A expression does not affect H3K9 methylation and HP1a binding. (A) Polytene chromosomes from flies expressing dH1::GFP (center) and mutant dH1K27A::GFP (bottom) were mixed with polytene chromosomes from control flies (top) and co-immunostained with αGFP (in yellow, to distinguish control and GFP-expressing chromosomes), αH3K9me2 (in red) and αHP1a (in green). Expression was induced with Nub-GAL4. DNA was stained with DAPI (in blue). Arrowheads indicate the chromocenter. Scale bars correspond to 20 μm. (B) WB analysis with αH3K9me2 (upper), αHP1a (center) and αH4 (bottom) of total salivary glands extracts obtained from control flies and flies expressing dH1::GFP and mutant dH1K27A::GFP.
Figure 8.
Figure 8.
dH1K27me2 is independent of histone H3K9 methylation. (A) Immunostaining with αH3K9me2 (in red) and αHP1a (in green) of polytene chromosomes from flies carrying 12 copies of a wild-type WT (left) or a mutated H3K9R histone repeat (right) in front of a deficiency of the HisC locus. DNA was stained with DAPI (in blue). Arrowheads indicate the chromocenter. Scale bars correspond to 20μm. (B) As in A but stained with αdH1K27me2 (in red) and αHP1a (in green).

References

    1. Fyodorov D.V., Zhou B.-R., Skoultchi A.I., Bai Y.. Emerging roles of linker histones in regulating chromatin structure and function. Nat. Rev. Mol. Cell Biol. 2018; 19:193–206. - PMC - PubMed
    1. Kouzarides T. Chromatin modifications and their function. Cell. 2007; 128:693–705. - PubMed
    1. Kharchenko P.V., Alekseyenko A.A., Schwartz Y.B., Minoda A., Riddle N.C., Ernst J., Sabo P.J., Larschan E., Gorchakov A.A., Gu T.et al. .. Comprehensive analysis of the chromatin landscape in Drosophila melanogaster. Nature. 2011; 471:480–485. - PMC - PubMed
    1. Filion G.J., van Bemmel J.G., Braunschweig U., Talhout W., Kind J., Ward L.D., Brugman W., de Castro I.J., Kerkhoven R.M., Bussemaker H.J.et al. .. Systematic protein location mapping reveals five principal chromatin types in Drosophila cells. Cell. 2010; 143:212–224. - PMC - PubMed
    1. Elgin S.C.R., Reuter G.. Position-Effect variegation, heterochromatin formation, and gene silencing in Drosophila. Cold Spring Harb. Perspect. Biol. 2013; 5:a017780. - PMC - PubMed

Publication types

LinkOut - more resources