. 2022 Sep 23;50(17):10169-10186.
doi: 10.1093/nar/gkac727.

Structural insights into the dual activities of the two-barrel RNA polymerase QDE-1

Affiliations

Structural insights into the dual activities of the two-barrel RNA polymerase QDE-1

Ruixue Cui et al. Nucleic Acids Res. .

Abstract

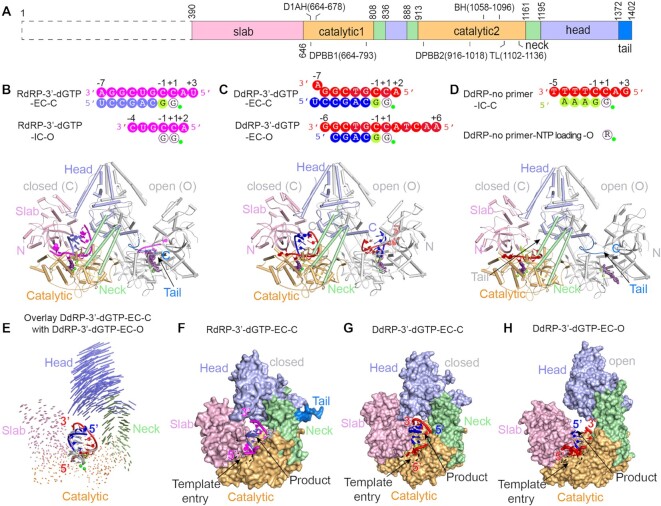
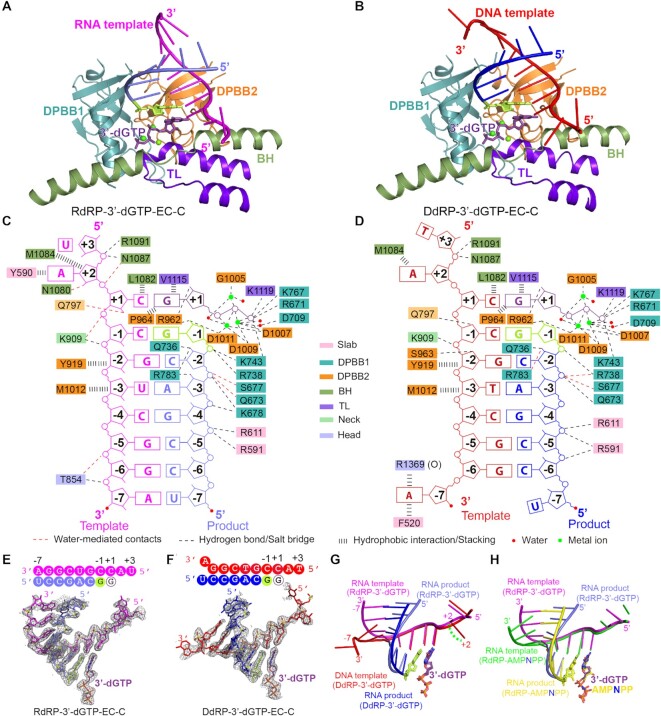
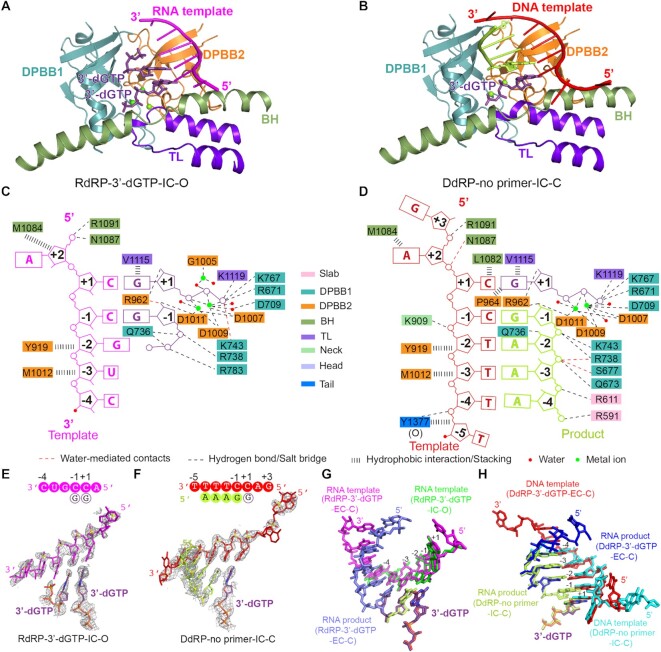
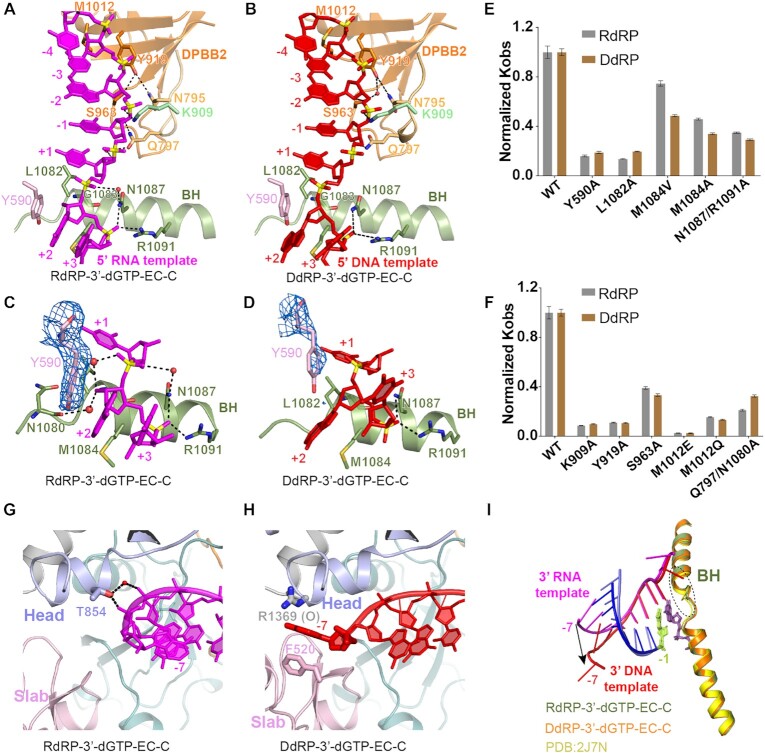
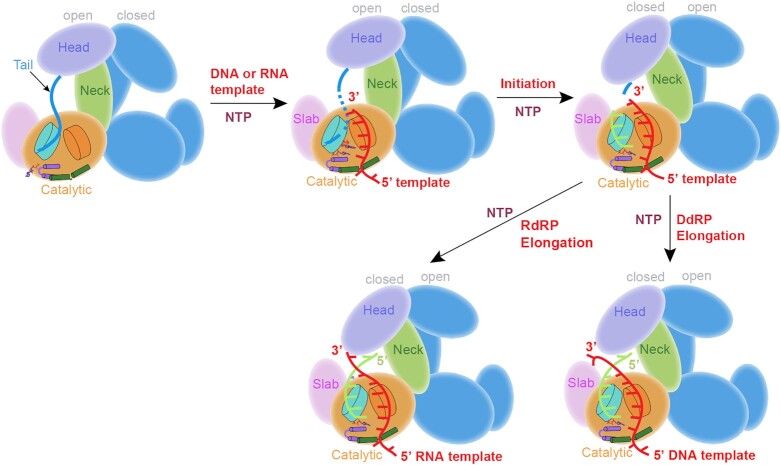
Neurospora crassa protein QDE-1, a member of the two-barrel polymerase superfamily, possesses both DNA- and RNA-dependent RNA polymerase (DdRP and RdRP) activities. The dual activities are essential for the production of double-stranded RNAs (dsRNAs), the precursors of small interfering RNAs (siRNAs) in N. crassa. Here, we report five complex structures of N-terminal truncated QDE-1 (QDE-1ΔN), representing four different reaction states: DNA/RNA-templated elongation, the de novo initiation of RNA synthesis, the first step of nucleotide condensation during de novo initiation and initial NTP loading. The template strand is aligned by a bridge-helix and double-psi beta-barrels 2 (DPBB2), the RNA product is held by DPBB1 and the slab domain. The DNA template unpairs with the RNA product at position -7, but the RNA template remains paired. The NTP analog coordinates with cations and is precisely positioned at the addition site by a rigid trigger loop and a proline-containing loop in the active center. The unique C-terminal tail from the QDE-1 dimer partner inserts into the substrate-binding cleft and plays regulatory roles in RNA synthesis. Collectively, this work elucidates the conserved mechanisms for DNA/RNA-dependent dual activities by QDE-1 and other two-barrel polymerase superfamily members.


Figures

Figure 1.
Figure 1.
Co-crystal structures of QDE-1ΔN in complex with substrates. (A) Domain architecture of QDE-1, N-terminus (black dashed box), slab (light pink), catalytic (light orange), neck (pale green), head (light blue) and C-tail (aquamarine) domains. (B) Co-crystal structure of QDE-1ΔN with a 14 nt RNA template, 6 nt RNA primer, 3′-dGTP and cations, designated QDE-1ΔN RdRP-3′-dGTP. (C) Co-crystal structure of QDE-1ΔN with a 14 nt DNA template, 6 nt RNA primer, 3′-dGTP and cations, designated QDE-1ΔN DdRP-3′-dGTP. (D) Co-crystal structure of QDE-1ΔN with a 12 nt DNA template, ATP, 3′-dGTP and cations, designated QDE-1ΔN DdRP-no primer. (E) Structural comparison between the open (O) and closed (C) molecules of the QDE-1ΔN dimer in the DdRP-3′-dGTP co-crystal structure. The DNA–RNA hybrid bound by the closed QDE-1ΔN molecule is colored in red and blue, whereas it is colored in gray in the open QDE-1ΔN molecule. Vector length correlates with the domain translation scale. (F) The closed QDE-1ΔN molecule and the bound RNA–RNA duplex in the RdRP-3′-dGTP co-crystal structure. The QDE-1ΔN molecule is represented as a surface, and the RNA–RNA duplex is represented as a cartoon. (G) The closed QDE-1ΔN molecule and the bound DNA–RNA hybrid in the DdRP-3′-dGTP co-crystal structure. The QDE-1ΔN molecule is represented as a surface, and the DNA–RNA hybrid is represented as a cartoon. (H) The open QDE-1ΔN molecule and the bound DNA–RNA hybrid in the DdRP-3′-dGTP co-crystal structure. The QDE-1ΔN molecule is represented as a surface, and the DNA–RNA hybrid is represented as a cartoon. In (B–D), sequences of the visible template strand, product strand and NTP analog are illustrated at the top of the structure. The nucleotide at the addition site is denoted +1, and the upstream and downstream nucleotides are labeled with negative and positive numbers, respectively. The RNA and DNA template strands are colored in magenta and red, respectively; the primer strands are colored in slate and blue in the RdRP and DdRP complex structures, respectively. The newly incorporated nucleotides and the cations are colored in lemon and green, respectively. The NTP analog is violet–purple. These colors were used throughout the paper unless specifically annotated.
Figure 2.
Figure 2.
Structures of the catalytic center of QDE-1ΔN-bound RdRP and DdRP substrates in elongation states. (A and B) The core architecture of the catalytic center of QDE-1ΔN-bound RdRP and DdRP substrates in the RdRP-3′-dGTP-EC-C and DdRP-3′-dGTP-EC-C structures, respectively. The core architecture consists of four subdomains: DPBB1 (light teal), DPBB2 (dark orange), BH (sage green) and TL (purple–blue). (C and D) Schematic representation of nucleic acid and cation recognition by the closed QDE-1ΔN molecule in the RdRP-3′-dGTP and DdRP-3′-dGTP structures, respectively. (E and F) The slow annealing composite omit electron density maps of the RNA–RNA duplexes or DNA–RNA hybrids captured in the QDE-1ΔN complex structures. The maps are all contoured at the 1.0 σ level. Sequences of the DNA–RNA hybrid and RNA–RNA duplex are provided at the top of the panels. (G) Superposition of the DNA–RNA hybrid and RNA–RNA duplex captured by the DdRP-3′-dGTP-EC-C and RdRP-3′-dGTP-EC-C structures. (H) Superposition of RNA–RNA duplexes captured by the RdRP-3′-dGTP-EC-C (magenta and light blue) and RdRP-AMPNPP-EC-C (green and yellow) structures.
Figure 3.
Figure 3.
Structures of the catalytic center of QDE-1ΔN-bound RdRP and DdRP substrates in de novo initiation states. (A and B) The core architecture of the catalytic center of QDE-1ΔN-bound RNA template paired with two nucleotides (3′-dGTP) for the first step of condensation and DNA template paired with a 4 nt product (5′-AAAdG-3′) and 3′-dGTP in the RdRP-3′-dGTP-IC-O and DdRP-no primer-IC-C structures, respectively. Colors are the same as in Figure 2A and B. (C and D) Schematic representation of nucleic acid and cation recognition by the open QDE-1ΔN molecule in the RdRP-3′-dGTP and the closed QDE-1ΔN molecule in the DdRP-no primer structures, respectively. (E) The slow annealing composite omit electron density maps of RNA-3′-dGTP captured in the open QDE-1ΔN molecule in the RdRP-3′-dGTP structure. The map is contoured at the 1.0 σ level. The sequence is provided at the top of the panel. (F) The slow annealing composite omit electron density maps of the DNA–RNA hybrid captured in the closed QDE-1ΔN molecule in the DdRP-no primer structure. The map is contoured at the 1.0 σ level. The sequence is provided at the top of the panel. (G) Superposition of RNA-3′-dGTP (green and violet–purple) and RNA–RNA (magenta and light blue) duplexes captured by the open and closed QDE-1ΔN molecules in the RdRP-3′-dGTP structure. (H) Superposition of DNA–RNA hybrids captured by the closed QDE-1ΔN molecules in the DdRP-3′-dGTP (red and blue) and DdRP-no primer (cyan and lemon) structures.
Figure 4.
Figure 4.
The detailed structures of template recognition by the DPBB2 subdomain and BH in DdRP and RdRP elongation states. (A and B) The RNA and DNA template strands are aligned by BH and DPBB2 subdomains in the closed QDE-1ΔN molecules in the RdRP-3′-dGTP and DdRP-3′-dGTP structures, respectively. (C and D) Interactions between the template entrance site nucleotides and the BH subdomain of QDE-1ΔN in the RdRP-3′-dGTP-EC-C and DdRP-3′-dGTP-EC-C structures. (E and F) The normalized Kobs showing the impacts of mutations at the template entrance site and the template-binding cleft of QDE-1ΔN. The data represent the mean of three independent experiments, with SD values indicated by error bars. (G and H) Interactions between QDE-1ΔN and the 3′-end nucleotides of the template in the RdRP-3′-dGTP-EC-C structure and the DdRP-3′-dGTP-EC-C structure. (I) Superposition showing the conformational change between the 3′-end nucleotides of the RNA template and DNA template and the rigid BH subdomain of QDE-1.
Figure 5.
Figure 5.
Detailed structures of the NTP analog and product strand recognition by the DPBB1 and TL subdomains. (A) Interactions between the RNA product and the DPBB1 and D1AH subdomains of QDE-1 in the RdRP-3′-dGTP-EC-C structure (left) and the DdRP-3′-dGTP-EC-C structure (right). (B) Interactions between the RNA product and the DPBB1 and D1AH subdomains in the S. cerevisiae Pol II transcription EC structure. (C) The normalized Kobs showing the impacts of mutations at the DPBB1, D1AH and slab subdomains of QDE-1ΔN. The data represent the mean ± SD of three independent experiments. (D) Interactions between NTP and the TL subdomain of QDE-1ΔN in the RdRP-3′-dGTP-EC-C structure (left) and the DdRP-3′-dGTP-EC-C structure (right). (E) Interactions between the NTP analog and the TL subdomain of QDE-1ΔN in the RdRP-AMPNPP-EC-C structure (left) and the DdRP-AMPNPP-EC-C structure (right). (F) Interactions between the NTP analog and the Pol II TL subdomain in the S. cerevisiae Pol II transcription EC structure. (G) Superposition of four S. cerevisiae Pol II EC structures showing the multiple conformations of the TL subdomain of Pol II. (H) Superposition of apo-QDE-1ΔN and two QDE-1ΔN complex structures showing the relatively rigid conformation of the TL subdomain of QDE-1. (I) The normalized Kobs showing the impacts of mutations at the TL subdomain of QDE-1ΔN. The data represent the mean ± SD of three independent experiments.
Figure 6.
Figure 6.
The recognition of NTP at the A site by the Pro-Gate loop and multiple cation binding in the catalytic center of QDE-1ΔN. (A) Stick–dot–dash representation showing the conformation, relative orientation and interactions between 3′-dGTP and the Pro-Gate loop in the initiation state structure. (B) Stick–dot representation showing the shape-complementarity of the Pro-Gate loop and AMPNPP in the elongation state structure. (C) Superposition showing the conformational changes of the Pro-Gate loop during the initiation to elongation state transition. The elongation state complex is colored pale green. (D) Conformation of the catalytic residues and their coordination with cations (Mg2+ in green, Ca2+ in cyan) at the active sites of the RdRP-AMPNPP-EC-C and DdRP-AMPNPP-EC-C structures, representing the elongation state of the reaction. (E) Cation coordination at the active sites of the closed QDE-1ΔN molecule in the DdRP-no primer structure, representing the de novo initiation state of the reaction. (F) Cation (Mg2+ in green, Ca2+ in cyan) coordination at the active sites of the open QDE-1ΔN molecule in the RdRP-3′-dGTP structure, representing the de novo initiation state of the reaction. (G) Summarized catalytic site assembly of QDE-1ΔN and the proposed catalytic mechanism for QDE-1. (H) The normalized Kobs showing the impacts of mutations of the NTP-interacting residues of QDE-1ΔN. The data represent the mean ± SD of three independent experiments.
Figure 7.
Figure 7.
The C-tail occupied the substrate-binding cleft of QDE-1ΔN in de novo initiation states. (A and B) Cartoon presentation and slow annealing composite omit maps of the QDE-1 C-tail observed in the DdRP-no primer-NTP loading-O structure. (C) Cartoon-stick presentations of the C-tail, RNA template and 3′-dGTP observed in the RdRP-3′-dGTP-IC-O structure. (D) The slow annealing composite omit maps of the QDE-1 C-tail observed in the RdRP-3′-dGTP-IC-O structure. (E) Cartoon and stick representations of the C-tail, DNA template and RNA product observed in the DdRP-no primer-IC-C structure. (F) The slow annealing composite omit maps of the QDE-1 C-tail observed in the DdRP-no primer-IC-C structure. (G) De novo RNA synthesis using the 15 nt DNA as a template (0.2 μM). The reaction was carried out in the presence of 20 μM ATP, GTP and 3′-dCTP spiked with γ-[32P]ATP. The reaction was quenched at 60 min. The gels were exposed to a phosphor screen overnight and scanned on a Typhoon FLA 9000. (H) Abortive to runoff ratio on the 15 nt DNA. Error bars are from three measurements. (I) Analysis of primer-extension products by a 20% polyacrylamide–7 M urea denaturing gel. The target products are indicated by green boxes, whereas the misincorporated products are indicated by red boxes. All electron density maps are contoured at the 1.0 σ level.
Figure 8.
Figure 8.
Cartoon model summarizing the dynamic conformational change of the QDE-1 C-tail in different reaction states. Both QDE-1ΔN protomers are functional and undergo identical conformational changes. For clarity, conformational changes are only shown for one protomer in the figure.

Similar articles

Cited by

References

    1. Martienssen R., Moazed D. RNAi and heterochromatin assembly. Cold Spring Harb. Perspect. Biol. 2015; 7:a019323. - PMC - PubMed
    1. Chang S.S., Zhang Z., Liu Y.. RNA interference pathways in fungi: mechanisms and functions. Annu. Rev. Microbiol. 2012; 66:305–323. - PMC - PubMed
    1. Wendte J.M., Pikaard C.S.. The RNAs of RNA-directed DNA methylation. Biochim. Biophys. Acta. 2017; 1860:140–148. - PMC - PubMed
    1. Cogoni C., Macino G.. Gene silencing in Neurospora crassa requires a protein homologous to RNA-dependent RNA polymerase. Nature. 1999; 399:166–169. - PubMed
    1. Dalmay T., Hamilton A., Rudd S., Angell S., Baulcombe D.C.. An RNA-dependent RNA polymerase gene in Arabidopsis is required for posttranscriptional gene silencing mediated by a transgene but not by a virus. Cell. 2000; 101:543–553. - PubMed

Publication types

MeSH terms