Review
. 2023 Feb;306(2):e221806.
doi: 10.1148/radiol.221806. Epub 2022 Aug 30.

Long-term Lung Abnormalities Associated with COVID-19 Pneumonia

Affiliations
Review

Long-term Lung Abnormalities Associated with COVID-19 Pneumonia

Jeffrey P Kanne et al. Radiology. 2023 Feb.

Abstract

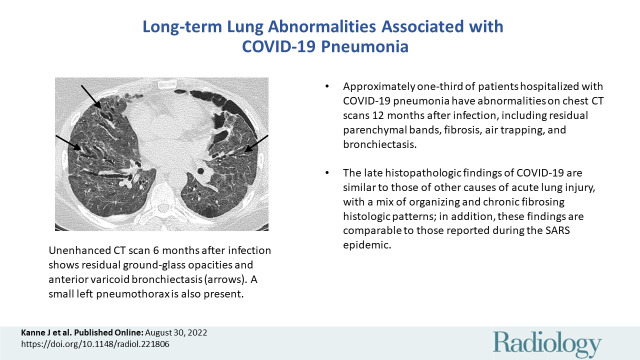
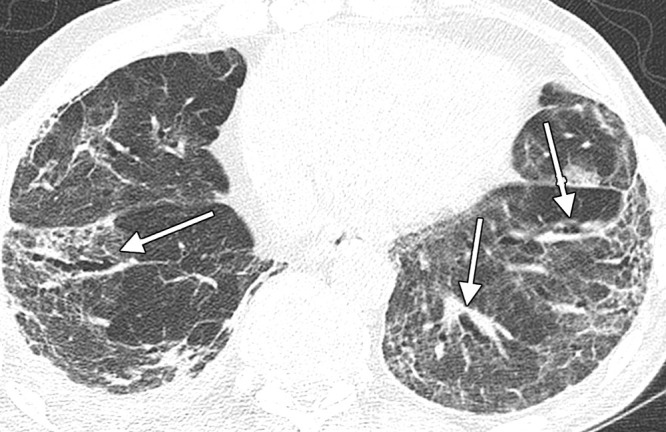
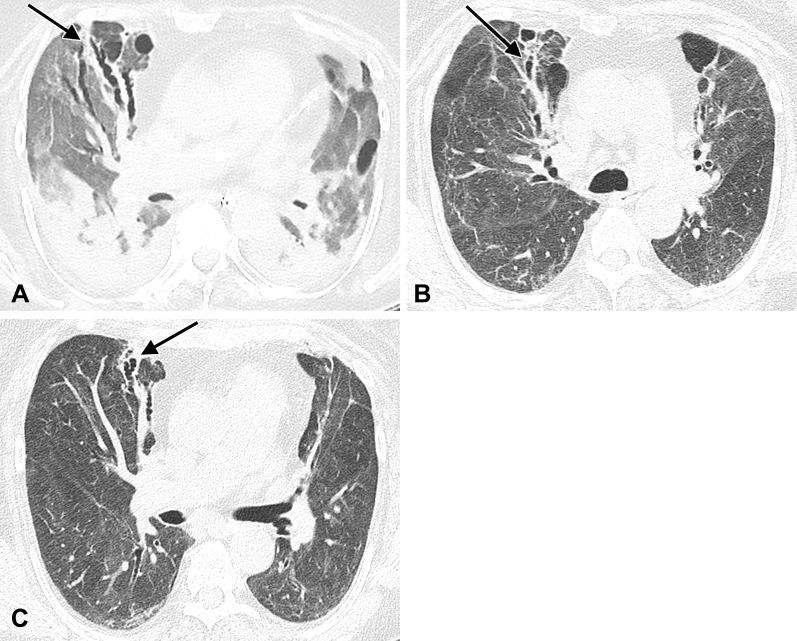
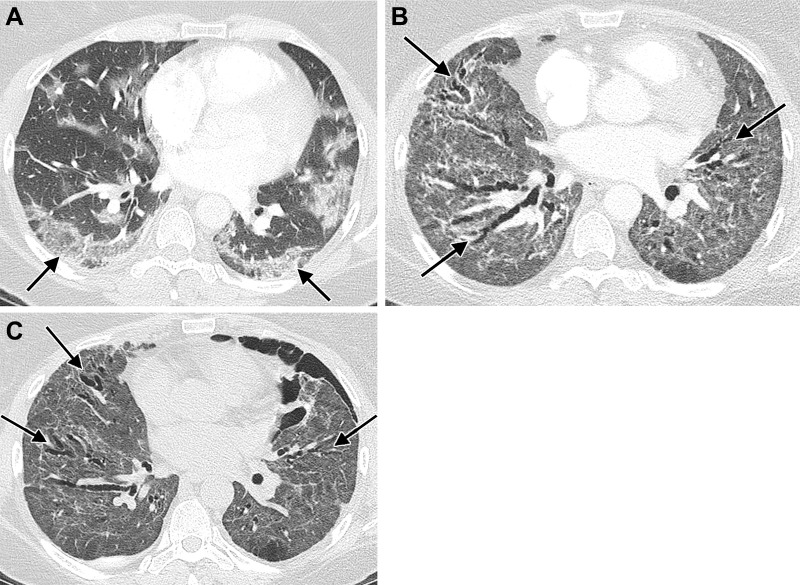
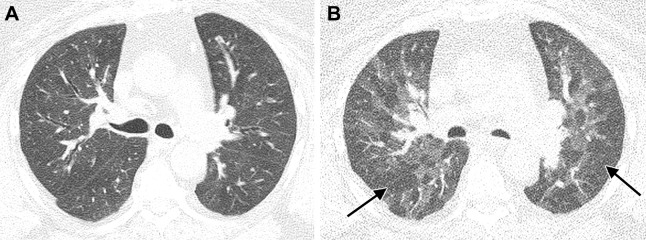
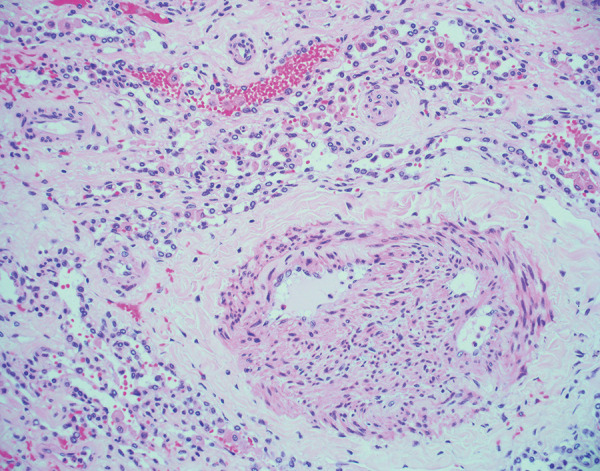
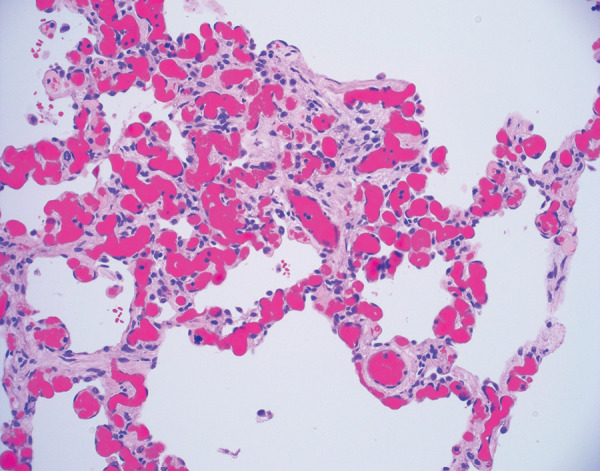
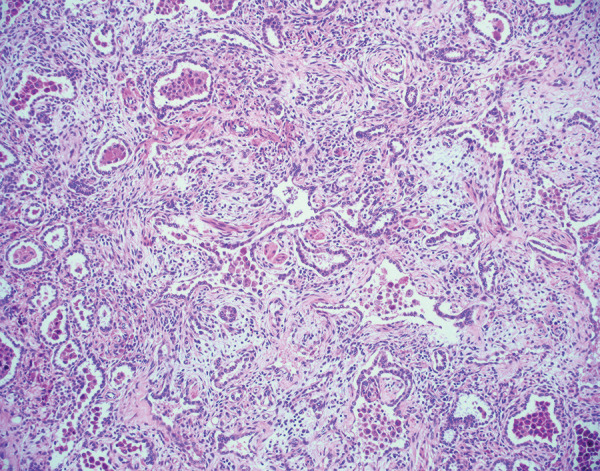
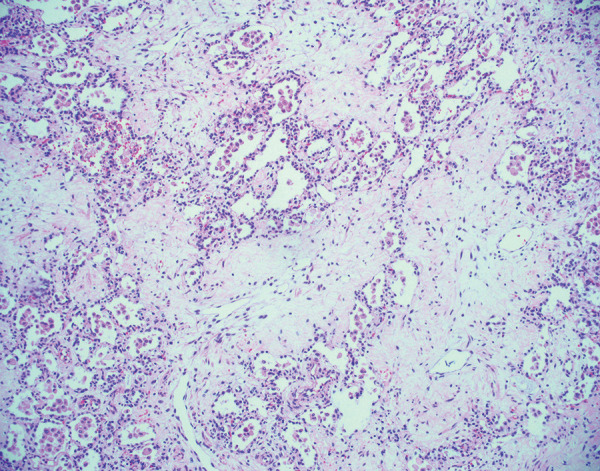
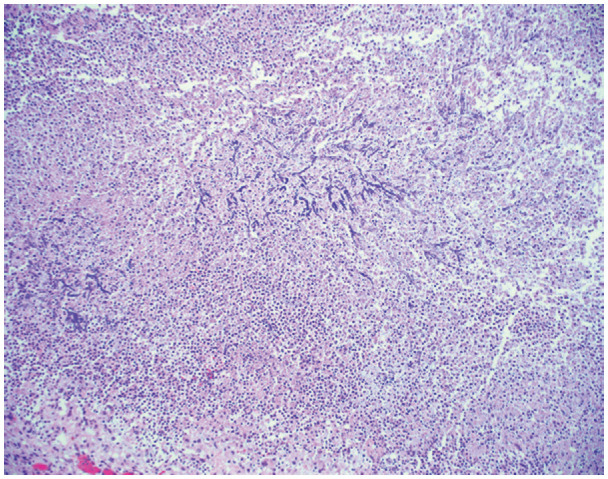
In the 3rd year of the SARS-CoV-2 pandemic, much has been learned about the long-term effects of COVID-19 pneumonia on the lungs. Approximately one-third of patients with moderate-to-severe pneumonia, especially those requiring intensive care therapy or mechanical ventilation, have residual abnormalities at chest CT 1 year after presentation. Abnormalities range from parenchymal bands to bronchial dilation to frank fibrosis. Less is known about the long-term pulmonary vascular sequelae, but there appears to be a persistent, increased risk of venothromboembolic events in a small cohort of patients. Finally, the associated histologic abnormalities resulting from SARS-CoV-2 infection are similar to those seen in patients with other causes of acute lung injury.


Conflict of interest statement

Disclosures of conflicts of interest: J.P.K. No relevant relationships. B.P.L. No relevant relationships. J.J.S. No relevant relationships. A.H. No relevant relationships. L.B.H. No relevant relationships.

Figures

None
Graphical abstract
Images in a 63-year-old man with residual lung abnormalities from
SARS-CoV-2 infection. (A) Contrast-enhanced axial CT image at presentation shows
peripheral and peribronchial ground-glass opacity and consolidation along with
perilobular thickening (arrows). (B) Unenhanced axial CT image 1 year later
shows patchy residual ground-glass opacity, persistent perilobular thickening
(arrows), and mild bronchial dilation (arrowheads) in areas of ground-glass
opacity.
Figure 1:
Images in a 63-year-old man with residual lung abnormalities from SARS-CoV-2 infection. (A) Contrast-enhanced axial CT image at presentation shows peripheral and peribronchial ground-glass opacity and consolidation along with perilobular thickening (arrows). (B) Unenhanced axial CT image 1 year later shows patchy residual ground-glass opacity, persistent perilobular thickening (arrows), and mild bronchial dilation (arrowheads) in areas of ground-glass opacity.
Images in a 57-year-old man with fibrosis resulting from SARS-CoV-2
infection. (A) Contrast-enhanced axial CT image at presentation shows peripheral
predominant ground-glass opacity with a small amount of consolidation. (B)
Unenhanced axial CT image 3 months later shows marked clearing of ground-glass
opacity but development of reticulation and mild bronchial dilation (arrow). (C)
Unenhanced axial CT image 6 months after infection shows further decrease of
ground-glass opacity and a lesser extent of reticulation. The area of bronchial
dilation in the left upper lobe has resolved, although there is a small
peripheral area of traction bronchiectasis (arrow).
Figure 2:
Images in a 57-year-old man with fibrosis resulting from SARS-CoV-2 infection. (A) Contrast-enhanced axial CT image at presentation shows peripheral predominant ground-glass opacity with a small amount of consolidation. (B) Unenhanced axial CT image 3 months later shows marked clearing of ground-glass opacity but development of reticulation and mild bronchial dilation (arrow). (C) Unenhanced axial CT image 6 months after infection shows further decrease of ground-glass opacity and a lesser extent of reticulation. The area of bronchial dilation in the left upper lobe has resolved, although there is a small peripheral area of traction bronchiectasis (arrow).
Images in a 56-year-old man with fibrosis resulting from SARS-CoV-2
infection. (A) Contrast-enhanced axial CT image early during infection shows
extensive ground-glass opacity with posterior and peripheral predominant
consolidation and some areas of crazy paving. (B) Unenhanced axial CT image from
10 months later shows lower lobe predominant reticulation, traction
bronchiectasis, and ground-glass opacity with lower lobe volume loss.
Figure 3:
Images in a 56-year-old man with fibrosis resulting from SARS-CoV-2 infection. (A) Contrast-enhanced axial CT image early during infection shows extensive ground-glass opacity with posterior and peripheral predominant consolidation and some areas of crazy paving. (B) Unenhanced axial CT image from 10 months later shows lower lobe predominant reticulation, traction bronchiectasis, and ground-glass opacity with lower lobe volume loss.
Image in a 74-year-old man with history of SARS-CoV-2 infection.
Unenhanced axial CT image 5 months after acute infection shows bilateral
residual peripheral ground-glass opacity and bandlike opacities. Varicoid
traction bronchiectasis and bronchiolectasis occurs within areas of
reticulation and architectural distortion, in keeping with fibrosis
(arrows).
Figure 4:
Image in a 74-year-old man with history of SARS-CoV-2 infection. Unenhanced axial CT image 5 months after acute infection shows bilateral residual peripheral ground-glass opacity and bandlike opacities. Varicoid traction bronchiectasis and bronchiolectasis occurs within areas of reticulation and architectural distortion, in keeping with fibrosis (arrows).
Images in a 77-year-old woman hospitalized with acute respiratory
distress syndrome resulting from SARS-CoV-2 infection. (A) Unenhanced axial
CT image during acute infection and mechanical ventilation shows typical
findings of alveolar damage, with dependent consolidation and ground-glass
opacity throughout the remainder of the lungs. Varicoid bronchial dilation
and an air cyst have developed within the anterior right lung (arrow). (B,
C) Unenhanced axial CT images 10 months after infection show anterior
predominant varicoid bronchiectasis (arrows), slightly decreased in severity
and accompanied by reticulation and architectural distortion. A background
of residual ground-glass opacity, peripheral parenchymal bands, and
reticulation is also present.
Figure 5:
Images in a 77-year-old woman hospitalized with acute respiratory distress syndrome resulting from SARS-CoV-2 infection. (A) Unenhanced axial CT image during acute infection and mechanical ventilation shows typical findings of alveolar damage, with dependent consolidation and ground-glass opacity throughout the remainder of the lungs. Varicoid bronchial dilation and an air cyst have developed within the anterior right lung (arrow). (B, C) Unenhanced axial CT images 10 months after infection show anterior predominant varicoid bronchiectasis (arrows), slightly decreased in severity and accompanied by reticulation and architectural distortion. A background of residual ground-glass opacity, peripheral parenchymal bands, and reticulation is also present.
Images in a 51-year-old woman with history of SARS-CoV-2 infection,
noninvasive positive pressure ventilation, and chronic dyspnea requiring
home oxygen therapy. (A) Contrast-enhanced axial CT image during acute
infection shows bilateral ground-glass opacity with peripheral predominance
(arrows). (B) Contrast-enhanced axial CT image after discharge, 2 months
after presentation, shows diffuse ground-glass opacity and architectural
distortion with diffuse varicoid bronchial dilation (arrows). (C) Unenhanced
axial CT image 6 months after presentation shows decrease in ground-glass
opacity but persistent diffuse varicoid bronchiectasis (arrows); a small
left pneumothorax is also present.
Figure 6:
Images in a 51-year-old woman with history of SARS-CoV-2 infection, noninvasive positive pressure ventilation, and chronic dyspnea requiring home oxygen therapy. (A) Contrast-enhanced axial CT image during acute infection shows bilateral ground-glass opacity with peripheral predominance (arrows). (B) Contrast-enhanced axial CT image after discharge, 2 months after presentation, shows diffuse ground-glass opacity and architectural distortion with diffuse varicoid bronchial dilation (arrows). (C) Unenhanced axial CT image 6 months after presentation shows decrease in ground-glass opacity but persistent diffuse varicoid bronchiectasis (arrows); a small left pneumothorax is also present.
Images in a 58-year-old woman with history of SARS-CoV-2 infection,
ongoing dyspnea after infection, and history of sleep apnea. (A) Unenhanced
axial CT image at full inspiration performed 2 years after acute infection
shows subtle diffuse mosaic attenuation. (B) Paired expiratory axial CT
image shows extensive lobular and regional low attenuation indicative of air
trapping (arrows).
Figure 7:
Images in a 58-year-old woman with history of SARS-CoV-2 infection, ongoing dyspnea after infection, and history of sleep apnea. (A) Unenhanced axial CT image at full inspiration performed 2 years after acute infection shows subtle diffuse mosaic attenuation. (B) Paired expiratory axial CT image shows extensive lobular and regional low attenuation indicative of air trapping (arrows).
Histologic image (hematoxylin and eosin stain, 200× magnification)
shows recanalized pulmonary arteriole with neolumen formation. This finding was
observed in an explanted lung 4 months after acute COVID-19.
Figure 8:
Histologic image (hematoxylin and eosin stain, 200× magnification) shows recanalized pulmonary arteriole with neolumen formation. This finding was observed in an explanted lung 4 months after acute COVID-19.
Histologic image (hematoxylin and eosin stain, 200×magnification)
of alveolar septa shows a vascular congestion and hemangiomatosis-like lesion.
Notice the absence of acute lung injury, inflammation, and hyaline membrane
formation. While originally described in the acute setting, this vascular
congestion and hemangiomatosis-like lesion was identified in an explanted lung
approximately 4 months after acute COVID-19 pneumonia.
Figure 9:
Histologic image (hematoxylin and eosin stain, 200× magnification) of alveolar septa shows a vascular congestion and hemangiomatosis-like lesion. Notice the absence of acute lung injury, inflammation, and hyaline membrane formation. While originally described in the acute setting, this vascular congestion and hemangiomatosis-like lesion was identified in an explanted lung approximately 4 months after acute COVID-19 pneumonia.
Histologic image (hematoxylin and eosin stain, 100× magnification)
of pulmonary parenchyma shows organizing diffuse alveolar damage. There are
residual alveolar spaces with marked increase in the interstitium by cellular
fibroblastic proliferations. Some fibroblastic proliferations are also likely
within alveoli. Type 2 pneumocyte hyperplasia is present. These findings were
observed in an explanted lung approximately 6 months after acute
COVID-19.
Figure 10:
Histologic image (hematoxylin and eosin stain, 100× magnification) of pulmonary parenchyma shows organizing diffuse alveolar damage. There are residual alveolar spaces with marked increase in the interstitium by cellular fibroblastic proliferations. Some fibroblastic proliferations are also likely within alveoli. Type 2 pneumocyte hyperplasia is present. These findings were observed in an explanted lung approximately 6 months after acute COVID-19.
Histologic image (hematoxylin and eosin stain, 100× magnification)
shows diffuse pulmonary fibrosis in an explanted lung 6 months after acute
COVID-19. There is deposition of paucicellular, eosinophilic material within the
pulmonary interstitium. Some residual alveolar spaces are present but appear
compressed. These findings have been previously described in explanted lungs and
likely represent the fibrotic phase of diffuse alveolar damage.
Figure 11:
Histologic image (hematoxylin and eosin stain, 100× magnification) shows diffuse pulmonary fibrosis in an explanted lung 6 months after acute COVID-19. There is deposition of paucicellular, eosinophilic material within the pulmonary interstitium. Some residual alveolar spaces are present but appear compressed. These findings have been previously described in explanted lungs and likely represent the fibrotic phase of diffuse alveolar damage.
Histologic image (hematoxylin and eosin stain, 100× magnification)
shows numerous fungal hyphae with acute angle branching and septations. These
fungal hyphae are favored to represent Aspergillus, but no culture data were
available. The fungi are seen in a background of marked neutrophilia, consistent
with a necrotizing abscess.
Figure 12:
Histologic image (hematoxylin and eosin stain, 100× magnification) shows numerous fungal hyphae with acute angle branching and septations. These fungal hyphae are favored to represent Aspergillus, but no culture data were available. The fungi are seen in a background of marked neutrophilia, consistent with a necrotizing abscess.

References

    1. Centers for Disease Control and Prevention . CDC SARS Response Timeline . 2013. . https://www.cdc.gov/about/history/sars/timeline.htm. Accessed June 1, 2022 .
    1. Hachmann NP , Miller J , Collier AY , et al. . Neutralization Escape by SARS-CoV-2 Omicron Subvariants BA.2.12.1, BA.4, and BA.5 . N Engl J Med 2022. ; 387 ( 1 ): 86 – 88 . - PMC - PubMed
    1. Mahase E . Covid-19: What do we know about “long covid”? BMJ 2020. ; 370 : m2815 . - PubMed
    1. Hope AA , Evering TH . Postacute Sequelae of Severe Acute Respiratory Syndrome Coronavirus 2 Infection . Infect Dis Clin North Am 2022. ; 36 ( 2 ): 379 – 395 . - PMC - PubMed
    1. Centers for Disease Control and Prevention. Long COVID or Post-COVID conditions 2022 . https://www.cdc.gov/coronavirus/2019-ncov/long-term-effects/index.html. Accessed June 27, 2022 .