. 2022 Nov 7;219(11):e20221137.
doi: 10.1084/jem.20221137. Epub 2022 Aug 30.

A "multi-omics" analysis of blood-brain barrier and synaptic dysfunction in APOE4 mice

Affiliations

A "multi-omics" analysis of blood-brain barrier and synaptic dysfunction in APOE4 mice

Giuseppe Barisano et al. J Exp Med. .

Abstract

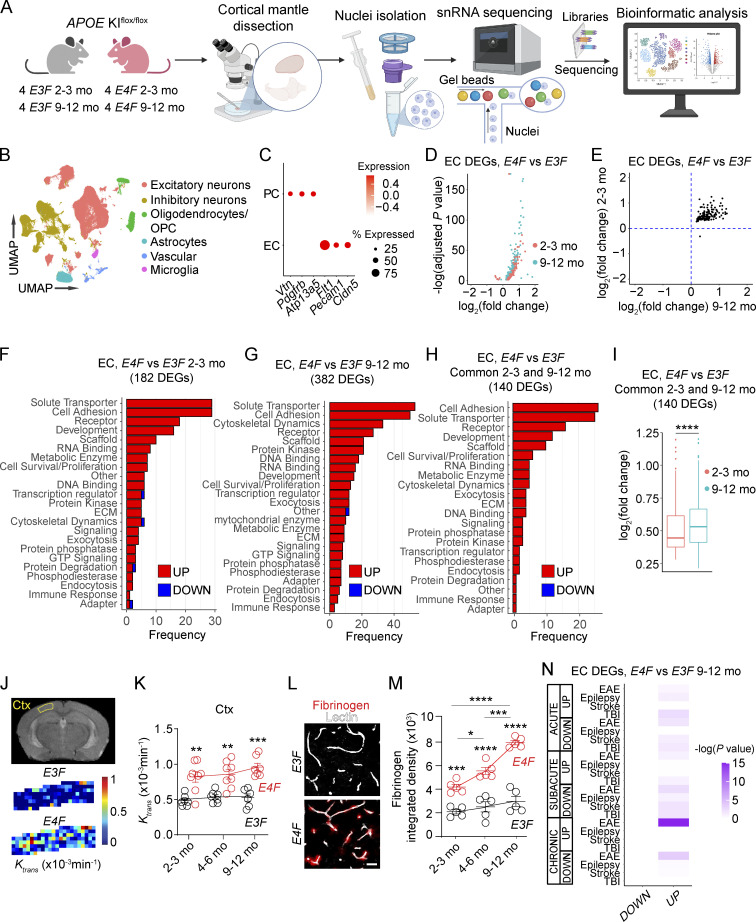
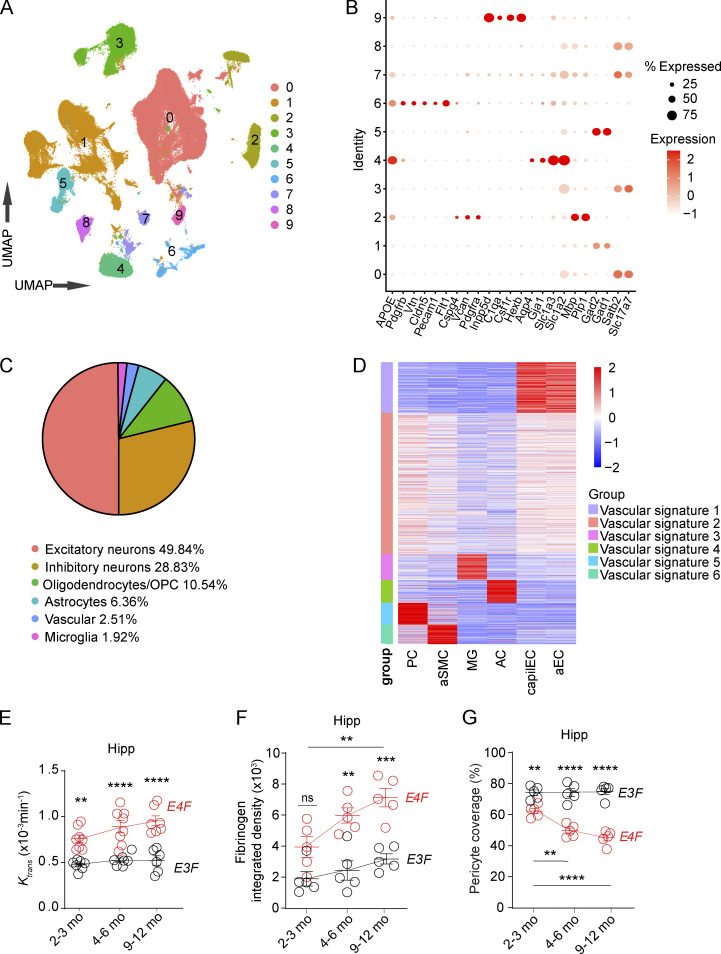
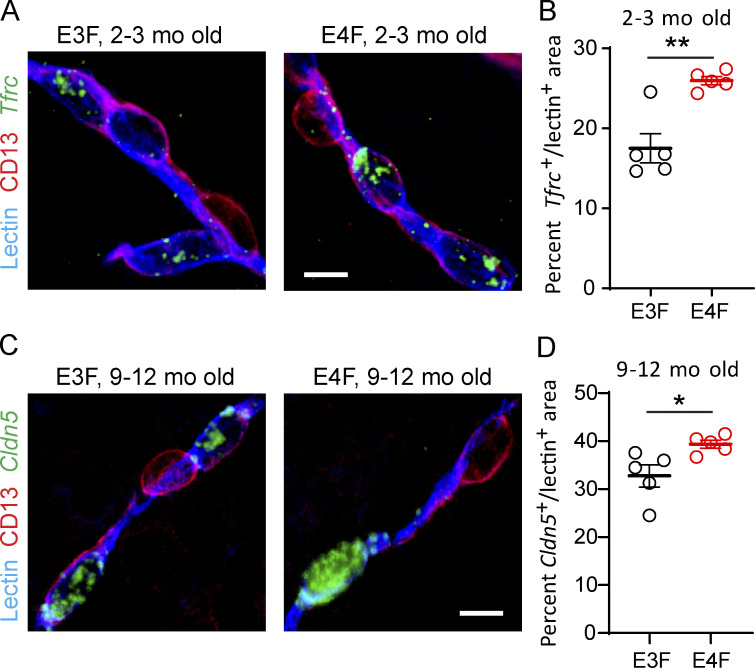
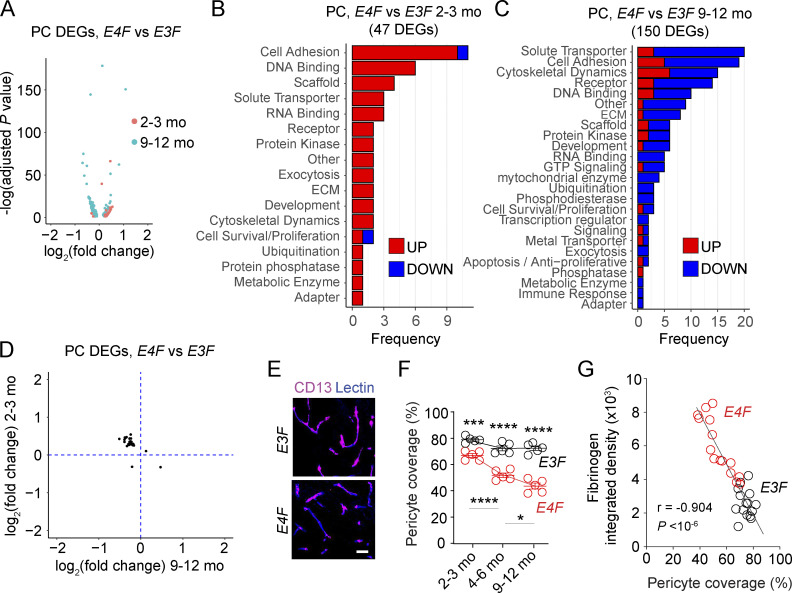
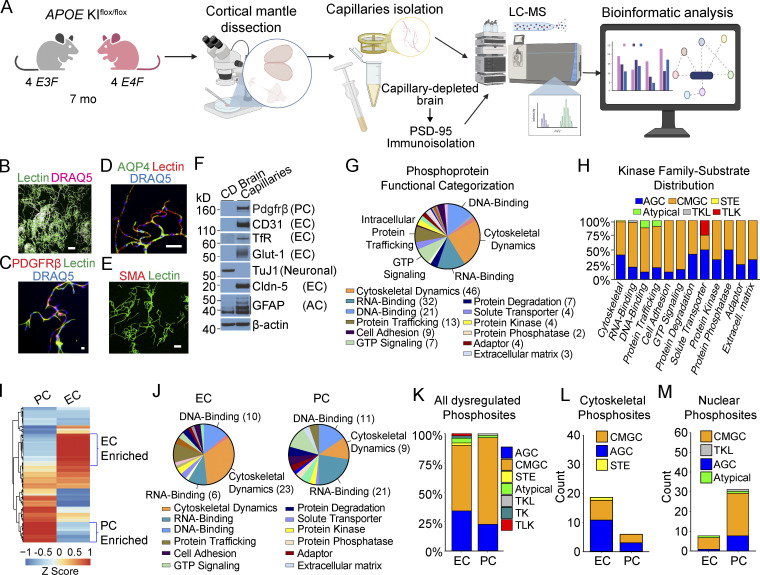
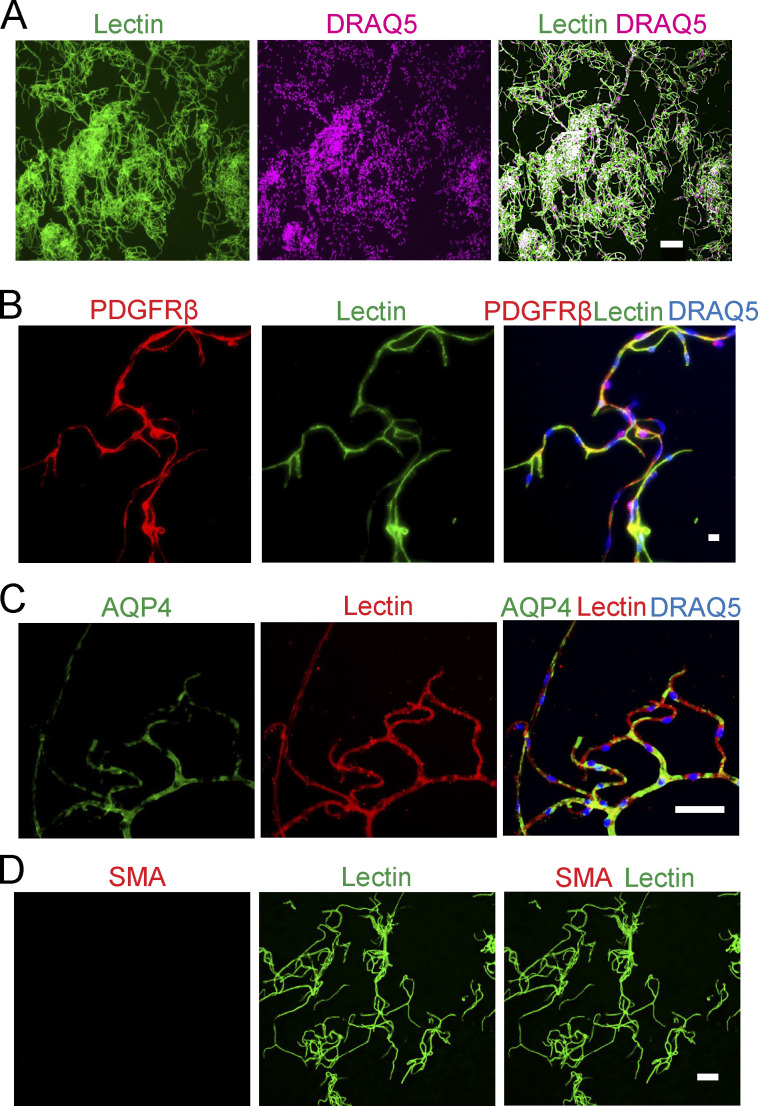
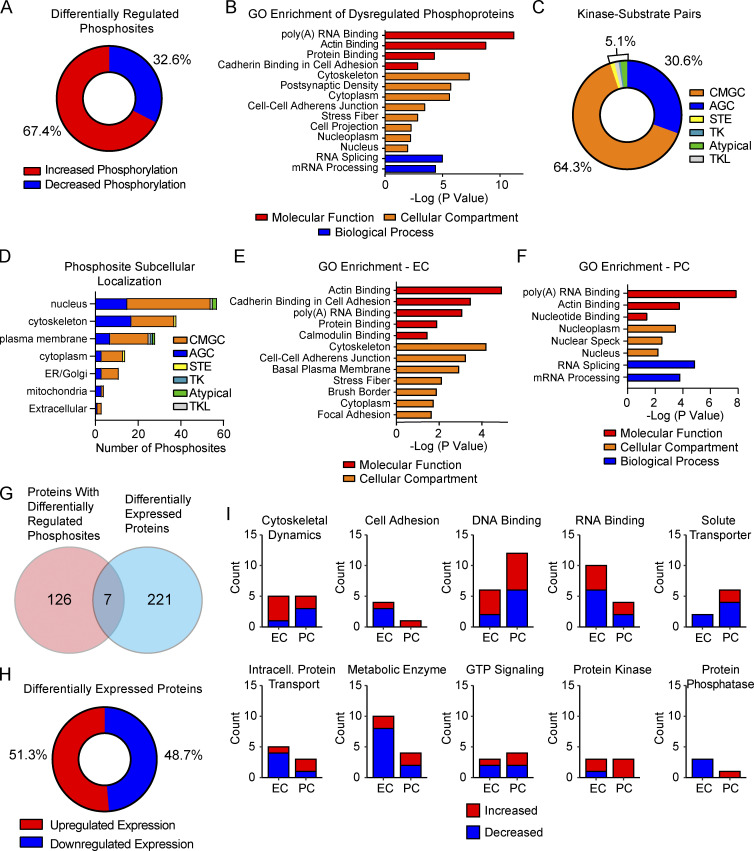
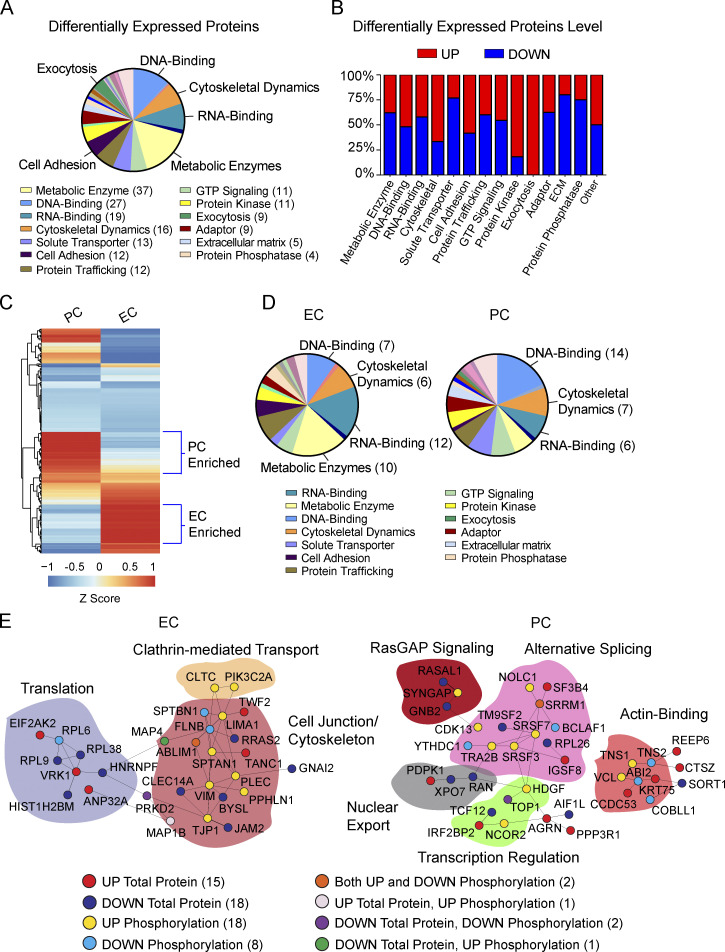
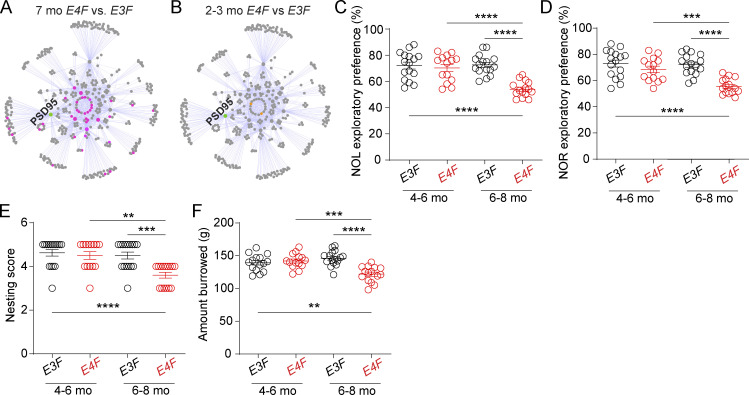
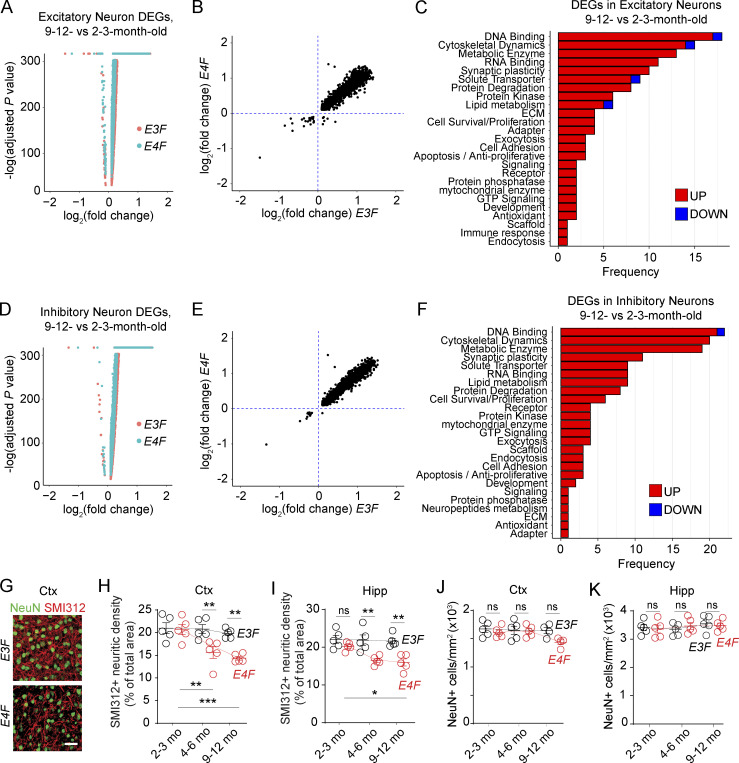
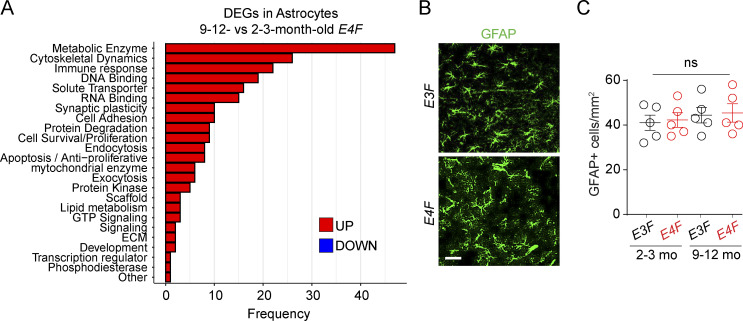
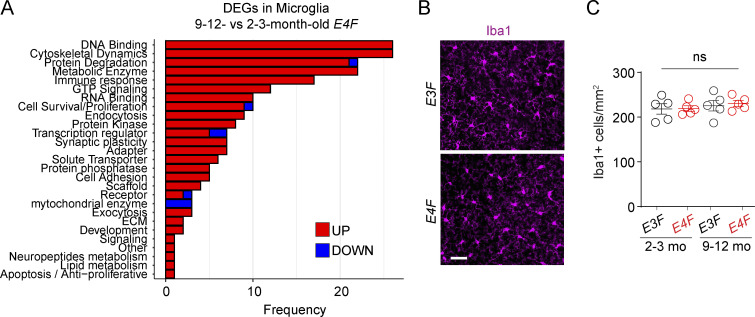
Apolipoprotein E4 (APOE4), the main susceptibility gene for Alzheimer's disease, leads to blood-brain barrier (BBB) breakdown in humans and mice. Remarkably, BBB dysfunction predicts cognitive decline and precedes synaptic deficits in APOE4 human carriers. How APOE4 affects BBB and synaptic function at a molecular level, however, remains elusive. Using single-nucleus RNA-sequencing and phosphoproteome and proteome analysis, we show that APOE4 compared with APOE3 leads to an early disruption of the BBB transcriptome in 2-3-mo-old APOE4 knock-in mice, followed by dysregulation in protein signaling networks controlling cell junctions, cytoskeleton, clathrin-mediated transport, and translation in brain endothelium, as well as transcription and RNA splicing suggestive of DNA damage in pericytes. Changes in BBB signaling mechanisms paralleled an early, progressive BBB breakdown and loss of pericytes, which preceded postsynaptic interactome disruption and behavioral deficits that developed 2-5 mo later. Thus, dysregulated signaling mechanisms in endothelium and pericytes in APOE4 mice reflect a molecular signature of a progressive BBB failure preceding changes in synaptic function and behavior.


Conflict of interest statement

Disclosures: J.K. Ichida reported personal fees from Acurastem, Modulo Bio, and Biomarin Pharmaceutical and “other” from Spinogenix and Vesalius Therapeutics outside the submitted work. No other disclosures were reported.

Figures

Figure 1.
Figure 1.
APOE4 disrupts the endothelial BBB transcriptome. (A) Schematic of nuclei isolation and sampling workflow from mouse cortex for snRNA-seq. See Materials and methods for details. (B) UMAP space representing six distinct clusters obtained via unsupervised clustering analysis and subsequent definition of each cluster based on cell type–specific cell markers. OPC, oligodendrocyte precursor cells. (C) Dot plot reporting average expression of the cell-specific markers of ECs and PCs in the vascular cluster by in silico sorting (see Fig. S1 D). (D) Volcano plot showing DEGs in ECs in 2–3-mo-old (red) and 9–12-mo-old (cyan) E4F compared with E3F mice. (E) Plot comparing the average log2 fold-change of DEGs in ECs in 2–3-mo-old (y axis) and 9–12-mo-old (x axis) E4F compared with E3F mice (n = 140 DEGs with known function according to the UniProt Knowledgebase of 158 total). (F–H) Bar charts reporting the number of DEGs in EC-encoding proteins with known function in each functional class in 2–3-mo-old (F) and 9–12-mo-old (G) E4F compared with E3F mice, and the DEGs found in common in both age groups of E4F compared with E3F mice (H). All data in B–H are from four mice per group. (I) Log2 fold-change of 140 DEGs in ECs common to both 2–3- and 9–12-mo-old E4F compared with E3F mice. Box-and-whisker plots indicating median (dark horizonal line) and interquartile range (IQR; box representing 25th to 75th percentiles), and whiskers representing IQR upper and lower limits ±1.5 IQR; significance by Wilcoxon two-tailed paired test. (J and K) BBB permeability Ktrans maps in the cortex of 2-mo-old E3F and E4F mice by DCE-MRI (J) and Ktrans values in the cortex (Ctx; K) of 2–3-, 4–6-, and 9–12-mo-old E3F and E4F mice. (L and M) Fibrinogen (red) and lectin+ endothelial profiles (white) in the cortex of 6-mo-old E3F and E4F mice (L; bar = 25 µm) and quantification of fibrinogen perivascular deposits in 2–3-, 4–6-, and 9–12-mo-old E3F and E4F mice (M). Mean ± SEM; in K, n = 8 mice per group; in M, n = 5 mice per group. Significance by one-way ANOVA (K and M) with Bonferroni post hoc test. (N) Heatmap showing overlap between DEGs in ECs from 9–12-mo-old E4F compared with E3F mice (columns of the heatmap) and DEGs in ECs from the published mouse models of acute, subacute, and chronic EAE, epilepsy, stroke, and TBI (Munji et al., 2019; rows of the heatmap). Color scale represents –log10 P value. Significance by Fisher’s exact test. *, P < 0.05; **, P < 0.01; ***, P < 0.001; ****, P < 0.0001.
Figure S1.
Figure S1.
snRNA-seq analysis and additional characterization of BBB breakdown in E4F and E3F mice. (A) UMAP space representing 10 distinct clusters obtained via unsupervised clustering analysis. (B) Dot plot reporting cell type–specific markers used to define the clusters. (C) Proportion of nuclei included in each cluster. (D) Heatmap showing average expression values of vascular cluster signature genes in selected vascular-associated cell types, including PCs, aSMCs, capillary endothelial cells (capilEC), and arterial endothelial cells (aEC), as well as microglia (MG) and astrocytes (AC) according to the mouse brain vascular atlas (Vanlandewijck et al., 2018). Nuclei included in vascular signature groups 1 (violet) and 5 (cyan) were defined as ECs and PCs, respectively. Data in A–D are from 16 mice. (E) Quantification of Ktrans values in the hippocampus (Hipp) of 2–3-, 4–6-, and 9–12-mo-old E4F and E3F mice. (F) Quantification of fibrinogen in the hippocampus of 2–3-, 4–6-, and 9–12-mo-old E4F and E3F mice. (G) Quantification of PC coverage in the hippocampus of 2–3-, 4–6-, and to 9–12-mo-old E4F and E3F mice. Mean ± SEM. n = 6-8 mice per group (E); n = 4–5 mice per group (F and G). Significance by one-way ANOVA with Bonferroni post hoc test. **, P < 0.01; ***, P < 0.001; ****, P < 0.0001. OPC, oligodendrocyte precursor cells.
Figure S2.
Figure S2.
Validation of snRNA-seq endothelial DEGs by FISH in E4F compared with E3F mice. (A and B) Representative FISH of Tfrc (green) in lectin+ endothelial profiles (blue), but not in CD13+ PCs (magenta) in the cortex of 2–3-mo-old E3F and E4F mice (A, bar = 10 µm), and quantification of percentage lectin+ area colabeled with Tfrc in 2–3-mo-old E3F and E4F mice (B). The percentage increase in Tfrc+ lectin+ area by FISH in E4F compared with E3F mice was 48%, and the Tfrc log2(fold-change) = 0.598 for E4F compared with E3F mice by RNA-seq analysis (see Table S1 A). (C and D) Representative FISH of Cldn5 (claudin 5; green) in lectin+ endothelial profiles (blue), but not in CD13+ PCs (magenta) in the cortex of 9–12-mo-old E3F and E4F mice (C; bar = 10 µm), and quantification of percentage lectin+ area colabeled with Cldn5 in 9–12-mo-old E3F and E4F mice (D). The percentage increase in Cldn5+ lectin+ area by FISH in E4F compared with E3F mice was 20%, and the Cldn5 log2(fold-change) = 0.295 for E4F compared with E3F mice by RNA-seq analysis (see Table S1 B). In B and D, mean ± SEM, n = 5 mice; significance by unpaired t test. *, P < 0.05; **, P < 0.01.
Figure 2.
Figure 2.
APOE4 disrupts the PC transcriptome. (A) Volcano plot showing DEGs in PCs of 2–3-mo-old (red) and 9–12-mo-old (cyan) E4F compared with E3F mice. (B and C) Bar charts reporting the number of DEGs in PCs encoding proteins with known function in each functional class of 2–3-mo-old (B) and 9–12-mo-old (C) E4F compared with E3F mice. (D) Plot comparing the average log2 fold-change of DEGs in PCs of 2–3-mo-old (y axis) and 9–12-mo-old (x axis) E4F compared with E3F mice (n = 25 DEGs). All data in A–D are from four mice per group. (E and F) CD13+ PC coverage (magenta) of lectin+ endothelial profiles (blue) in the cortex (E; bar = 25 µm), and quantification of PC coverage in 2–3-, 4–6-, and 9–12-mo-old E3F and E4F mice (F). (G) Correlation between PC vascular coverage and extravascular fibrinogen deposits in cortex. n = 30 mice. In F, mean ± SEM; significance by one-way ANOVA with Bonferroni post hoc test; n = 5 mice per group. In G, significance by Pearson correlation. *, P < 0.05; ***, P < 0.001; ****, P < 0.0001. ECM, extracellular matrix.
Figure 3.
Figure 3.
APOE4 leads to phosphosite dysregulation at the BBB. (A) Schematic of brain capillary isolation workflow from mouse cortex for phosphoproteome and proteome study. CD brain is prepared for postsynaptic PSD-95 immunoprecipitation assays. See Materials and methods for details. (B–E) Isolated brain capillaries stained for lectin+-endothelium (B), green; DRAQ5 nuclear stain, pink; bar, 100 µm; Pdgfrβ+-PCs (C); Pdgfrβ, red; lectin+-endothelium, green; DRAQ5, blue; bar, 10 µm; and aquaporin 4 (AQP4)+-astrocyte end feet (D); AQP4, green; lectin+-endothelium, red; DRAQ5, blue; bar, 50 µm; but did not stain for smooth muscle cell marker SMA (E); SMA, red; lectin+-endothelium, green; bar, 50 µm (see also Fig. S3). (F) Immunoblotting of brain capillaries and CD brain for the PC marker Pdgfrβ; endothelial markers CD31, TfR, Glut-1, and Claudin-5; neuronal marker, TuJ1; and astrocyte marker, GFAP. (G) Distribution of functional groups for all nonredundant proteins with differentially regulated phosphosites in brain capillaries from E4F compared with E3F mice at 7 mo of age. Legend shows abundant functional groups with number of proteins with dysregulated phosphosites per functional group indicated. The genes encoding proteins with differentially regulated phosphosites in ECs, PCs, and astrocyte end feet are given in Table S1 H. (H) Distribution of substrate-kinase family pairs among differentially regulated phosphosites in abundant functional groups including cytoskeletal proteins, DNA- and RNA-binding proteins, cell adhesions, and others. Blue, AGC (PKA, PKG, and PKC); orange, CMGC (cyclin-dependent kinases, mitogen-activated protein kinase, glycogen synthase kinase, and CDC-like kinase); yellow, STE (serine/threonine kinases); green, atypical kinases; gray, TKL (tyrosine kinase–like kinases); red, TLK (tousled-like kinase). (I) Heatmap showing hierarchical clustering of single-cell RNA-seq gene expression for all nonredundant proteins found to contain differentially regulated phosphosites in brain capillary ECs and PCs. Proteins showing preferential cell-type enrichment in either ECs or PCs are highlighted by blue brackets. The z-scores of proteins with dysregulated phosphosites in ECs and PCs are reported in Table S1 J. (J) Distribution of functional groups within ECs and PCs assigned to nonredundant proteins found to contain differentially regulated phosphosites. Legend shows abundant functional groups. The number of proteins with dysregulated phosphosites for the most abundant functional groups in the EC and PC pie charts are indicated. Proteins assigned to astrocyte end feet are excluded from analysis. (K–M) Plots showing the percentage of all differentially regulated phosphosites (K), differentially regulated phosphosites within cytoskeletal proteins (L), or within nuclear proteins (M) predicted to be regulated by the indicated kinase family separated by assigned cell type as ECs and PCs. Color code for different kinases as in H, plus turquoise, TK (tyrosine kinase). All data in G–M are from four mice per group. Source data are available for this figure: SourceData F3.
Figure S3.
Figure S3.
Cellular composition of isolated mouse brain capillaries. (A–D) Isolated brain capillaries stained for lectin+-endothelium (A; lectin, green; DRAQ5 nuclear stain, pink; bar, 100 µm), Pdgfrβ+-PCs (B; Pdgfrβ, red; lectin+-endothelium, green; DRAQ5, blue; bar, 10 µm), and AQP4+-astrocyte end feet (C, AQP4, green, lectin+-endothelium, red; DRAQ5, blue; bar, 50 µm) and did not stain for smooth muscle cell marker SMA (D, lectin, green; SMA, red; bar, 50 µm).
Figure S4.
Figure S4.
Dysregulated phosphosites and protein levels in brain capillaries of E4F compared with E3F mice. (A) Pie chart showing distribution of phosphosites with either increased or decreased levels of phosphorylation in brain capillaries from 7-mo-old E4F compared with E3F mice. (B) GO enrichment analysis of all nonredundant proteins with differentially regulated phosphosites. Enrichment is classified by terms indicating molecular function (red), cellular component (orange), and biological process (blue). (C) Pie chart showing distribution of predicted kinase family-substrate pairs for all dysregulated phosphosites in brain capillaries from 7-mo-old E4F compared with E3F mice. (D) Distribution of predicted kinase family-substrate pairs for all dysregulated phosphosites by subcellular location. Abbreviations for protein kinase families in C and D are the same as in main Fig. 3, H and K. (E and F) GO enrichment of all nonredundant proteins regulated by phosphorylation and assigned to specific cellular components of the BBB, including ECs and PCs. Enrichment is classified by terms indicating molecular function, cellular component, and biological process as in B. (G) Venn diagram showing the number of proteins overlapping between proteins found to contain differentially regulated phosphosites and proteins found to be differentially expressed in brain capillaries from 7-mo-old E4F compared with E3F mice. (H) Pie chart showing distribution of proteins found to have either increased or decreased levels in E4F compared with E3F mice. (I) Graphs showing functional categories of differentially expressed proteins separated by direction of regulation and assigned cell type as ECs or PCs. All data in are from four mice per group. All reported P values are adjusted using the Bonferroni correction for multiple comparisons.
Figure 4.
Figure 4.
APOE4 alters protein levels at the BBB. (A) Distribution of functional groups for all proteins found to be differentially expressed in brain capillaries from E4F compared with E3F mice at 7 mo of age. Legend shows abundant functional groups with number of differentially expressed proteins per functional group indicated. (B) Percentage distribution of upregulated and downregulated proteins within abundant functional groups found to be differentially regulated. (C) Heatmap showing hierarchical clustering of single-cell RNA-seq gene expression for all proteins found to be differentially regulated in brain capillary ECs and PCs. Proteins showing preferential cell-type enrichment are assigned to either ECs or PCs as highlighted by blue brackets. The gene names encoding differentially expressed proteins assigned to ECs, PCs, or astrocyte end feet are given in Table S1 L. z-Scores for proteins enriched in ECs and PCs are reported in Table S1 M. (D) Distribution of functional groups within brain capillary ECs and PCs assigned to differentially expressed proteins. Legend shows abundant functional groups with the number of differentially expressed proteins for the most abundant functional groups in the EC and PC pie charts indicated. Proteins assigned to astrocyte end feet are excluded from analysis. All data in A–D are from four mice per group. (E) PPIs extracted from BioGRID data are assigned to proteins regulated by either phosphorylation or expression within brain capillary ECs and PCs and converge on common cellular processes. Proteins were clustered according to their involvement in particular cellular processes, demarcated by the colored regions. Each node represents a single dysregulated protein by either phosphorylation and/or expression level within the disrupted PPI signaling network in ECs and PCs. The color-coded legend shows direction (up or down) and type of dysregulation (phosphorylation or protein level), with the number of dysregulated proteins indicated. For full description of dysregulated PPI signaling networks in ECs and PCs, see the main text. ECM, extracellular matrix.
Figure 5.
Figure 5.
APOE4 effects on synaptic interactome and behavior. (A and B) PSD95 protein interactors (PSD95 interactome) determined in four replicates from the cortex. (A) Disrupted PSD95 PPI networks in 7-mo-old E4F compared with E3F mice. Affected protein interactors localized within highly connected nodes of the PPI. (B) PPIs networks in 2–3-mo-old E4F compared with E3F mice. In A and B, green, PSD95 node; gray, no detected changes in PSD95 PPI ratios; pink (A) or orange (B), impaired PSD95 PPI ratios. The PSD PPI network was constructed by immunoisolation and mass spectrometry analysis of Shank3, Syngap1, Homer1, Cyfip1, Cyfip2, Cnksr2, Nckap1, TNiK, Fmr1, Tsc1, and Dlgap1 nodes. In A and B, all measurements were performed simultaneously in four biological replicates per genotype and age. For full description of dysregulated PPI networks, see the main text and Table S1, N–P. (C–F) Novel object location (NOL; C) novel object recognition (NOR; D), nesting (E), and burrowing (F) in 4–6- and 6–8-mo-old E3F and E4F mice. Mean ± SEM. In C–F, n = 14–16 mice per group. Significance by one-way ANOVA with Bonferroni post hoc test (C–F). **, P < 0.01; ****, P < 0.0001.
Figure 6.
Figure 6.
APOE4 effects on neuronal transcriptome and neuritic density. (A) Volcano plot showing the DEGs identified in excitatory neurons of E3F (red) and E4F (cyan) mice at 9–12 vs. 2–3 mo of age. (B) Plots comparing the average log2 fold-change of the common DEGs identified in excitatory neurons of both E3F (x axis) and E4F (y axis) mice (9–12- vs. 2–3-mo-old mice). (C) Bar charts reporting the number of DEGs encoding for proteins with known function in each functional class, as exclusively identified in excitatory neurons of 9–12- vs. 2–3-mo-old E4F mice only (134 DEGs), but not in 9–12- vs. 2–3-mo-old E3F mice. (D) Volcano plot showing the DEGs identified in inhibitory neurons of E3F (red) and E4F (cyan) mice at 9–12 vs. 2–3 mo of age. (E) Plots comparing the average log2 fold-change of the common DEGs identified in inhibitory neurons of both E3F (x axis) and E4F (y axis) mice (9–12 vs. 2–3 mo of age). (F) Bar charts reporting the number of DEGs encoding for proteins with known function in each functional class, as exclusively identified in inhibitory neurons of 9–12- vs. 2–3-mo-old E4F mice only (153 DEGs), but not in 9–12- vs. 2–3-mo-old E3F mice. All data are from four mice per group. (G–K) SMI312+ neurofilaments (red) and NeuN+ neurons (green) in the cortex (Ctx) of 9-mo-old E3F and E4F mice (G; bar = 30 µm) and quantification of SMI-312+ neurites (H and I) and NeuN+ neuronal cell bodies (J and K) in the cortex (H and J) and hippocampus (Hipp; I and K) in 2–3-, 4–6-, and to 9–12-mo-old E4F and E3F mice. Data in H–K, mean ± SEM, n = 4–5 mice per group; significance by one-way ANOVA with Bonferroni post hoc test. *, P < 0.05; **, P < 0.01; ***, P < 0.001.
Figure 7.
Figure 7.
APOE4 effects on astrocyte transcriptome. (A) Bar charts reporting the number of DEGs encoding for proteins with known function in each functional class, as exclusively identified in astrocytes (n = 234 DEGs) of 9–12- vs. 2–3-mo-old E4F mice only, but not in 9–12- vs. 2–3-mo-old E3F mice. (B and C) Representative confocal images of GFAP+ astrocytes in the cortex of 9-mo-old E3F and E4F mice (B; scale bar = 50 µm) and quantification of GFAP+ cortical astrocytes in 2–3- and 9–12-mo-old E3F and E4F mice (C). Mean ± SEM, n = 5 mice per group. Significance by one-way ANOVA followed by Bonferroni post hoc test.
Figure 8.
Figure 8.
APOE4 effects on microglia transcriptome. (A) Bar charts reporting the number of DEGs encoding for proteins with known function in each functional class, as exclusively identified in microglia (n = 219 DEGs) of 9–12- vs. 2–3-mo-old E4F mice only, but not in 9–12- vs. 2–3-mo-old E3F mice. All data are from four mice per group. (B and C) Representative images of Iba1+ microglia in the cortex (scale bar = 50 µm; B) and quantification of Iba1+ cortical astrocytes in 2–3- and 9–12-mo-old E3F and E4F mice (C). Mean ± SEM, n = 5 mice per group. Significance by one-way ANOVA followed by Bonferroni post hoc test.

References

    1. Alata, W., Ye Y., St-Amour I., Vandal M., and Calon F.. 2015. Human apolipoprotein E ε4 expression impairs cerebral vascularization and blood-brain barrier function in mice. J. Cerebr. Blood Flow Metabol. 35:86–94. 10.1038/jcbfm.2014.172 - DOI - PMC - PubMed
    1. Antico Arciuch, V.G., Tedesco L., Fuertes M., and Arzt E.. 2015. Role of RSUME in inflammation and cancer. FEBS Lett. 589:3330–3335. 10.1016/j.febslet.2015.07.048 - DOI - PubMed
    1. Argaw, A.T., Asp L., Zhang J., Navrazhina K., Pham T., Mariani J.N., Mahase S., Dutta D.J., Seto J., Kramer E.G., et al. . 2012. Astrocyte-derived VEGF-A drives blood-brain barrier disruption in CNS inflammatory disease. J. Clin. Invest. 122:2454–2468. 10.1172/JCI60842 - DOI - PMC - PubMed
    1. Armulik, A., Genové G., Mäe M., Nisancioglu M.H., Wallgard E., Niaudet C., He L., Norlin J., Lindblom P., Strittmatter K., et al. . 2010. Pericytes regulate the blood-brain barrier. Nature. 468:557–561. 10.1038/nature09522 - DOI - PubMed
    1. Barnes, S.R., Ng T.S., Santa-Maria N., Montagne A., Zlokovic B.V., and Jacobs R.E.. 2015. ROCKETSHIP: A flexible and modular software tool for the planning, processing and analysis of dynamic MRI studies. BMC Med. Imag. 15:19–20. 10.1186/s12880-015-0062-3 - DOI - PMC - PubMed

Publication types