. 2023 Mar;72(3):679-695.
doi: 10.1007/s00262-022-03278-2. Epub 2022 Aug 30.

Single-cell and spatial transcriptome analyses revealed cell heterogeneity and immune environment alternations in metastatic axillary lymph nodes in breast cancer

Affiliations

Single-cell and spatial transcriptome analyses revealed cell heterogeneity and immune environment alternations in metastatic axillary lymph nodes in breast cancer

Xiaofan Mao et al. Cancer Immunol Immunother. 2023 Mar.

Abstract

Background: Tumor heterogeneity plays essential roles in developing cancer therapies, including therapies for breast cancer (BC). In addition, it is also very important to understand the relationships between tumor microenvironments and the systematic immune environment.

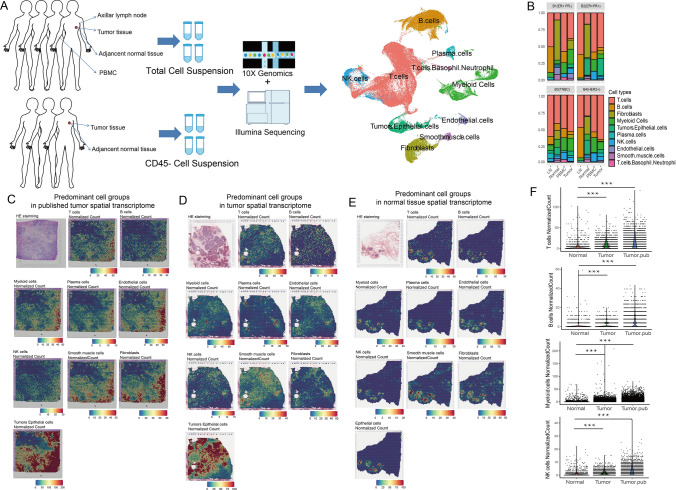
Methods: Here, we performed single-cell, VDJ sequencing and spatial transcriptome analyses on tumor and adjacent normal tissue as well as axillar lymph nodes (LNs) and peripheral blood mononuclear cells (PBMCs) from 8 BC patients.

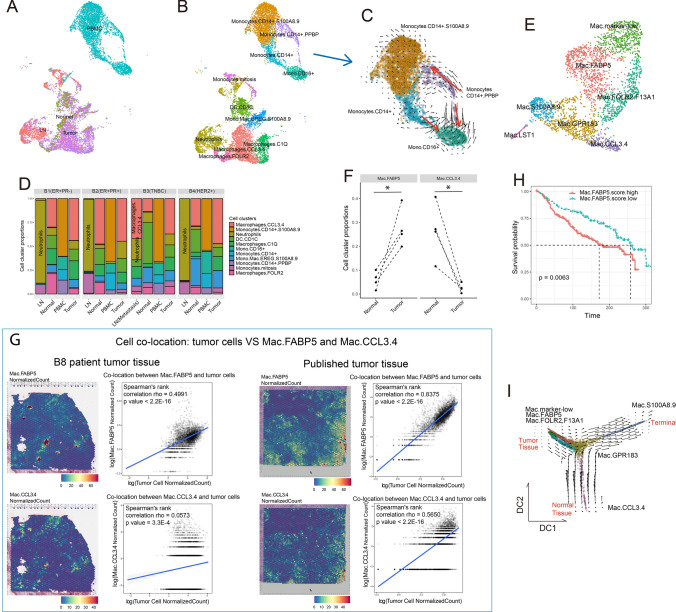
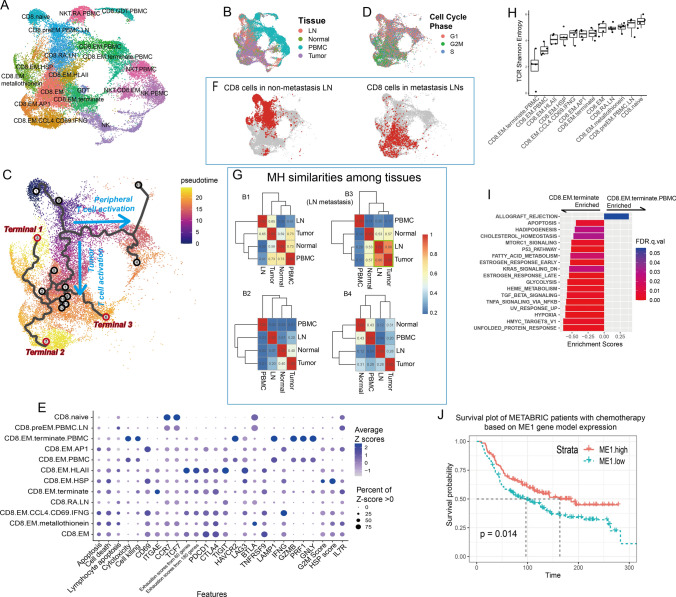
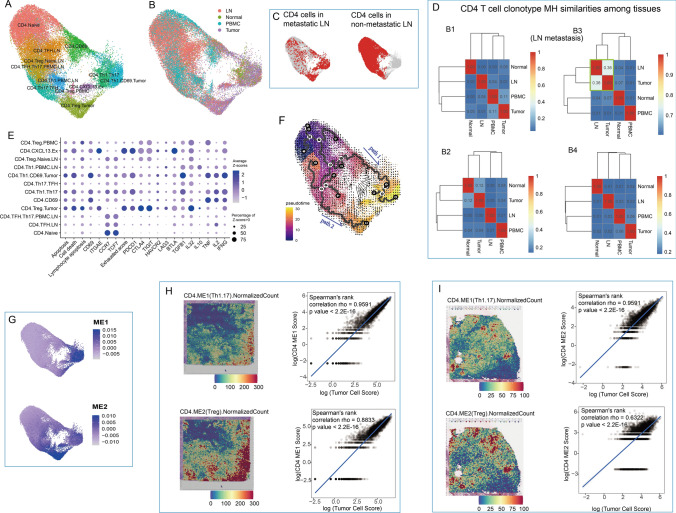
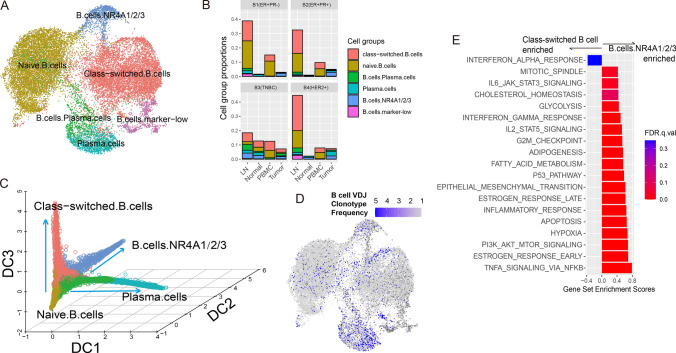
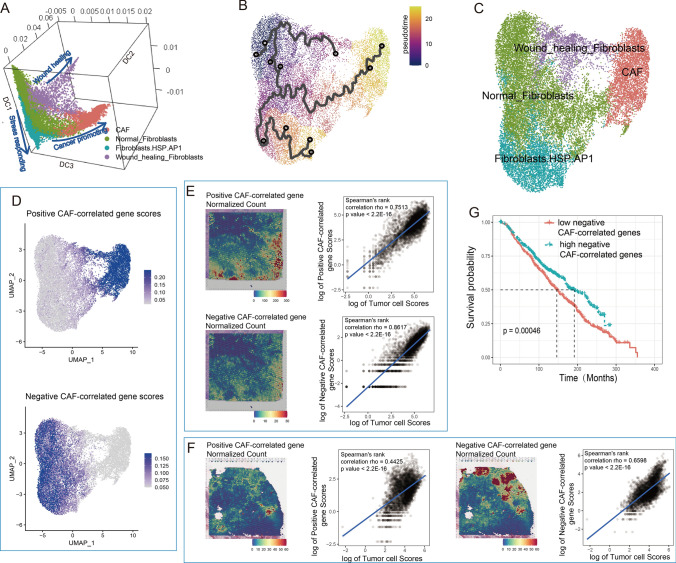
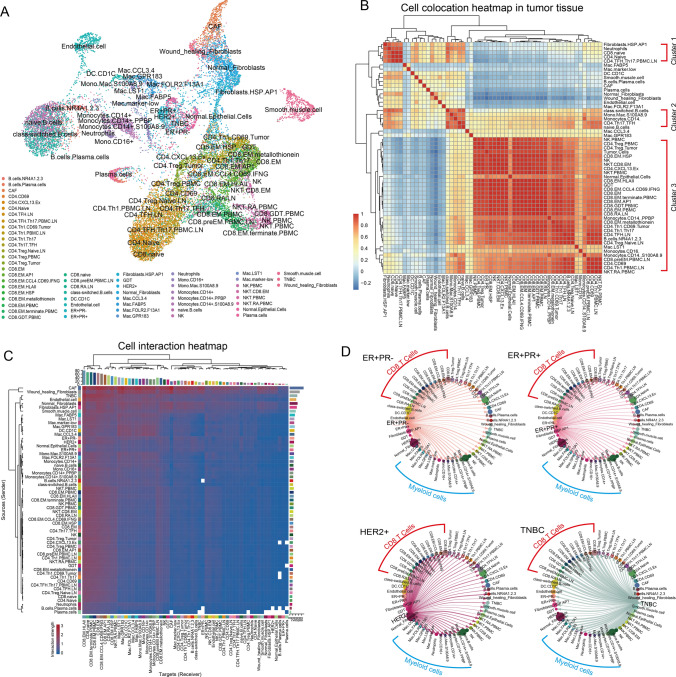
Results: We found that myeloid cells exhibited environment-dependent plasticity, where a group of macrophages with both M1 and M2 signatures possessed high tumor specificity spatially and was associated with worse patient survival. Cytotoxic T cells in tumor sites evolved in a separate path from those in the circulatory system. T cell receptor (TCR) repertoires in metastatic LNs showed significant higher consistency with TCRs in tumor than those in nonmetastatic LNs and PBMCs, suggesting the existence of common neo-antigens across metastatic LNs and primary tumor cites. In addition, the immune environment in metastatic LNs had transformed into a tumor-like status, where pro-inflammatory macrophages and exhausted T cells were upregulated, accompanied by a decrease in B cells and neutrophils. Finally, cell interactions showed that cancer-associated fibroblasts (CAFs) contributed most to shaping the immune-suppressive microenvironment, while CD8+ cells were the most signal-responsive cells.

Conclusions: This study revealed the cell structures of both micro- and macroenvironments, revealed how different cells diverged in related contexts as well as their prognostic capacities, and displayed a landscape of cell interactions with spatial information.

Keywords: Breast cancer; Circulating immune system; Immune and stromal cell heterogeneity; Metastatic lymph nodes; Single-cell and spatial sequencing.


Conflict of interest statement

The authors declare no potential conflict of interest.

Figures

Fig. 1
Fig. 1
Single-cell and spatial transcriptome analyses revealed predominant cell types in BC patients. A Workflow of single-cell experiments. The UMAP plot shows the predominant cell types. B Histogram of predominant cell types in four patients from whom total cells were collected. Spatial normalized counts based on predominant cell type signature gene expression in the spatial transcriptome from published data (C), B8 patient tumor tissue (D) and adjacent normal tissue (E). F Scatter and violin plots comparing the immune infiltrations between tumor and normal tissue spatial transcriptome
Fig. 2
Fig. 2
Myeloid cells exhibited microenvironment-dependent plasticity and showed clinical outcome relevance. A UMAP visualization of myeloid cell distributions based on histologic origin. B UMAP visualization of myeloid cell subtypes. C Velocity plot of the UMAP of monocytes from PBMCs. D Histogram of myeloid subtype compositions in the four patients. E UMAP visualization of LN- and tissue-infiltrated macrophage subtypes. F Paired dot plot showing cell cluster proportions between normal and tumor tissue in the four patients. G Spatial heatmaps and dotplots showing the cell colocations of tumor cells and the two groups of macrophages in tumor tissue. Cell colocation scores were estimated by Spearman correlation of normalized scores of corresponding cell groups. H Survival plot of patients from METABRIC based on Mac.FABP5 signature gene scores. I Velocity plot on the diffusion map of LN- and tissue-infiltrated macrophages
Fig. 3
Fig. 3
Cytotoxic cell heterogeneity. A UMAP visualization of cytotoxic cell subgroups. B UMAP visualization of cytotoxic cells labeled by histologic origin. C Pseudotime trajectories on UMAP. D UMAP visualization of cytotoxic cells labeled by cell cycle phases. E Dot plot of features from CD8 + T cell subgroups. Pathway signature genes were collected from REACTOME. Gene scores were calculated based on the expression of the top 30 positively correlated genes. F UMAP visualization of CD8 + T cells in nonmetastatic and metastatic LNs. G Heatmaps of CD8 + cell MH similarities among tissues. H Boxplot of TCR Shannon entropy in each CD8 + subgroup. I Hallmark pathway enrichment plot comparing two CD8 + terminal effector cell groups. J Survival plot of METABRIC patients with chemotherapy based on ME1 gene model expression
Fig. 4
Fig. 4
CD4+ T cell heterogeneity. A UMAP visualization of CD4+ T cell subgroups. B UMAP visualization of CD4+ T cells labeled by histologic origin. C UMAP visualization of CD4+ T cells in metastatic and nonmetastatic LNs. D Heatmaps of CD4 T cell clonotype MH similarities among tissues in B1-4 patients. E Dot plot of features from CD4 T cell subgroups. Pathway signature genes were collected from REACTOME. Gene scores were calculated based on expressions from top 30 positively correlated genes. F Cell differentiation path on UMAP combined by RNA velocity and pseudotime trajectories. G UMAP visualization of two gene model scores generated by WGCNA. Cell colocations between tumor cells and two groups of CD4 cells in tumor tissue in published data (H) and B8 patient (I). Cell colocation scores were estimated by Spearmen correlation of normalized scores of corresponding cell groups
Fig. 5
Fig. 5
B cell heterogeneity. A UMAP visualization of B cell subgroups. B Proportion B cell subgroups under total cells in related tissues from four patients. C Diffusion map 3D visualization showing B cell differentiation paths. D UMAP visualization of B cell clonotype frequency. E Hallmark pathway enrichment plot comparing two B cell subgroups
Fig. 6
Fig. 6
Fibroblast heterogeneity. A UMAP visualization of fibroblast subgroups. B Diffusion map 3D visualization showing fibroblast differentiation paths. C Pseudotime trajectory of fibroblast differentiation. D UMAP visualization of expression scores from positively and negatively correlated genes along with CAF development. Spatial heatmaps and dotplots showed cell colocations between tumor cells and two groups of CD4 + cells in tumor tissue in published data (E) and B8 patient (F). Cell colocation scores were estimated by Spearman correlation of normalized scores of corresponding cell groups. G Survival plot of METABRIC patients based on negative CAF-correlated gene scores
Fig. 7
Fig. 7
Cell interactions. A UMAP visualization of all cell groups annotated in this research. B Heatmap of cell-type colocations. C Cell interaction heatmap in tumor tissue. Rows represent the senders (ligand genes), and columns represent the receivers (receptor genes). D Cell interactions sent from tumor cells in different BC subtypes. Dot size represents the cell numbers of each cell group. The width of the directed lines represents the interaction numbers observed between cell groups from the nodes of each end

References

    1. Watkins EJ. Overview of breast cancer. JAAPA: Off J Am Acad Phys Assist. 2019;32:13–17. doi: 10.1097/01.JAA.0000580524.95733.3d. - DOI - PubMed
    1. Lehmann BD, et al. Identification of human triple-negative breast cancer subtypes and preclinical models for selection of targeted therapies. J Clin Investig. 2011;121:2750–2767. doi: 10.1172/JCI45014. - DOI - PMC - PubMed
    1. Teschendorff AE, Miremadi A, Pinder SE, Ellis IO, Caldas C. An immune response gene expression module identifies a good prognosis subtype in estrogen receptor negative breast cancer. Genome Biol. 2007;8:R157. doi: 10.1186/gb-2007-8-8-r157. - DOI - PMC - PubMed
    1. Jordan NV, et al. HER2 expression identifies dynamic functional states within circulating breast cancer cells. Nature. 2016;537:102–106. doi: 10.1038/nature19328. - DOI - PMC - PubMed
    1. Roarty K, Pfefferle AD, Creighton CJ, Perou CM, Rosen JM. Ror2-mediated alternative Wnt signaling regulates cell fate and adhesion during mammary tumor progression. Oncogene. 2017;36:5958–5968. doi: 10.1038/onc.2017.206. - DOI - PMC - PubMed