. 2022 Oct 10;7(19):e156577.
doi: 10.1172/jci.insight.156577.

DNA promoter hypermethylation of melanocyte lineage genes determines melanoma phenotype

Affiliations

DNA promoter hypermethylation of melanocyte lineage genes determines melanoma phenotype

Adriana Sanna et al. JCI Insight. .

Abstract

Cellular stress contributes to the capacity of melanoma cells to undergo phenotype switching into highly migratory and drug-tolerant dedifferentiated states. Such dedifferentiated melanoma cell states are marked by loss of melanocyte-specific gene expression and increase of mesenchymal markers. Two crucial transcription factors, microphthalmia-associated transcription factor (MITF) and SRY-box transcription factor 10 (SOX10), important in melanoma development and progression, have been implicated in this process. In this study we describe that loss of MITF is associated with a distinct transcriptional program, MITF promoter hypermethylation, and poor patient survival in metastatic melanoma. From a comprehensive collection of melanoma cell lines, we observed that MITF-methylated cultures were subdivided in 2 distinct subtypes. Examining mRNA levels of neural crest-associated genes, we found that 1 subtype had lost the expression of several lineage genes, including SOX10. Intriguingly, SOX10 loss was associated with SOX10 gene promoter hypermethylation and distinct phenotypic and metastatic properties. Depletion of SOX10 in MITF-methylated melanoma cells using CRISPR/Cas9 supported these findings. In conclusion, this study describes the significance of melanoma state and the underlying functional properties explaining the aggressiveness of such states.

Keywords: Cell Biology; Melanoma; Oncology.


Figures

Figure 1
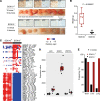
Figure 1. The role of MITF in melanoma.
(A) UMAP analysis of the 1,500 genes with greatest variation across 86 melanoma cell lines driven by MITF gene expression levels. (B) MITF protein staining in a cohort of 75 lymph node metastases and association with distant metastasis–free survival using Kaplan-Meier and log-rank test. Original magnification, ×200. (C) Gene ontology analysis of genes discriminating MITFlo and MITFhi cell lines (FDR = 0). (D) Nine melanoma cell lines were tested for sensitivity to BRAF inhibition using vemurafenib. IC50 values are plotted with individual upper and lower limit indicated as whiskers. Heatmap of MITF, NGFR, and AXL gene expression for each cell line is included. (E) Box plot of MITF gene expression levels in pre- and postrelapse samples in a cohort of 21 patients (50 tumor samples) treated with BRAF inhibition, from National Center for Biotechnology Information Gene Expression Omnibus (GEO)GSE50509. P values were calculated using Mann-Whitney-Wilcoxon test.
Figure 2
Figure 2. DNA methylation changes in melanocytic and NC genes.
(A) Box plot of MITF gene expression levels in melanoma cell lines (n = 51) with and without MITF promoter hypermethylation. (B) Association between UMAP analysis of RNA-Seq data and MITF promoter hypermethylation in 86 melanoma cell lines. (C) Box plot between average β values of CpGs using GSE144487 in the MITF promoter and MITF immunostaining of 39 distant metastases. (D) Heatmap of gene expression levels of NC-associated genes in SOX10 (n = 8) and SOX10+ (n = 7) melanoma cell lines and melanocytes (n = 3). * indicates genes significantly different between SOX10 and SOX10+ groups (Mann-Whitney-Wilcoxon test, Bonferroni corrected). (E) Methylation β values from CpGs located in the promoters of NC genes in SOX10 (n = 7) and SOX10+ (n = 7) melanoma cell lines. * indicates genes significantly different between SOX10 and SOX10+ groups (Mann-Whitney-Wilcoxon test, Bonferroni corrected). (F) Bar plot with results from global methylation analysis between SOX10 and SOX10+ melanoma cell lines using a dot blot assay. A representative membrane is showed on top of each bar for each cell line, indicating increased total 5-mC in the SOX10 (black) compared with SOX10+ (red) cell lines. P value was calculated using 2-sided t test.
Figure 3
Figure 3. Phenotypic characterization of MITF-methylated SOX10+ and SOX10 melanoma cell lines.
(A) Cell proliferation assessed by cell total protein levels in 24–96 hours’ time course; the MITF-methylated SOX10 group (black) shows significantly higher proliferation rate than the MITF-methylated SOX10+ cell lines (red). P values were calculated with ANOVA with Dunnett’s multiple-comparison test. (B) Cell migration through semipermeable membrane shows that MITF-methylated SOX10 cells (black) have significantly higher migration capacities than the SOX10+ melanomas (red) at 72 hours’ time point. P value was calculated with 2-sided t test. (C) Colony forming assay in 2-week period shows significantly higher number and size of colonies in the MITF-methylated SOX10 subgroup (black) than SOX10+ cells (red). As seen microscopically, SOX10 colonies are sparse with loose cell-to-cell contact, while the SOX10+ group forms compact colonies. Measurements were performed at indicated absorbance (Abs). P value was calculated with 2-sided t test. (D) Cell anchorage-independent growth of MITF-methylated SOX10 group (black) and SOX10+ group (red) does not show significant differences in cell viability at 48-hour time point. As seen microscopically, SOX10 cells cluster in spheroid elongated structures, while the SOX10+ group remains spread in a single-cell suspension. P value was calculated with 2-sided t test. (E) Treatment of SOX10+ (red) and SOX10 cells (black) with increasing concentrations of BRAF inhibitor shows complete resistance of the SOX10 cells. P value was calculated with 1-way ANOVA with Dunnett’s multiple-comparison test.
Figure 4
Figure 4. In vivo characterization of MITF-methylated melanomas.
(A) Photos and staining of xenograft tumors from NSG mice injected with SOX10+ (MM383) or SOX10 (IGR-39) melanoma cells. Tumors were analyzed for MITF and SOX10 protein expression using immunostaining. Arrows indicate MITF-positive melanoma cells. Original magnification, ×200. (B) Box plot showing weight differences between SOX10+ (red) and SOX10 (black) cell line–derived tumors. P value was calculated using 2-sided t test. (C) Transcriptomic analysis using the NanoString PanCancer Pathways Panel describes significant differences between SOX10+ (red) and SOX10 (black) derived xenograft tumors. (D) Box plot showing 3 selected genes (JUN, NGFR, WNT5A; FDR = 0) from the NanoString PanCancer Pathways Panel gene expression analysis. (E) Frequencies (%) of metastases detected in brain, liver, and lungs of the NSG mice injected with SOX10+ MM383 (red) and SOX10 IGR-39 (black) melanoma cells. P value was calculated using χ2 test.
Figure 5
Figure 5. Ex vivo migration patterns in SOX10 and SOX10+ melanoma cells.
(A) Illustration of the workflow used in the ex vivo organotypic brain slice culture experiment. (B) Brain slice migration assays in SOX10+ MM383 (red) and SOX10 IGR-39 (black) melanoma cell lines seeded onto membranes display SOX10 cells moving toward the brain slice. (C) Transwell migration experiment of SOX10+ MM383 (red) and SOX10 IGR-39 (black) melanoma cell lines using brain conditioned media shows increased migration of the SOX10 IGR-39 cells.
Figure 6
Figure 6. CRISPR/Cas9 editing of SOX10 in MITF-methylated melanomas.
(A) Target sequence and confirmation of SOX10 KO by Sanger sequencing and Western blot in MM383 melanoma cells. (B) Transcriptomic analysis describes differences in the expression levels of NC-associated genes between SOX10WT (black) and SOX10KO (clone 1, green) cells. * indicates significantly different expression (FDR = 0). (C) Migration of SOX10WT (black) and SOX10KO (green) cells analyzed using a Transwell assay shows decreased migratory potential of the SOX10KO clones. P value was calculated using Mann-Whitney-Wilcoxon test. (D) Treatment of SOX10WT (black) and SOX10KO (green) cells with BRAF inhibitors shows increased resistance of the SOX10KO clones compared with wild-type cells. P value was calculated using 1-way ANOVA with Dunnett’s multiple-comparison test. (E) β-Galactosidase staining used to measure the fraction of senescent cells in SOX10WT (black) and SOX10KO (green) displays higher senescent cell count in the SOX10KO clones. P value was calculated using Mann-Whitney-Wilcoxon test. Original magnification, ×400. (F) Box plot showing difference in weight between SOX10WT (black) and SOX10KO (green) derived primary tumors and tumor photos. P value were calculated using Mann-Whitney-Wilcoxon test. (G) qPCR analysis of human GAPDH in brain tissues from SOX10WT (black) and SOX10KO (green) melanoma-injected NSG mice. Representative immunostaining of SOX10KO mouse brain tissue using human nuclear mitochondria antibody. P value was calculated using Mann-Whitney-Wilcoxon test.

References

    1. Cirenajwis H, et al. Molecular stratification of metastatic melanoma using gene expression profiling: prediction of survival outcome and benefit from molecular targeted therapy. Oncotarget. 2015;6(14):12297–12309. doi: 10.18632/oncotarget.3655. - DOI - PMC - PubMed
    1. Jonsson G, et al. Gene expression profiling-based identification of molecular subtypes in stage IV melanomas with different clinical outcome. Clin Cancer Res. 2010;16(13):3356–3367. doi: 10.1158/1078-0432.CCR-09-2509. - DOI - PubMed
    1. Mehta A, et al. Immunotherapy resistance by inflammation-induced dedifferentiation. Cancer Discov. 2018;8(8):935–943. doi: 10.1158/2159-8290.CD-17-1178. - DOI - PMC - PubMed
    1. Dupin E, Le Douarin NM. Development of melanocyte precursors from the vertebrate neural crest. Oncogene. 2003;22(20):3016–3023. doi: 10.1038/sj.onc.1206460. - DOI - PubMed
    1. Shain AH, Bastian BC. From melanocytes to melanomas. Nat Rev Cancer. 2016;16(6):345–358. doi: 10.1038/nrc.2016.37. - DOI - PubMed

Publication types

MeSH terms