A mean platelet volume in inflammatory bowel disease: A systematic review and meta-analysis
- PMID: 36040881
- PMCID: PMC9426900
- DOI: 10.1371/journal.pone.0273417
A mean platelet volume in inflammatory bowel disease: A systematic review and meta-analysis
Abstract
Background: Inflammatory bowel disease (IBD) is a chronic gastrointestinal tract inflammatory state, which is affecting millions of individuals in the world. It can affect alimentary canals such as colon, rectum, ileum and other parts. In IBD, platelet parameters underwent several changes. Therefore, the aim of this review was determining the estimated pooled mean platelet volume and mean difference in inflammatory bowel disease to elucidate its potential diagnostic value.
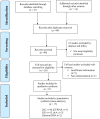
Methods: Articles were extensively searched in bibliographic databases using Medical Subject Heading and entry phrases or terms. In addition, articles were directly searched in Google Scholar to account for the studies omission in searching bibliographic databases. Observational (cohort, cross-sectional and case-control) studies, published in English language and conducted on IBD were included. For studies meeting the eligibility criteria, the first author's name, publication year, population, study design, study area, sample size, mean platelet volume and standard deviation were extracted and entered in to Microsoft-excel. The analysis was done by Stata version 11. In order to estimate the pooled mean platelet volume and mean difference, random effect model was done. The heterogeneity was quantified using Higgin's I2 statistics. Publication bias was determined using Egger's test statistics and funnel plot. Sub-group analysis based on population carried to reduce heterogeneity.
Results: A total of 17 relevant articles with 2957 participants (1823 IBD cases and 1134 healthy controls) were included to this study. The pooled estimated MPV was 9.29fl; 95% CI: 9.01-9.57 and 9.50fl; 95% CI: 8.81-10.20 in IBD and control groups, respectively. The standardized pooled estimate of mean difference in mean platelet volume was -0.83fl; 95% CI: -1.15, -0.51; I2: 93.1%; P-value < 0.001. In subgroup analysis based on population, the highest estimated mean difference in MPV was observed among patients of CD; -2.30; 95% CI: -3.46, -1.14; I2: 97.8%; P-value < 0.001.
Conclusion: According to the current systematic review and meta-analysis, mean platelet volume was lower in IBD compared to control. The decreased mean platelet volume could be attributed to platelet consumption or sequestration associated with the progression of IBD. As a result, in IBD, mean platelet volume can provide diagnostic and prognostic information.
Conflict of interest statement
The authors have declared that no competing interest.
Figures


Similar articles
-
The diagnostic accuracy of mean platelet volume in differentiating immune thrombocytopenic purpura from hypo-productive thrombocytopenia: A systematic review and meta-analysis.PLoS One. 2023 Nov 30;18(11):e0295011. doi: 10.1371/journal.pone.0295011. eCollection 2023. PLoS One. 2023. PMID: 38033118 Free PMC article.
-
Abnormal platelet parameters in inflammatory bowel disease: a systematic review and meta-analysis.BMC Gastroenterol. 2024 Jul 3;24(1):214. doi: 10.1186/s12876-024-03305-9. BMC Gastroenterol. 2024. PMID: 38961334 Free PMC article.
-
Preeclampsia has an association with both platelet count and mean platelet volume: A systematic review and meta-analysis.PLoS One. 2022 Sep 14;17(9):e0274398. doi: 10.1371/journal.pone.0274398. eCollection 2022. PLoS One. 2022. PMID: 36103491 Free PMC article.
-
The Prevalence and Associated Risk Factors of Erectile Dysfunction in Patients With Inflammatory Bowel Disease: A Systematic Review and Meta-analysis.J Sex Med. 2022 Jun;19(6):950-960. doi: 10.1016/j.jsxm.2022.03.615. Epub 2022 Apr 28. J Sex Med. 2022. PMID: 35491378
-
Changes in selected hematological parameters in patients with type 1 and type 2 diabetes: a systematic review and meta-analysis.Front Med (Lausanne). 2024 Feb 20;11:1294290. doi: 10.3389/fmed.2024.1294290. eCollection 2024. Front Med (Lausanne). 2024. PMID: 38444411 Free PMC article.
Cited by
-
Ononin alleviates DSS-induced colitis through inhibiting NLRP3 inflammasome via triggering mitophagy.Immun Inflamm Dis. 2023 Feb;11(2):e776. doi: 10.1002/iid3.776. Immun Inflamm Dis. 2023. PMID: 36840499 Free PMC article.
-
Performance of Machine Learning Algorithms for Predicting Disease Activity in Inflammatory Bowel Disease.Inflammation. 2023 Aug;46(4):1561-1574. doi: 10.1007/s10753-023-01827-0. Epub 2023 May 12. Inflammation. 2023. PMID: 37171693
-
Mean platelet volume: A versatile biomarker in clinical diagnostics and prognostics.Bioinformation. 2025 Apr 30;21(4):783-788. doi: 10.6026/973206300210783. eCollection 2025. Bioinformation. 2025. PMID: 40636189 Free PMC article.
-
The diagnostic accuracy of mean platelet volume in differentiating immune thrombocytopenic purpura from hypo-productive thrombocytopenia: A systematic review and meta-analysis.PLoS One. 2023 Nov 30;18(11):e0295011. doi: 10.1371/journal.pone.0295011. eCollection 2023. PLoS One. 2023. PMID: 38033118 Free PMC article.
-
Abnormal platelet parameters in inflammatory bowel disease: a systematic review and meta-analysis.BMC Gastroenterol. 2024 Jul 3;24(1):214. doi: 10.1186/s12876-024-03305-9. BMC Gastroenterol. 2024. PMID: 38961334 Free PMC article.
References
-
- Bernstein CN, Fried M, Krabshuis J, Cohen H, Eliakim R. Inflammatory bowel disease: a global perspective. Global guidelines Milwaukee: World Gatroenterology Organization. 2009.
Publication types
MeSH terms
LinkOut - more resources
Full Text Sources
Research Materials

