. 2022 Aug 30;17(8):e0273822.
doi: 10.1371/journal.pone.0273822. eCollection 2022.

Citizen science and expert opinion working together to understand the impacts of climate change

Affiliations

Citizen science and expert opinion working together to understand the impacts of climate change

Maria Isabel Garcia-Rojas et al. PLoS One. .

Abstract

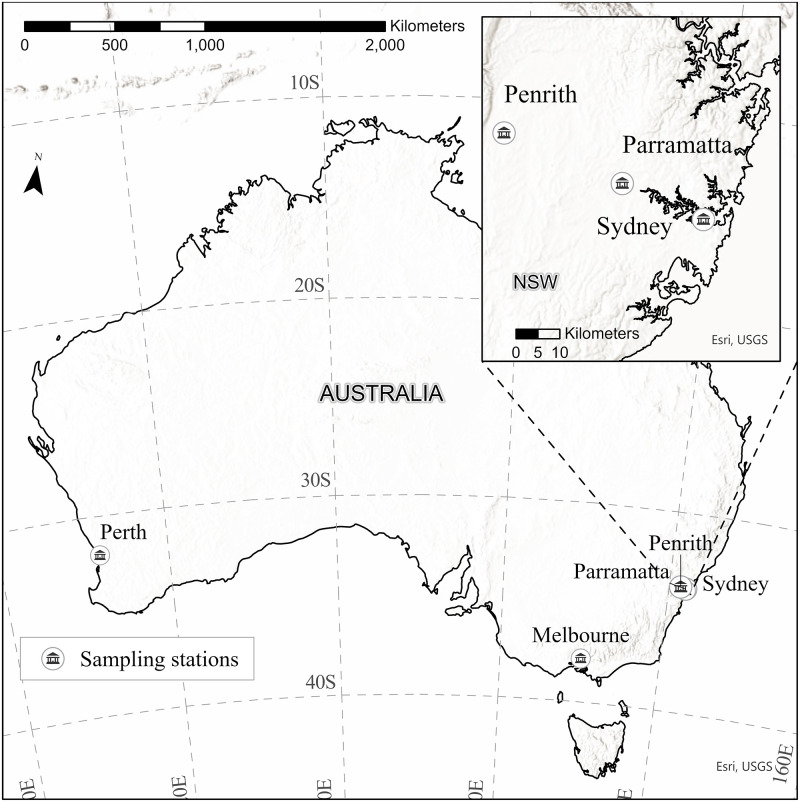
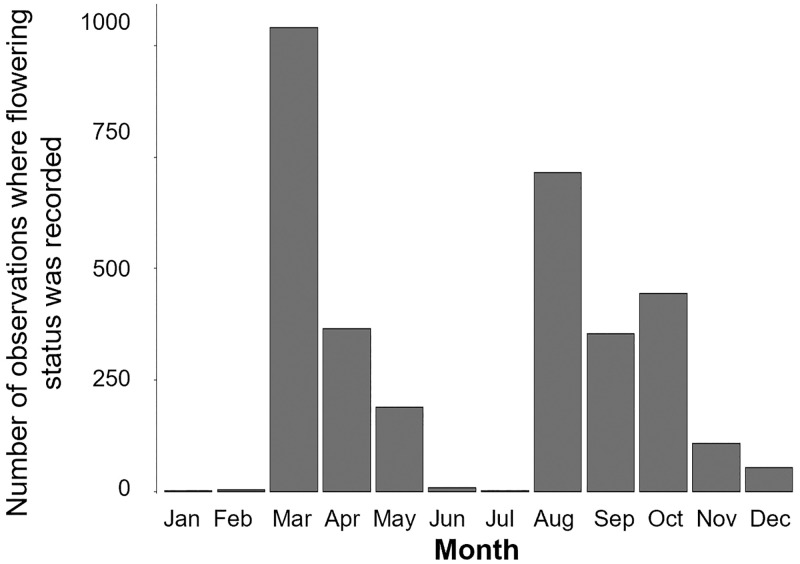
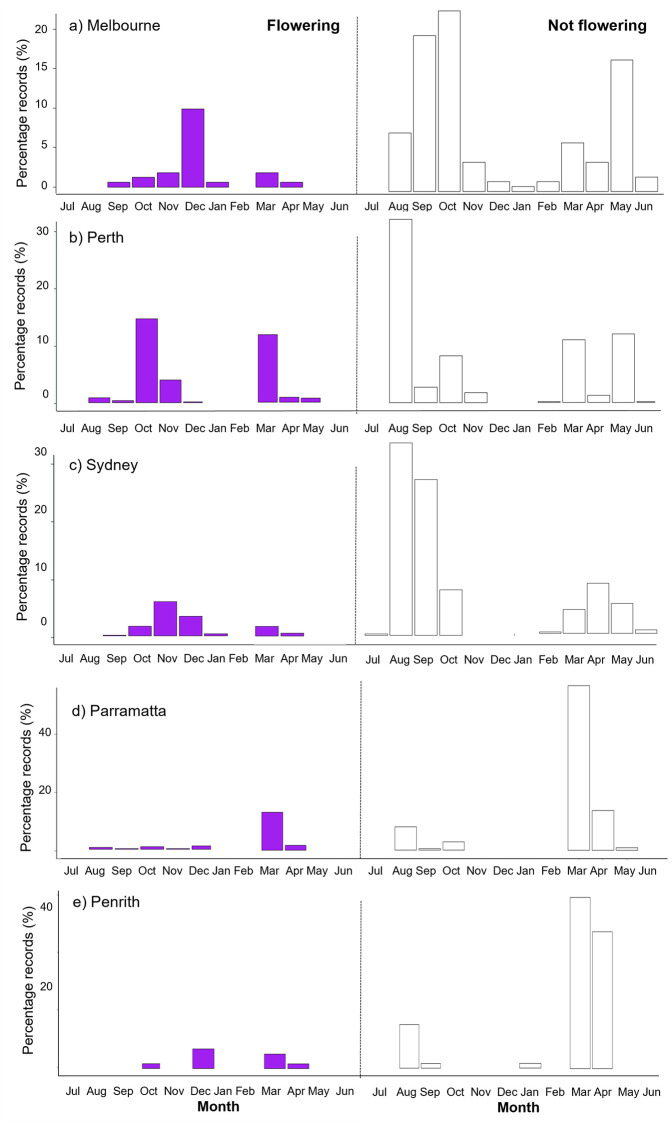
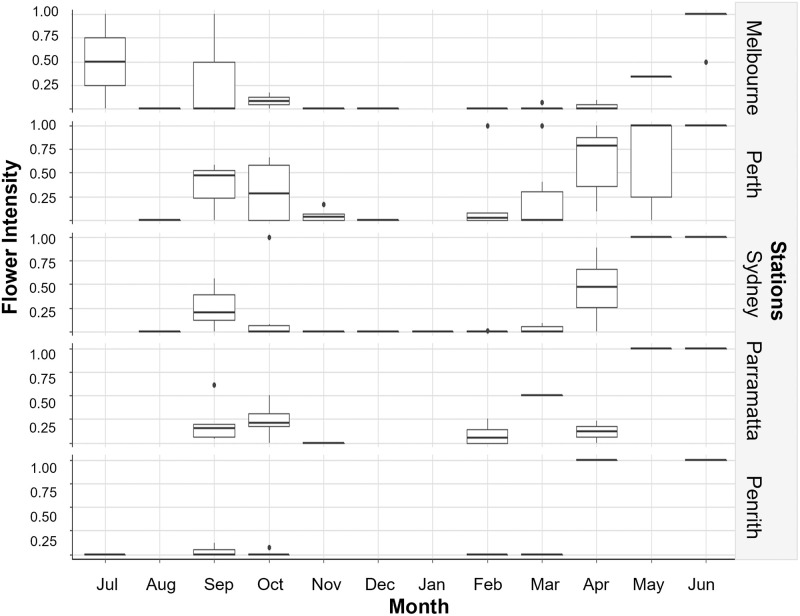
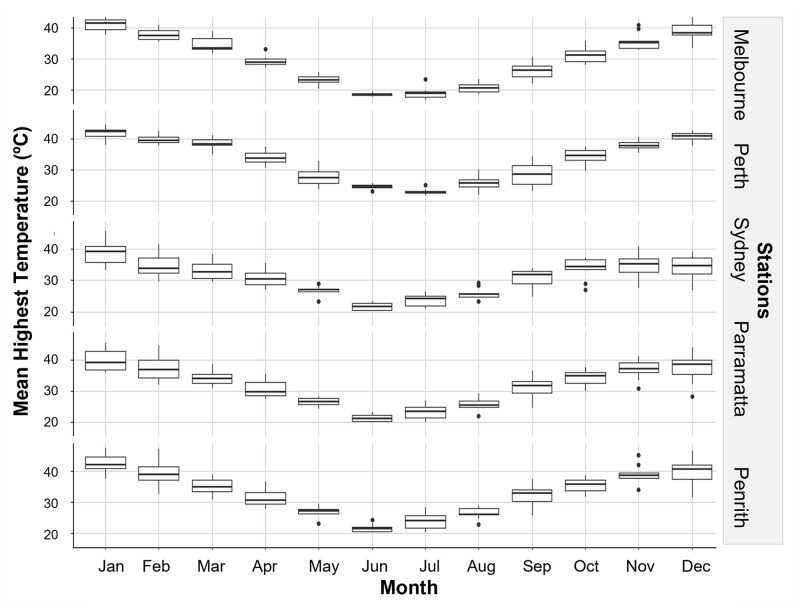
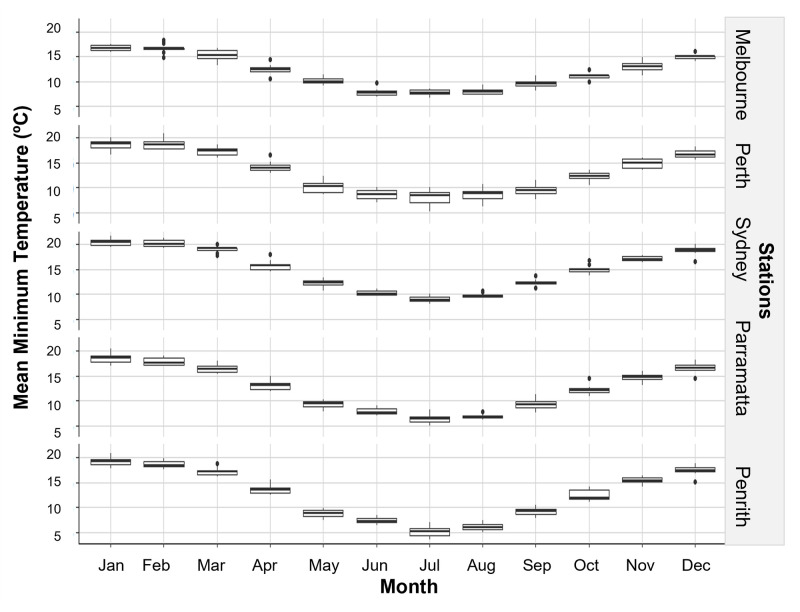
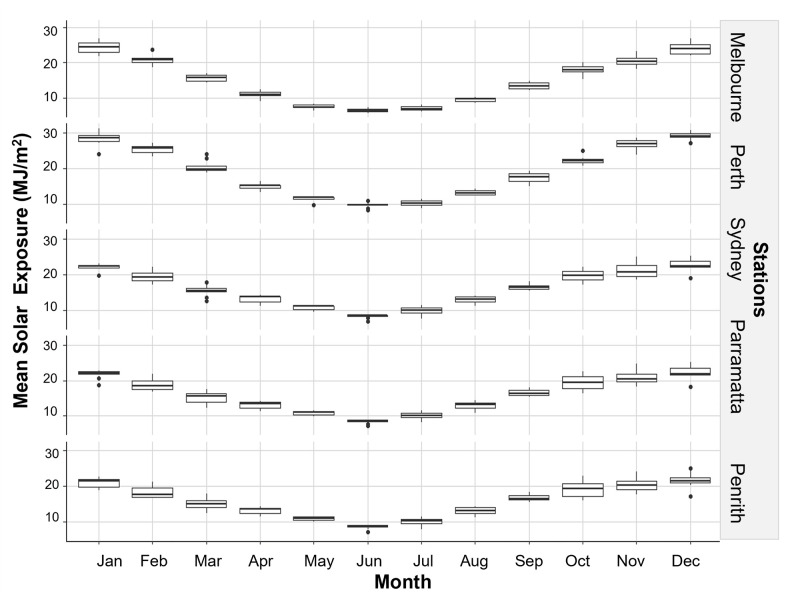
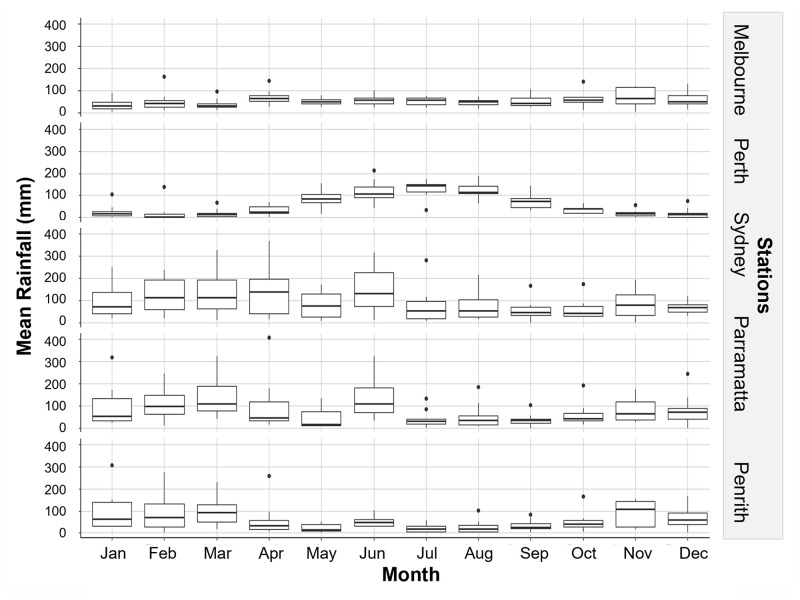
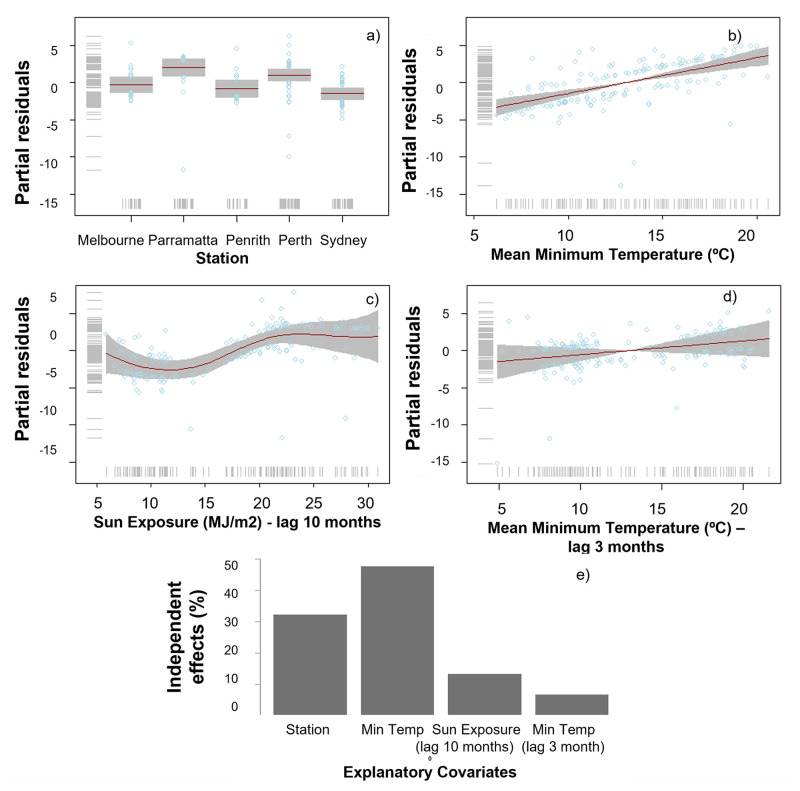
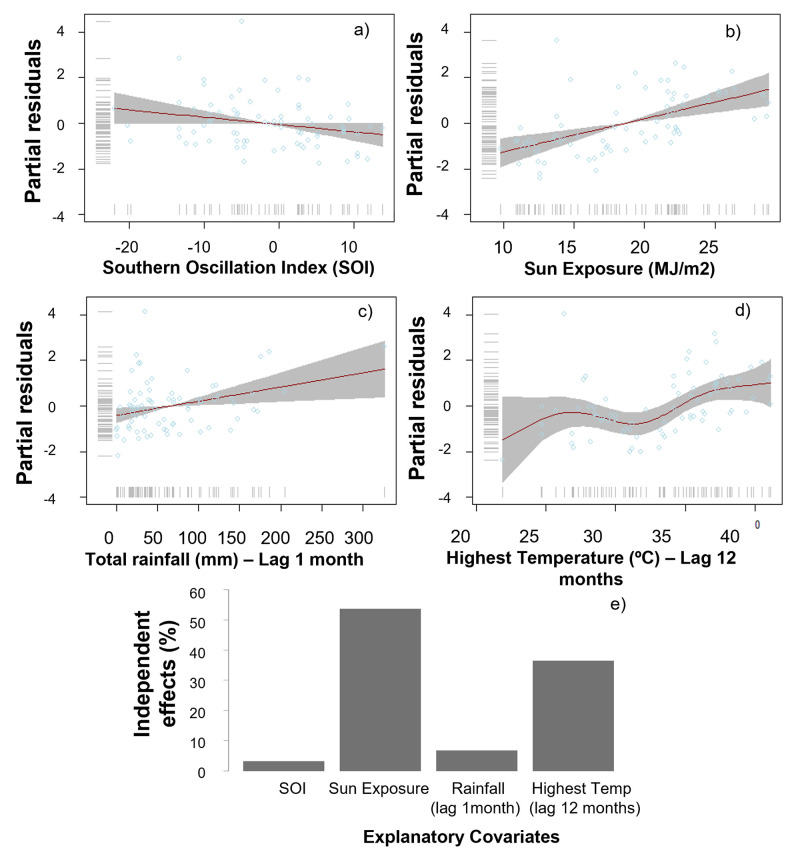
In the absence of historical information on phenology available in Australia, expert opinion was used for selecting indicator species that would be suitable for monitoring phenology on a continental scale as part of ClimateWatch-a citizen science program. Jacaranda mimosifolia being the most frequently observed species was used in this study to test expert opinion and the adequacy of citizen science records in detecting the influence of climatic conditions on this species' flowering phenology. Generalised Additive Models for Location Scale and Shape were used to explore the occurrence and intensity of flowering of Jacaranda in relation to rainfall, temperature, and sun exposure. Jacaranda flowering onset was influenced by winter cold exposure, while flowering intensity was related to increasing sun exposure as spring progresses, and both were influenced by the conditions for flowering in the former flowering seasons (i.e., sun exposure and highest temperatures reached, respectively). Our models provide the first attempt to describe the climate drivers for Jacaranda mimosifolia flowering in the southern hemisphere and identify where climatic changes will most likely alter this tree's phenology in Australia and benefit or challenge its reproductive ability. They also support the choice of species for citizen science programs based on expert opinion.


Conflict of interest statement

The authors have declared that no competing interests exist.

Figures

Fig 1
Fig 1. Weather sampling stations chosen to explore Jacaranda relationships to climate signatures between 2009–2019 in Australia.
(a) Location of all stations at a country level. (b) Location of stations within New South Wales State. Image created by the authors in ESRI’s ArcGIS Pro using basemaps supported by Esri under a CC BY license, original copyright 1995–2022 Esri.
Fig 2
Fig 2. Number of Jacaranda ClimateWatch observations specifying flowering status.
Only records in which flowers presence or absence was recorded per month from 2009–2019 are summarised.
Fig 3
Fig 3. Monthly trends of Jacaranda flowering and non-flowering in the five stations according to ClimateWatch citizen science data between 2009–2019.
Fig 4
Fig 4. Boxplot outlining the monthly variability in Jacaranda flowering intensity from 2009–2019.
A score of 0 indicated that no flowering occurred whilst a score of 1 indicated that flowering was dominant, and flowers were seen in all trees at each station.
Fig 5
Fig 5. Trend in mean monthly highest temperature from 2009 to 2019 at sampling stations.
Fig 6
Fig 6. Trend in mean monthly minimum temperature from 2009 to 2019 at sampling stations.
Fig 7
Fig 7. Trend in mean solar exposure between 2009–2019 at sampling stations.
Fig 8
Fig 8. Trend in rainfall between 2009–2019 at sampling stations.
Fig 9
Fig 9. GAMLSS best binomial model explaining the occurrence of Jacaranda flowering between 2009–2019.
(a-c) panels showing the partial and the respective percentage contribution of each of the chosen covariates in determining whether or not Jacaranda trees flower (e).
Fig 10
Fig 10. GAMLSS best continuous model outlining the conditions that promoted flowering and triggered maximum flowering intensity (peak flowering events) between 2009–2019.
Flowering intensity response per model covariate (a-d) and the respective percentage contribution of each of the chosen covariates in maximising flowering intensity (e). Models were developed using records from Melbourne, Perth, Sydney, Parramatta, and Penrith, and were based on a beta distribution.

Similar articles

References

    1. Lieth H. Purposes of a phenology book. In: Lieth H, editor. Phenology and seasonality modeling Ecological studies: analysis and synthesis. 8. New York: Springer-Verlag; 1974. p. 3–19.
    1. Menzel A, Yuan Y, Matiu M, Sparks T, Scheifinger H, Gehrig R, et al.. Climate change fingerprints in recent European plant phenology. Glob Chang Biol. 2020;26(4):2599–612. doi: 10.1111/gcb.15000 - DOI - PubMed
    1. Parmesan C, Yohe G. A globally coherent fingerprint of climate change impacts across natural systems. Nature. 2003;421(6918):37–42. doi: 10.1038/nature01286 - DOI - PubMed
    1. Chambers LE, Altwegg R, Barbraud C, Barnard P, Beaumont LJ, Crawford RJ, et al.. Phenological changes in the southern hemisphere. PLoS ONE. 2013;8(10):e75514. doi: 10.1371/journal.pone.0075514 - DOI - PMC - PubMed
    1. Beaumont LJ, Hartenthaler T, Keatley MR, Chambers LE. Shifting time: recent changes to the phenology of Australian species. Clim Res. 2015;63(3):203–14.

Publication types