. 2022 Aug 30;15(749):eabn2707.
doi: 10.1126/scisignal.abn2707. Epub 2022 Aug 30.

The drug efflux pump MDR1 promotes intrinsic and acquired resistance to PROTACs in cancer cells

Affiliations

The drug efflux pump MDR1 promotes intrinsic and acquired resistance to PROTACs in cancer cells

Alison M Kurimchak et al. Sci Signal. .

Abstract

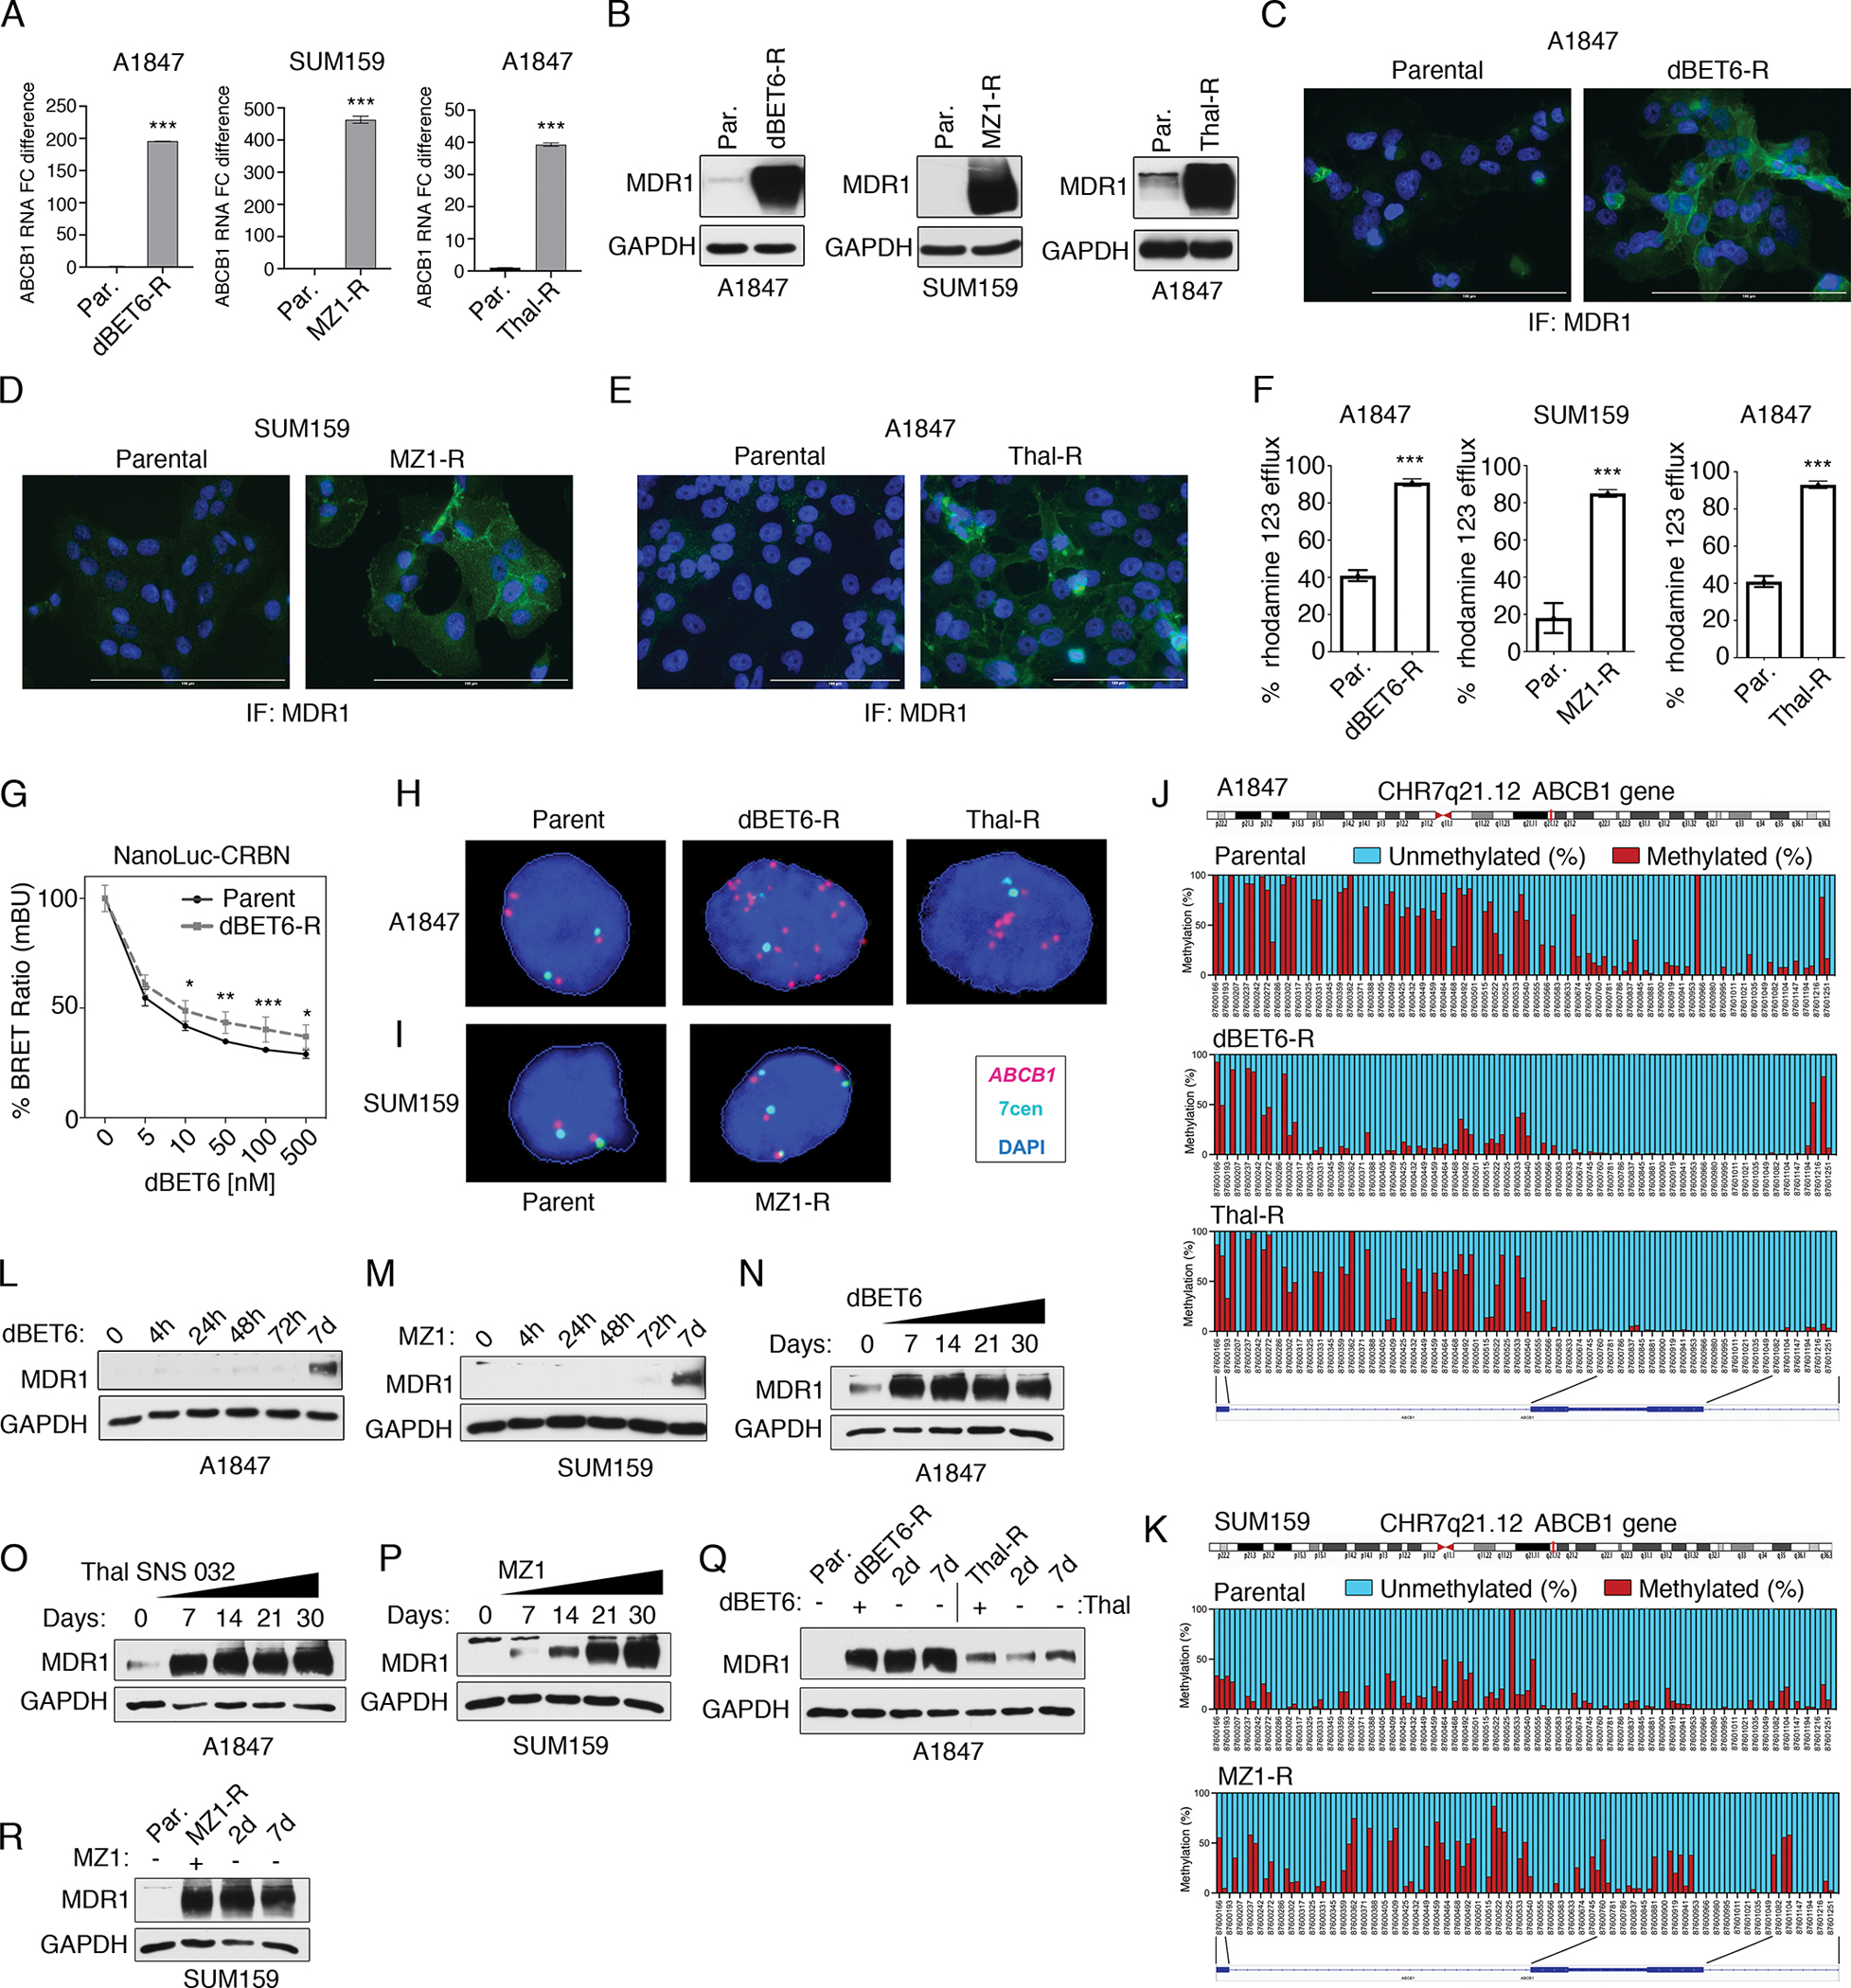
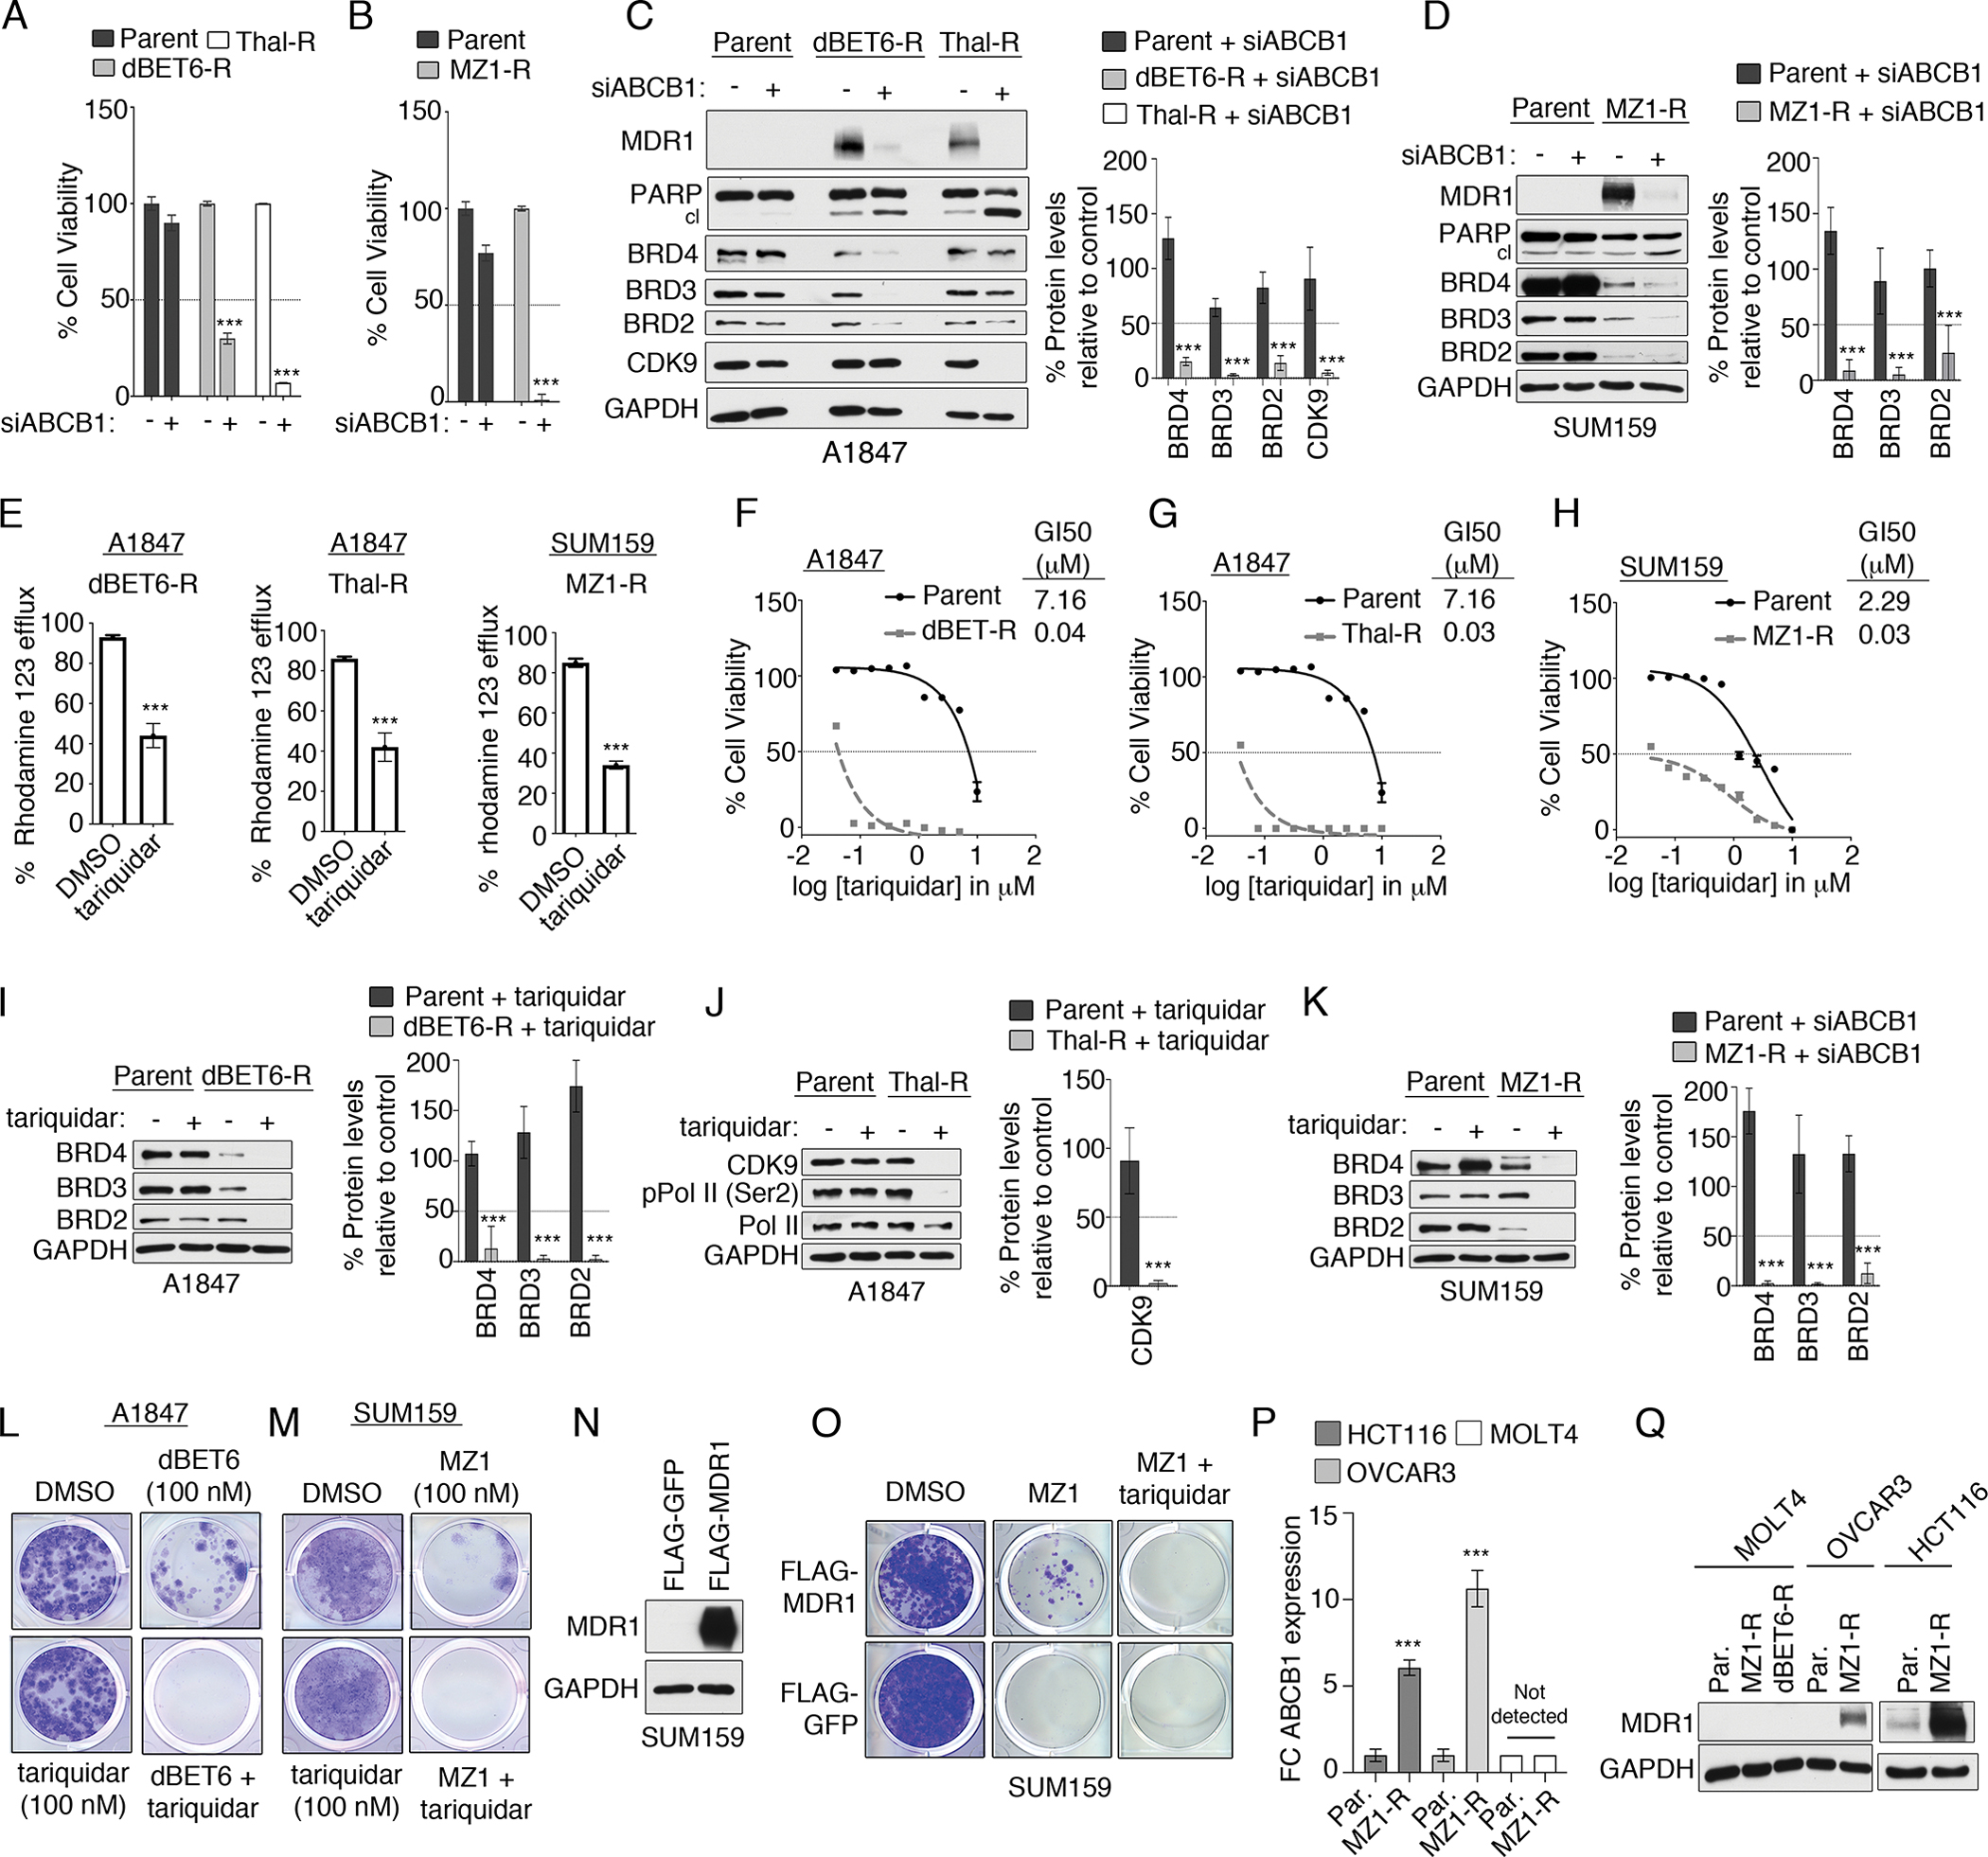
Proteolysis-targeting chimeras (PROTACs) are a promising new class of drugs that selectively degrade cellular proteins of interest. PROTACs that target oncogene products are avidly being explored for cancer therapies, and several are currently in clinical trials. Drug resistance is a substantial challenge in clinical oncology, and resistance to PROTACs has been reported in several cancer cell models. Here, using proteomic analysis, we found intrinsic and acquired resistance mechanisms to PROTACs in cancer cell lines mediated by greater abundance or production of the drug efflux pump MDR1. PROTAC-resistant cells were resensitized to PROTACs by genetic ablation of ABCB1 (which encodes MDR1) or by coadministration of MDR1 inhibitors. In MDR1-overexpressing colorectal cancer cells, degraders targeting either the kinases MEK1/2 or the oncogenic mutant GTPase KRASG12C synergized with the dual epidermal growth factor receptor (EGFR/ErbB)/MDR1 inhibitor lapatinib. Moreover, compared with single-agent therapies, combining MEK1/2 degraders with lapatinib improved growth inhibition of MDR1-overexpressing KRAS-mutant colorectal cancer xenografts in mice. Together, our findings suggest that concurrent blockade of MDR1 will likely be required with PROTACs to achieve durable protein degradation and therapeutic response in cancer.


Conflict of interest statement

Competing interests: J.S.D. is an inventor on patent application WO2021026349A1 for using PROTACs in combination with dual MDR1 and kinase inhibitors for the treatment of cancer. J.J. and J. H. are inventors of a patent application filed by Icahn School of Medicine at Mount Sinai. The Jin laboratory received research funds from Celgene Corporation, Levo Therapeutics, Cullgen Inc. and Cullinan Oncology. J.J. is a cofounder and equity shareholder in Cullgen Inc. and a consultant for Cullgen Inc., EpiCypher Inc., and Accent Therapeutics Inc. The other authors declare that they have no competing interests related to this project.

Figures

Figure 1.
Figure 1.. Proteomics characterization of degrader-resistant cancer cell lines.
(A) Workflow for identifying protein targets upregulated in degrader-resistant cancer cells. Single-run proteome analysis was performed, and changes in protein levels amongst parent and resistant cells were determined by label-free quantitation. (B and C) Cell viability assessed by CellTiter-Glo in parental and dBET6- or Thal SNS 032-resistant A1847 cells treated with increasing doses of dBET6 (B) or Thal SNS 032 (C) for 5 days. Data were analyzed as % of DMSO control, presented as means ± SD of 3 independent assays. GI50 values were determined using PRISM software. (D to G) Immunoblotting for degrader targets and downstream signaling in parental A1847 cells and their derivative dBET6-R or Thal-R cells treated with increasing doses of dBET6 or Thal SNS 032 for 4 hours. The dBET6-R and Thal-R cells were continuously cultured in 500 nM of the PROTAC. Blots are representative, and densitometric analysis are means ± SD from 3 blots, each normalized to loading control, GAPDH. DC50 values, quantitating either (E) the dose of dBET6 that reduces BRD2, BRD3 or BRD4 or (G) the dose of Thal SNS 032 that reduces CDK9 protein levels 50% of the DMSO control treatment, were determined with Prism software. (H to K) Volcano plot of proteins with increased or reduced abundance in dBET6-R (H) or Thal-R (I) A1847 cells relative to parental cells. Differences in protein log2 LFQ intensities amongst degrader-resistant and parental cells were determined by paired t-test Permutation-based adjusted P values at FDR of <0.05 using Perseus software. The top 10 upregulated proteins in each are shown in (J) and (K), respectively. (L and M) ABCB1 log2 LFQ values in dBET6-R cells from (H) and Thal-R cells from (I) compared to that in parental A1847 cells. Data are presented as means ± from 3 independent assays. By paired t-test Permutation-based adjusted P values at FDR of <0.05 using Perseus software, ***P ≤0.001. (N) Cell viability assessed by CellTiter-Glo in parental and MZ1-resistant SUM159 cells treated with increasing doses of MZ1 for 5 days. Data were analyzed as % of DMSO control, presented as means of 3 independent assays. GI50 were determined using PRISM software. (O and P) Immunoblotting for degrader targets and downstream signaling in parental or MZ1-R SUM159 cells treated with increasing doses of MZ1 for 24 hours. The MZ1-R cells were continuously cultured in 500 nM MZ1. Blots are representative, and densitometric analysis are means ± SD from 3 blots, each normalized to loading control, GAPDH. DC50 values were determined in Prism software. (Q and R) Top 10 upregulated proteins (Q) and ABCB1 log2 LFQ values (R) in MZ1-R cells relative to parental SUM159 cells. ***P ≤0.001 as described in (L and M). Related data are in fig. S1 and data file S1.
Figure 2.
Figure 2.. Chronic Exposure to Degraders Induces MDR1 Expression and Drug Efflux Activity.
(A) ABCB1 mRNA levels in parental and degrader-resistant cell lines as determined by qRT-PCR. Data are means ± SD of 3 independent experiments. ***P ≤0.001 by Student’s t-test. (B) Immunoblot analysis of MDR1 protein levels in parental and degrader-resistant cell lines. Blots are representative 3 independent experiments. (C to E) Immunofluorescence (“IF”) microscopy of MDR1 protein levels in A1847 dBET6-R (C), SUM159 MZ1-R (D) and Thal-R A1847 cells (E) relative to parental cells. Nuclear staining by DAPI. Images are representative of 3 independent experiments. Scale bars, 100 μM. (F) Drug efflux activity in A1847 dBET6-R, SUM159 MZ1-R and Thal-R A1847 cells relative to parental cells (Par.) using Rhodamine 123 efflux assays. Bars are means ± SD of 3 independent experiments. ***P ≤0.001 by Student’s t-test. (G) Intracellular dBET6 levels in parental or dBET-R A1847 cells transfected with CRBN-sensor and treated with increasing concentrations of dBET6. Intracellular dBET6 levels measured using the CRBN NanoBRET target engagement assay. Data were analyzed as % of DMSO control, presented as means ± SD of 3 independent assays. *P ≤0.05. **P ≤0.01, ***P ≤0.001 by Student’s t-test. (H and I) FISH analysis of representative drug-sensitive parental and drug-resistant A1847 (H) and SUM159 (I) cells using ABCB1 and control XCE 7 centromere probes. Images of interphase nuclei were captured with a Metasystems Metafer microscope workstation, and the raw images were extracted and processed to depict ABCB1 signals in magenta, centromere 7 signals in cyan, and DAPI-stained nuclei in blue. (J and K) CpG methylation status of the ABCB1 downstream promoter (coordinates: chr7.87,600,166–87,601,336) by bisulfite amplicon sequencing in parent and degrader-resistant A1847 (J) and SUM159 (K) cells. Images depict averaged percentage of methylation for each region of the promoter, where methylation status is depicted by color: Red, methylated; blue, unmethylated. Schematic of the ABCB1 gene with the location of individual CpG sites is shown. Graphs are representative of 3 independent experiments. (L and M) Immunoblot analysis of MDR1 protein levels following short-term exposure [for hours (h) or days (d) as indicated] to BET protein degraders dBET6 or MZ1 (100 nM) in A1847 (L) and SUM159 (M) cells, respectively. Blots are representative of 3 independent experiments. (N to P) Immunoblot analysis of MDR1 protein levels in A1847 and SUM159 cells following long-term exposure (7 to 30 days) to BET protein degraders dBET6 (N), Thal SNS 032 (O), or MZ1 (P) each at 500 nM. Blots are representative of 3 independent experiments. (Q and R) Immunoblot analysis of MDR1 protein levels in degrader-resistant A1847 (Q) and SUM159 (R) cells following PROTAC removal for 2 or 7 days. Blots are representative of 3 independent experiments. Related data are in fig. S2 and data file S2.
Figure 3.
Figure 3.. Blockade of MDR1 activity re-sensitizes degrader-resistant cells to PROTACs.
(A and B) Cell viability by CellTiter-Glo assay in parental and degrader-resistant A1847 (A) and SUM159 (B) cells transfected with control siRNA or siRNAs targeting ABCB1 and cultured for 120 hours. Data were analyzed as % of control, presented as means ± SD of 3 independent assays. ***P ≤0.001 by Student’s t-test. (C and D) Immunoblot analysis of degrader targets following ABCB1 knockdown in parental and degrader-resistant A1847 (C) and SUM159 (D) cells. Blots are representative, and densitometric analysis using ImageJ are means ± SD of 3 blots, each normalized to loading control, GAPDH. (E) Drug efflux activity, using the Rhodamine 123 efflux assay, in degrader-resistant cells after MDR1 inhibition by tariquidar (0.1 μM). Data are means ± SD of 3 independent experiments. ***P ≤0.001 by Student’s t-test. (F to H) Cell viability by CellTiter-Glo assay in parental and dBET6-R (F) or Thal-R (G) A1847 cells or MZ1-R SUM159 cells (H) treated with increasing concentrations of tariquidar. Data are % of DMSO control, presented as means ± SD of 3 independent assays. GI50 determined with Prism software. (I to K) Immunoblot analysis of degrader targets after MDR1 inhibition (tariquidar, 0.1 μM for 24 hours) in parental and degrader-resistant A1847 cells (I and J) and SUM159 (K) cells. Blots are representative, and densitometric analysis are means ± SD from 3 blots, each normalized to loading control, GAPDH. (L and M) 14-day colony formation assessed by crystal violet staining of (L) A1847 cells or (M) SUM159 cells treated with degrader (dBET6 or MZ1, respectively; 0.1 μM) and MDR1 inhibitor tariquidar (0.1 μM). Images are representative of 3 biological replicates. (N) Immunoblotting for MDR1 in SUM159 cells stably expressing FLAG-MDR1, after selection with hygromycin. (O) Long-term 14-day colony formation assay of SUM159 cells expressing FLAG-MDR1 were treated with DMSO, MZ1 (0.1 μM), or MZ1 and tariquidar (0.1 μM) for 14 days, assessed by crystal violet staining. Representative images of 3 biological replicates are shown. (P and Q) RT-PCR (P) and immunoblot (Q) analysis of ABCB1 mRNA and MDR1 protein levels, respectively, in parental or MZ1-R HCT116, OVCAR3 and MOLT4 cells. Blots are representative, and graphs present means ± SD of 3 independent experiments. ***P ≤0.001 by Student’s t-test.
Figure 4.
Figure 4.. Overexpression of MDR1 Conveys Intrinsic Resistance to Degrader Therapies in Cancer Cells
(A) Frequency of ABCB1 mRNA overexpression in a panel of cancer cell lines, obtained from cBioPortal for Cancer Genomics using Z-scores values of >1.2 for ABCB1 mRNA levels (30). (B) Immunoblot for MDR1 protein levels in a panel of 10 cancer cell lines. Blots are representative of 3 independent experiments. (C) Cell viability by CellTiter-Glo assay in cancer cell lines expressing high or low MDR1 protein levels and treated with Thal SNS 032 for 5 days. Data were analyzed as % of DMSO control, presented as means ± SD of 3 independent assays. GI50 were determined with Prism software. (D to F) Immunoblot analysis of CDK9 in MDR1-low (D) or MDR1-high (E) cell lines after Thal SNS 032 treatment for 4 hours. Blots are representative, and densitometric analysis using ImageJ are means ± SD from 3 blots, each normalized to loading control, GAPDH. DC50 determined with Prism. (G and H) Immunoblotting of control and MDR1-knockdown DLD-1 cells treated for 4 hours with increasing concentrations of Thal SNS 032 (indicated in H). Blots are representative, and densitometric analysis data are means ± SD from 3 blots, each normalized to loading control, GAPDH. DC50 determined with Prism. (I) Drug efflux activity using Rhodamine 123 efflux assays in DLD-1 cells treated with DMSO or 0.1 μM tariquidar. Data are mean ± SD of 3 independent experiments. ***P ≤0.001 by Student’s t-test. (J) Intracellular Thal SNS 032 levels, using the CRBN NanoBRET target engagement assay, in MDR1-overexpressing DLD-1 cells treated with DMSO or 0.1 μM tariquidar and increasing doses of Thal SNS 032. Data are % of DMSO control, presented as means ± SD of 3 independent assays. **P ≤0.01, ***P ≤0.001 by Student’s t-test. (K to N) Immunoblotting in DLD-1 cells treated with increasing doses of Thal SNS 032 (K and L) or dBET6 (M and N) alone or with tariquidar (0.1 μM) for 4 hours. Blots are representative, and densitometric analyses are means ± SD from 3 blots, each normalized to loading control, GAPDH. DC50 of Thal SNS 032 for CDK9 reduction (L) or of dBET6 for BRD4 reduction (N) determined with Prism. (O to T) Bliss synergy scores based on cell viability by CellTiter-Glo assay, colony formation, and immunoblotting in DLD-1 cells treated with the indicated doses of Thal SNS 032 (O to Q) or dBET6 (R to T) alone or with tariquidar. Cells were treated for 14 days for colony formation assays and 24 hours for immunblotting. Data are representative of and quantified from 3 experiments.
Figure 5.
Figure 5.. Re-purposing dual kinase/MDR1 inhibitors to overcome degrader resistance in cancer cells.
(A and B) Drug efflux activity by Rhodamine 123 efflux assays in degrader-resistant [dBET-R (A) or Thal-R (B)] A1847 cells after treatment with tariquidar, RAD001 or lapatinib (each 2 μM). Data are ± SD of 3 independent experiments. *P ≤0.05 by Student’s t-test. (C and D) CellTiter-Glo assay for cell viability of parental, dBET6-R or Thal-R A1847 cells treated with increasing concentrations of RAD001 (C) or lapatinib (D). Data were analyzed as % of DMSO control, presented as means ± SD of 3 independent assays. GI50 were determined with Prism software. (E to I) Immunoblot analysis of degrader targets in parental (E), dBET6-R (F and G) and Thal-R (H and I) A1847 cells treated with increasing concentrations of RAD001 or lapatinib for 4 hours Blots are representative, and densitometric analyses are means ± SD from 3 blots, each normalized to loading control, GAPDH. DC50 of dBET6 for BRD4 reduction (G) or of Thal SNS 032 for CDK9 reduction (I) determined with Prism. (J) Immunoblotting for cleaved PARP in dBET6-R or Thal-R A1847 cells treated with RAD001, lapatinib, or tariquidar (each 2 μM) for 24 hours. Blots are representative of 3 independent blots. (K to N) Immunoblotting for BRD4 in DLD-1 cells treated with increasing doses of dBET6 alone or in combination with either RAD001 or lapatinib (each 2 μM; K and L) or KU-0063794 or afatinib (each 2 μM; M and N) for 4 hours. Blots are representative of 3 independent experiments, and in (L) are means ± SD from 3 blots, each normalized to loading control, GAPDH. DC50 for BRD4 reduction (L) determined in PRISM. (O) Colony formation by DLD-1 cells treated with DMSO, dBET6 (0.1 μM), lapatinib (2 μM), afatinib (2 μM), RAD001 (2 μM), KU-0063794 (2 μM), or the combination of inhibitor and dBET6 for 14 days. Images representative of 3 independent assays. (P and Q) Immunoblotting for CDK9 in DLD-1 cells treated with increasing doses of Thal SNS 032 and/or RAD001 (2 μM) or lapatinib (2 μM) for 4 hours. Blots are representative, and densitometric analysis are means ± SD from 3 blots, each normalized to loading control, GAPDH. DC50 for CDK9 reduction determined with Prism (Q). (R) Colony formation in DLD-1 cells treated with DMSO, Thal SNS 032 (0.5 μM), lapatinib (2 μM), and/or RAD001 (2 μM) as indicated for 14 days. Images representative of 3 independent assays.
Figure 6.
Figure 6.. Combining MEK1/2 degraders with lapatinib synergistically kill MDR1-overexpressing KRAS-mutant CRC cells and tumors.
(A and B) ABCB1 expression in KRAS-mutant CRC cell lines from c-Bioportal (30) (A) and MDR1 abundance in select KRAS-mutant CRC cell lines (B). (C) Cell viability assessed by CellTiter-Glo in CRC cells treated with increasing doses of MS432 for 5 days, analyzed as % of DMSO control. GI50 determined with Prism software. (D) Colony formation by CRC cells 14 days after treatment with 1 μM MS432. (E) MEK1/2 protein levels assessed by immunoblot in CRC lines SKCO1 (low MDR1) or LS513 (high MDR1) treated with increasing doses of MS432 for 4 hours. (F) Rhodamine 123 efflux in LS513 cells treated with DMSO, 2 μM tariquidar, or 2 μM lapatinib. (G and H) Immunoblotting analysis in LS513 cells treated with increasing doses of MS432 alone or in combination with tariquidar (0.1 μM) or lapatinib (5 μM) for 24 hours. DC50 for MEK1 levels determined with Prism. (I) Immunoblotting in LS513 cells treated with DMSO, PD0325901 (0.01 μM), lapatinib (5 μM), or the combination for 48 hours. (J and K) Immunoblotting in LS513 cells treated either with DMSO, MS432 (1 μM), or tariquidar (0.1 μM; J) or lapatinib (5 μM; K), alone or in combination. (L) Bliss synergy scores determined from cell viability assays (CellTiter-Glo) in LS513 cells treated with increasing concentrations of MS432, lapatinib, or the combination. (M and N) Colony formation by LS513 cells (M) and others (N) treated with DMSO, lapatinib (2 μM), MS432 (1 μM), or the combination for 14 days. (O and P) Immunoblotting in LS513 cells treated with increasing doses of MS934 alone (O) or combined with lapatinib (5 μM; P) for 24 hours. (Q and R) Tumor volume of LS513 xenografts (Q) and the body weights of the tumor-bearing nude mice (R) treated with vehicle, 50 mg/kg MS934, 100 mg/kg lapatinib, or the combination. N=5 mice per treatment group. In (A to R), blots and images are representative of 3 independent experiments, and quantified data are mean ± SD (SEM in Q and R) of 3 independent experiments; ***P ≤0.001 by Student’s t-test.
Figure 7.
Figure 7.. Lapatinib treatment improves KRASG12C degrader therapies in MDR1-overexpressing CRC cell lines.
(A and B) Colony formation by SW1463 (A) or SW837 (B) cells treated with DMSO, LC-2 (1 μM), or MRTX849 (1 μM) for 14 days. Images representative of 3 independent assays. (C to E) Immunoblotting in SW1463 cells (C and D) and SW837 cells (E) treated with DMSO, LC-2 (1 μM), tariquidar (0.1 μM; C), or lapatinib (5 μM; D and E) alone or in combination for 48 hours. Blots are representative of 3 independent experiments. (F and G) Bliss synergy scores based on CellTiter-Glo assay for cell viability of SW1463 (F) or SW837 (G) cells treated with increasing concentrations of LC-2, lapatinib, or the combination. Data are 3 experiments SD. (H and I) colony formation SW1463 (H) or SW837 (I) cells treated as indicated (-, DMSO; LC-2, 1 μM; lapatinib, 2 μM; tariquidar, 0.1 μM) for 14 days. Images representative of 3 independent assays. (J) Rationale for combining lapatinib with MEK1/2 or KRASG12C degraders in MDR1-overexpressing CRC cell lines. Simultaneous blockade of MDR1 and ErbB receptor signaling overcomes degrader resistance as well as ErbB-receptor kinome reprogramming, resulting in sustained inhibition of KRAS effector signaling.

References

    1. Neklesa TK, Winkler JD, Crews CM, Targeted protein degradation by PROTACs. Pharmacol. Ther. 174, 138–144 (2017). - PubMed
    1. Bondeson DP, Smith BE, Burslem GM, Buhimschi AD, Hines J, Jaime-Figueroa S, Wang J, Hamman BD, Ishchenko A, Crews CM, Lessons in PROTAC Design from Selective Degradation with a Promiscuous Warhead. Cell Chemical Biology 25, 78–87.e75 (2018). - PMC - PubMed
    1. Lai AC, Crews CM, Induced protein degradation: an emerging drug discovery paradigm. Nat Rev Drug Discov 16, 101–114 (2017). - PMC - PubMed
    1. Nalawansha DA, Crews CM, PROTACs: An Emerging Therapeutic Modality in Precision Medicine. Cell Chem Biol 27, 998–1014 (2020). - PMC - PubMed
    1. Yu F, Cai M, Shao L, Zhang J, Targeting Protein Kinases Degradation by PROTACs. Frontiers in Chemistry 9, (2021). - PMC - PubMed

Publication types