. 2022 Sep 15;185(19):3520-3532.e26.
doi: 10.1016/j.cell.2022.07.019. Epub 2022 Aug 29.

Accurate de novo design of membrane-traversing macrocycles

Affiliations

Accurate de novo design of membrane-traversing macrocycles

Gaurav Bhardwaj et al. Cell. .

Abstract

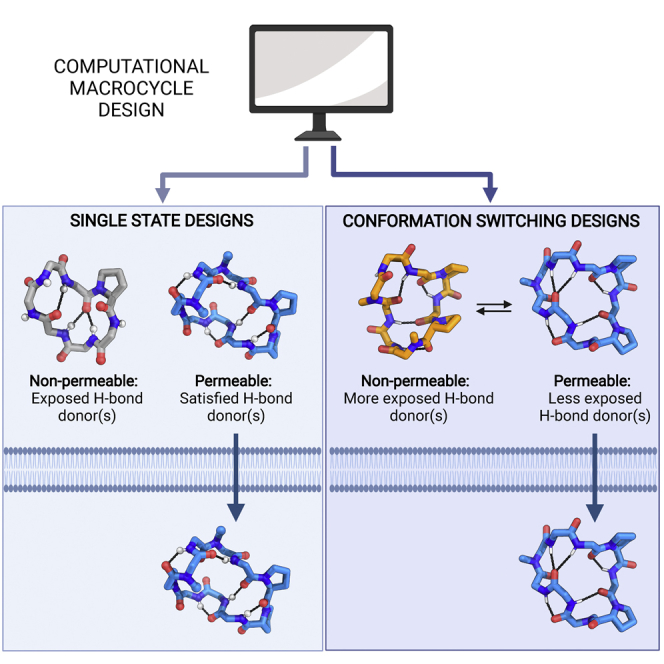
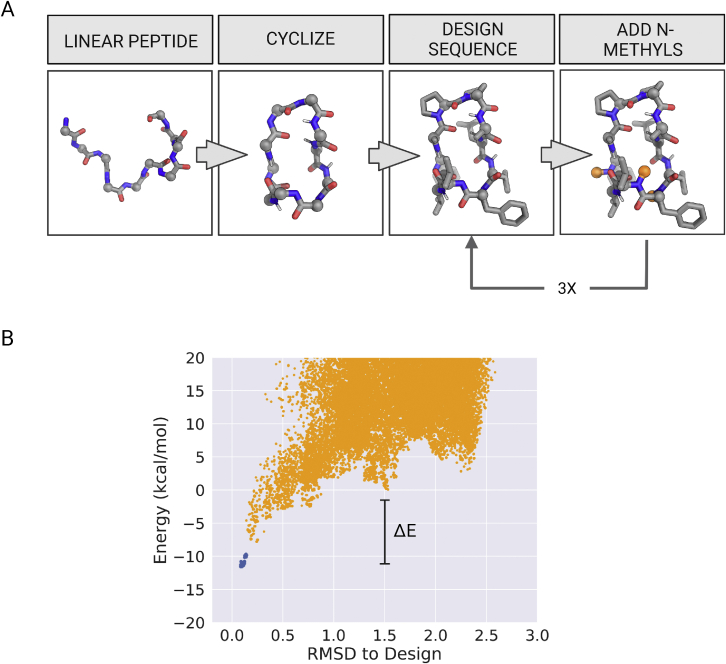
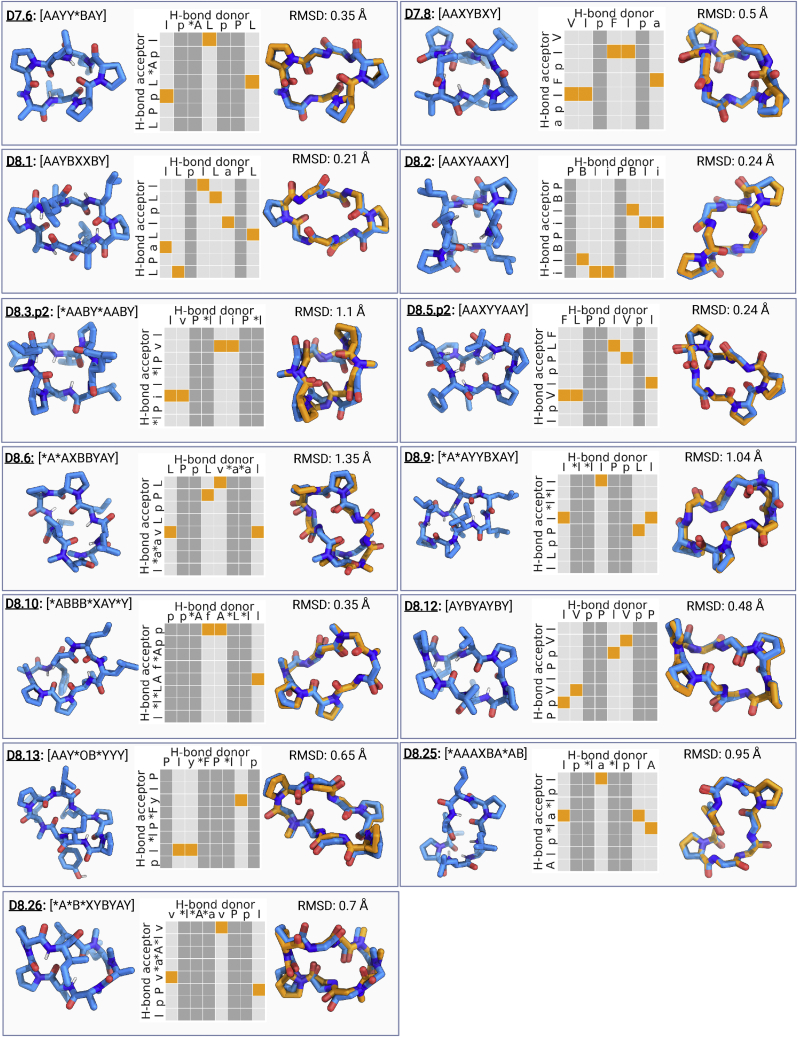
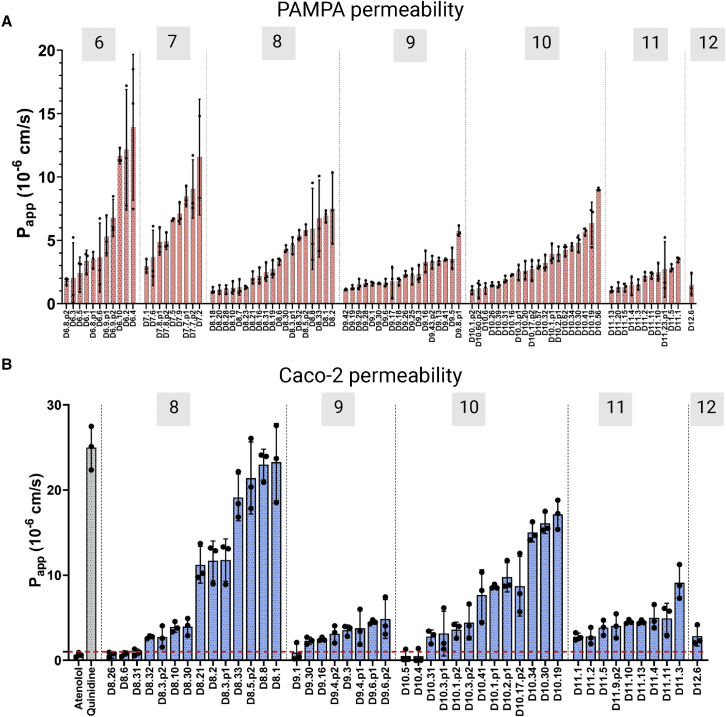
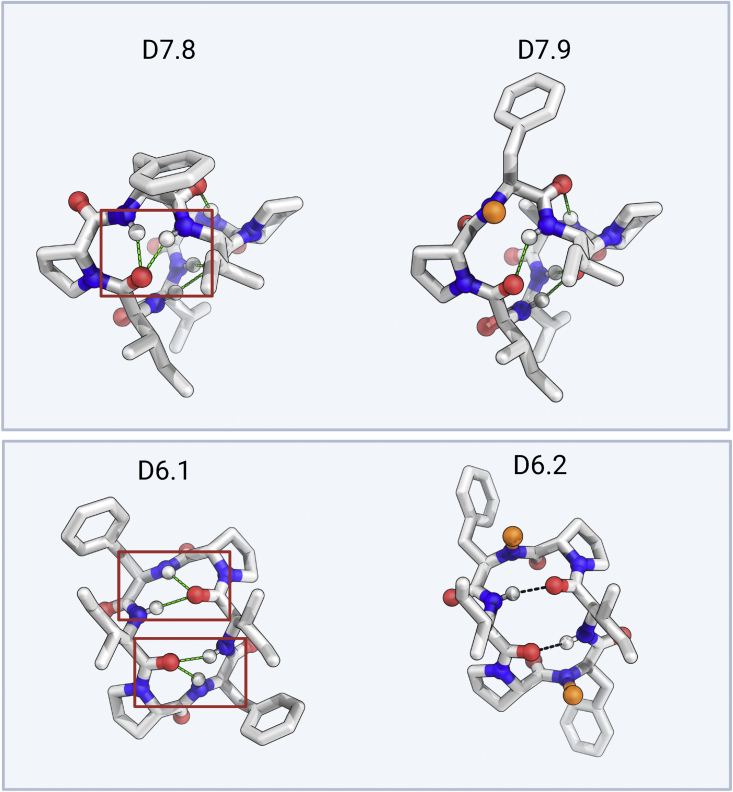
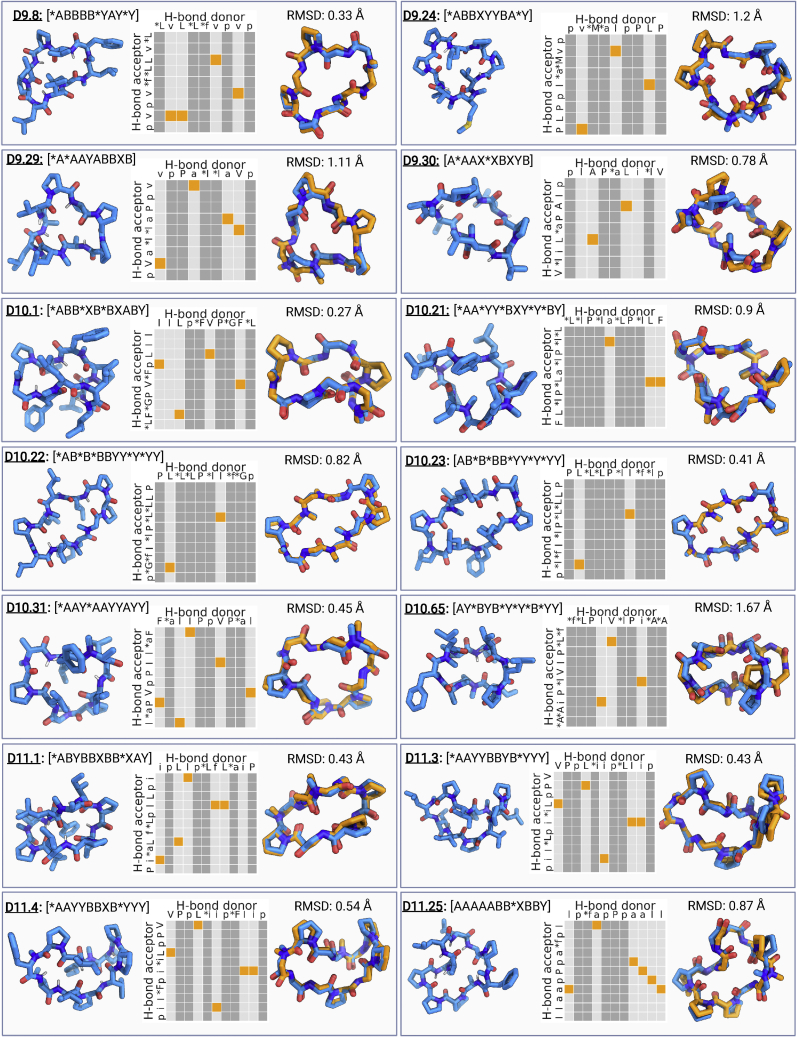
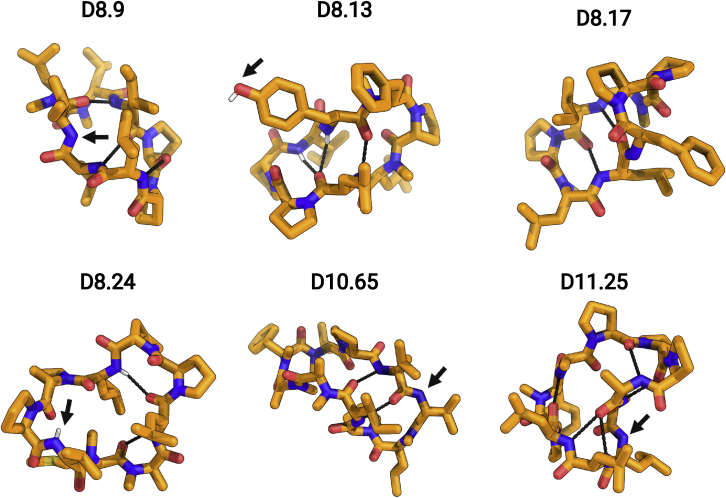
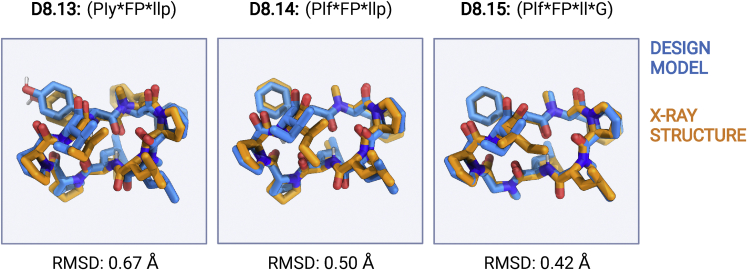
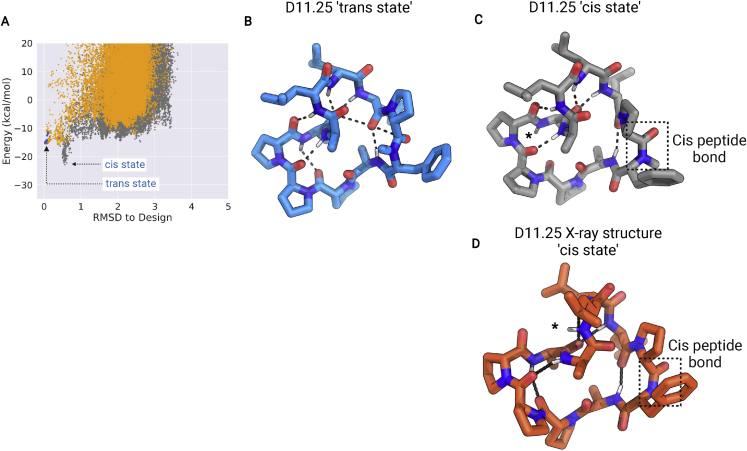
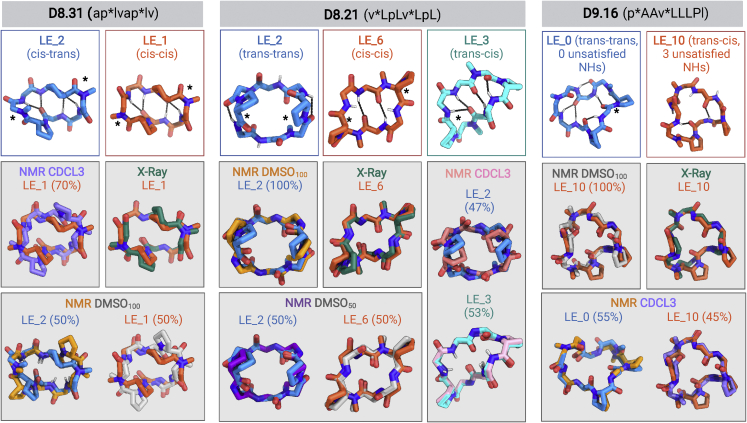
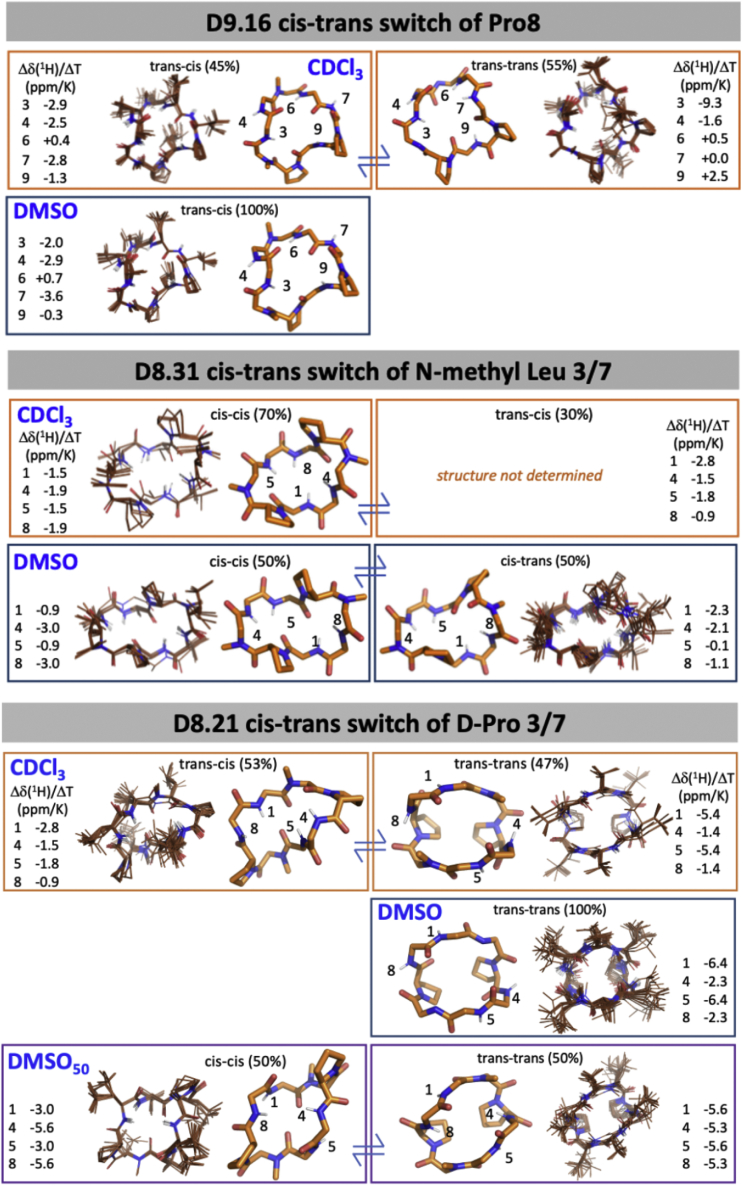
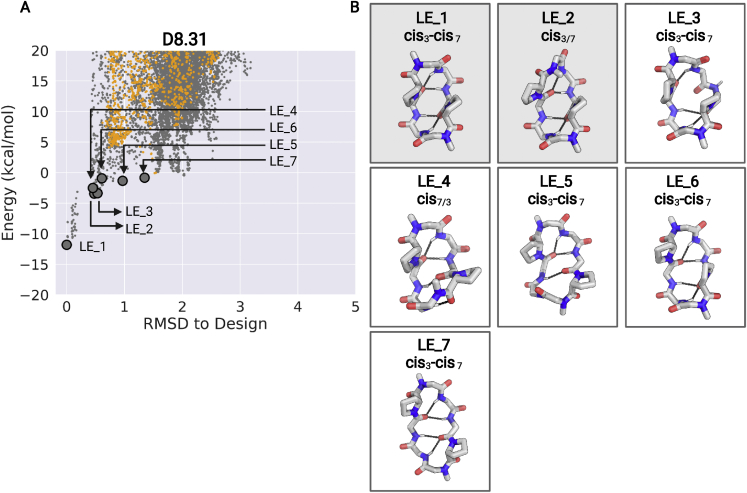
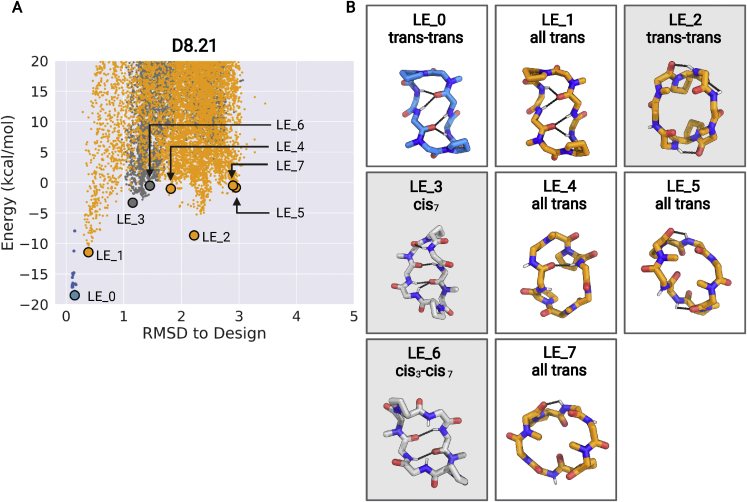
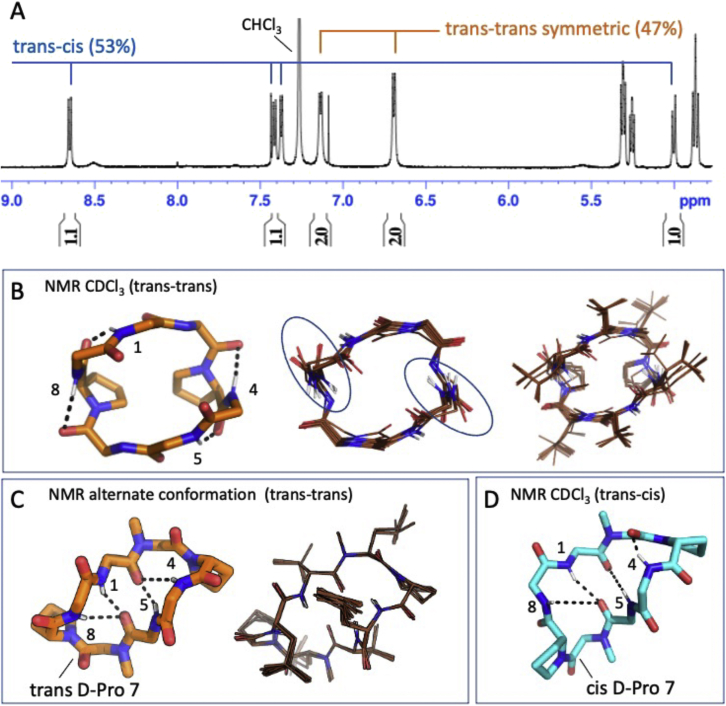
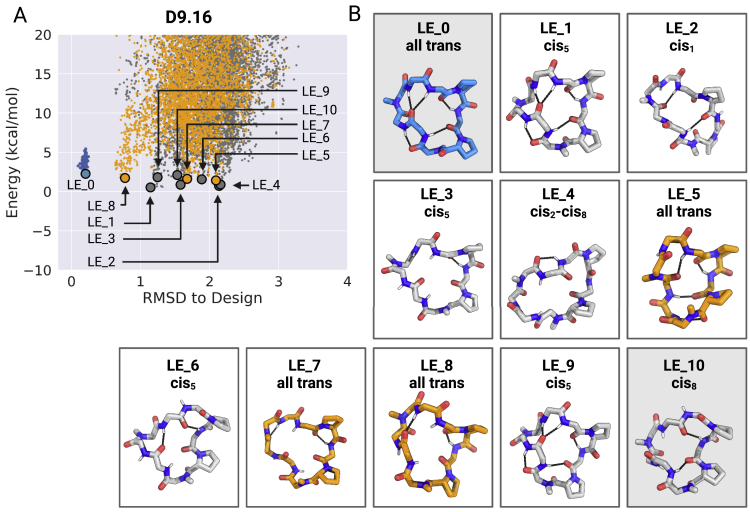
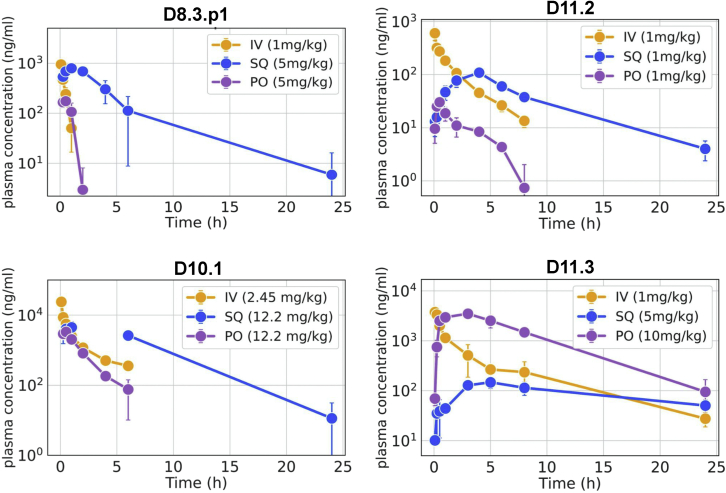
We use computational design coupled with experimental characterization to systematically investigate the design principles for macrocycle membrane permeability and oral bioavailability. We designed 184 6-12 residue macrocycles with a wide range of predicted structures containing noncanonical backbone modifications and experimentally determined structures of 35; 29 are very close to the computational models. With such control, we show that membrane permeability can be systematically achieved by ensuring all amide (NH) groups are engaged in internal hydrogen bonding interactions. 84 designs over the 6-12 residue size range cross membranes with an apparent permeability greater than 1 × 10⁻⁶ cm/s. Designs with exposed NH groups can be made membrane permeable through the design of an alternative isoenergetic fully hydrogen-bonded state favored in the lipid membrane. The ability to robustly design membrane-permeable and orally bioavailable peptides with high structural accuracy should contribute to the next generation of designed macrocycle therapeutics.

Keywords: computational design; membrane permeability; oral bioavailability; peptide design.


Conflict of interest statement

Declaration of interests V.K.M. is a cofounder and shareholder of Menten AI, a biotechnology company. G.T.M. is a cofounder of Nexomics Biosciences, Inc., a structural biology contract research organization. A provisional patent covering the membrane-permeable peptides described in this paper has been filed by the University of Washington, Seattle. G.B., L.S., and D.B. are cofounders and shareholders of an early-stage biotechnology company that has licensed the provisional patent.

Figures

None
Graphical abstract
Figure S1
Figure S1
Design and selection of membrane-permeable peptides, related to Figures 1 and 3 and STAR Methods (A) Overall schematic of the in silico pipeline for the design of membrane-permeable peptides. Design process starts with a linear polyglycine peptide chain that is cyclized using Rosetta generalized kinematic closure (genKIC) protocol. Iterative rounds of amino acid sequence design and N-methylation of non-hydrogen-bonded NH groups are performed to design low-energy macrocycles with no unsatisfied backbone NH groups. The process is repeated to sample 105–106 design models that are clustered to identify permeable macrocycles with diverse shapes and sizes. (B) An example energy versus RMSD to design plot from structure prediction runs using Rosetta simple_cycpep_predict application. Diverse conformations for a given amino acid sequence are generated using generalized kinematic closure (genKIC) protocol and energy-minimized using Rosetta FastRelax protocol. Each orange point represents an independently predicted structure. Blue dots represent the local minimization of the designed macrocycle structure. Landscapes that funnel into the design structure as the lowest energy structure and have a big energy gap (ΔE) between the designed fold and other unfolded states are selected for experimental characterization.
Figure 1
Figure 1
Computational design and structure validation of 6–8 amino acid macrocycles Structural validation of computationally designed macrocycles. Each panel shows the design model and torsion bin string describing the design model (left), hydrogen bonding pattern for the design model (middle), and superposition between the design model (blue) and the X-ray structure (orange) (right). For hydrogen bonding graphs, the orange boxes highlight the designed intramolecular hydrogen bonds. Amino acids without a backbone hydrogen bond donor (proline, D-proline, and N-methylated amino acids) are marked by darker gray columns. Sidechains for non proline residues not shown for clarity in the superposition graphs. RMSD between the design model and X-ray structure was calculated over all backbone heavy atoms (C, CA, N, O, and CN). in the macrocycle sequence denotes the N-methylated amino acid positions and lower case denotes the D-amino acids. See also Table S1, Figure S1, Figure S2, Figure S3, Figure S4, Figure S10, and Data S1 and S2.
Figure 2
Figure 2
Permeability measurements of computationally designed macrocycles in PAMPA and Caco-2 assays (A) Apparent permeability (Papp) of 6–12 amino acid macrocycles in PAMPA assay. Peptides are grouped based on sequence length. Isobaric peaks (denoted p1 and p2) were seen for some peptides during purification and were assayed separately. Bar height: average Papp from three replicates; error bars: standard deviation calculated from three replicates. (B) Apparent permeability (Papp) of designed 8–12 amino acid macrocycles (salmon-colored bars) measured in the apical to the basal direction in the Caco-2 assays. Papp for quinidine and atenolol used as negative and positive controls (gray-colored bars). Bar height: average Papp from three replicates; error bars: standard deviation calculated from three replicates. See also Data S3.
Figure S2
Figure S2
N-methylation of geometrically strained turn types, related to Figure 1 Examples of geometrically strained arrangement of overlapping gamma and beta turns seen in some of the design models. For such designs, variants with N-methylated middle residue were also generated and tested experimentally. N-methyls are shown as orange. Intramolecular hydrogen bonding interactions are shown as green dashes.
Figure 3
Figure 3
Computational design and structure validation of 9–12 amino acid macrocycles Structural validation of computationally designed macrocycles. Each panel shows the design model and torsion bin string describing the design model (left), hydrogen bonding pattern for the design model (middle), and superposition between the design model (blue) and the X-ray structure (orange) (right). For hydrogen bonding graphs, the orange boxes highlight the designed intramolecular hydrogen bonds. Amino acids without a backbone hydrogen bond donor (proline, D-proline, and N-methylated amino acids) are marked by darker gray columns. Side chains for non proline residues not shown for clarity in the superposition graphs. RMSD between the design model and X-ray structure was calculated over all the backbone heavy atoms (C, CA, N, O, and CN). in macrocycle sequence denotes the N-methylated amino acid positions and lowercase denotes the D-amino acids. See also Table S2, Figures S1, S3, and S5, and Data S1 and S2.
Figure S3
Figure S3
Effect of exposed and unsatisfied polar groups on macrocycle permeability, related to Figures 1 and 3 Designs with exposed polar NH or OH groups in the X-ray crystal structures (orange sticks) are not permeable or show low permeability in PAMPA. Dashed black lines denote the intramolecular hydrogen bonds. The exposed NH or OH groups are denoted by the arrows. See Data S2 and S3 for design models, structures, and permeability data.
Figure S4
Figure S4
Differences in permeability of macrocycles with cis-peptide bonds, related to Figure 1 Superposition between the designed structure (blue sticks) and X-ray structure (orange sticks) of three closely related cis-peptide bond-containing designs, D8.13 (left panel), D8.14 (middle panel), and D8.15 (right panel). All three design models match closely (RMSD over all backbone atoms [N, CA, C, O, and CN] < 1.0 Å) with respective X-ray structures. All three design models feature a cis-peptide bond in the validated structures. However, the D8.13 is not permeable in PAMPA, while both D8.14 and D8.15 show significant permeability (Papp > 1 × 10−7 cm/s), indicating that cis-peptide bond alone is not enough to drive permeability in these macrocycles.
Figure S5
Figure S5
ccis-trans isomerization of the peptide bonds generates alternative low-energy states, related to Figure 3 (A) Structure prediction calculations for the design D11.25 sequence show two low-energy states. Orange points: conformations with no cis-peptide bonds; gray points: predicted conformations with at least one cis-peptide bonds; and blue points: conformations generated by the local energy minimization of the design model. (B and C) (B) Lowest energy “trans” state with all peptide bonds in trans conformation, (C) lowest energy “cis” state with the N-methylated amino acid in the cis conformation. (D) X-ray structure for D11.25 matches the cis state and exposed NH group from a D-leucine. The position of cis-peptide bond is highlighted in the dashed square. in the cis state denotes the position of the unsatisfied NH groups.
Figure 4
Figure 4
Design and structural characterization of conformation switching macrocycles Design models and experimentally determined structures (X-ray and NMR) for different conformational states of designs D8.31 (left), D8.21 (middle), and D9.16 (right). The design model and predicted low-energy states are shown in the top row. The superposition between the predicted low-energy states and the experimental structures is shown in the gray boxes. The solvent conditions for the NMR structures and low-energy states in superposition plots are indicated by similar colors in the labels and structures. In conditions with multiple conformations, the relative percentage of each conformation in the solution is also indicated. All three designs show solvent-dependent changes in the populations and switching between at least two different conformations. The conformational switch in D8.31 does not change the number of unsatisfied NHs, but for both D8.21 and D9.16, the states with fewer unsatisfied NHs are favored in the nonpolar solvents. See also Tables S3 and S4, and Figure S6, Figure S7, Figure S8, Figure S9, Figure S10.
Figure S6
Figure S6
NMR structures in different solvents, related to Figure 4 NMR-derived structures in the indicated solvents d6-DMSO, CDCl3, or 50:50 d6-DMSO/H2O (DMSO50) are shown for D9.16, D8.31, and D8.21. The overlay structure of the ensemble of 20 lowest energy structures is shown along with the backbone structure of the medoid conformation with NH protons labeled. The amide proton temperature coefficients Δδ(1H)/ΔT are given for each of the HN resonances in each conformation. Less negative coefficients indicate increased hydrogen bond propensity and correlate with hydrogen bonds in the structures. In general, upon increasing temperature, amide 1H chemical shifts move upfield, which is attributed to a lengthening of the hydrogen bond and decreased shielding from the hydrogen bond acceptor (Baxter and Williamson, 1997). Large changes in chemical shift give large negative temperature coefficients and indicate solvent exposed or weakly hydrogen-bonded NHs. It was empirically found that for proteins in aqueous solution that amide protons with Δδ(1H)/ΔT that are more positive than −4.6 ppm/K (less negative and even sometimes positive) are indicative of intramolecular hydrogen bonds (Cierpicki and Otlewski, 2001). For cyclic peptides, temperature coefficients have been used as a measure of hydrogen bonding potential and correlated with MD simulations and predicted structures in aqueous solution as well as in chloroform and DMSO (Wang et al., 2015). In most cases, the NOESY or ROESY data with the 3Jhnha coupling-derived dihedral restraints was sufficient to give a converged structure for the peptides. However, in the case of the trans-trans variant of D8.21, the symmetry and the more open conformation with fewer NOEs did not give a unique conformational solution. In these cases, the conformation that best correlated the temperature coefficients was selected.
Figure S7
Figure S7
Low-energy structural clusters for design D8.31, related to Figure 4 (A) The 250 lowest energy predicted structures for D8.31 were selected and clustered using the Rosetta energy_based_clustering application. The cluster naming (LE_X) is based on the ranking of the lowest energy member from each cluster. The lowest energy structure from each identified cluster is labeled on the energy versus RMSD plot. Orange points: predicted structures with no cis-peptide bond; Gray points: predicted structures with at least one cis-peptide bond. (B) Lowest energy member from each cluster is shown in the stick representation. Position of cis-peptide bonds indicated in labels. Side chains for non proline (or D-proline) positions are not shown for clarity. The boxes with gray background denote the structures that match the X-ray crystal or the NMR structures.
Figure S8
Figure S8
Low-energy structural clusters for design D8.21, related to Figure 4 (A) The 500 lowest energy predicted structures for D8.21 were selected and clustered using the Rosetta energy_based_clustering application. The cluster naming (LE_X) is based on the ranking of the lowest energy member from each cluster. The lowest energy structure from each identified cluster is labeled on the energy versus RMSD plot. Orange points: predicted structures with no cis-peptide bond; gray points: predicted structures with at least one cis-peptide bond; blue points: structures obtained after local minimization of the design model (LE_0). (B) Lowest energy member from each cluster is shown in the stick representation. The color of stick representation is based on the presence or absence of any cis-peptide bond in the structure. Orange: structures with no cis-peptide bonds; gray: structures with at least one cis-peptide bond; blue: design model. Position of cis-peptide bonds indicated in labels. Side chains for non proline (or D-proline) positions are not shown for clarity. The boxes with gray background denote the structures that match the X-ray crystal or the NMR structures.
Figure S9
Figure S9
NMR structures of D8.21 have conformational ambiguity, related to Figure 4 (A) 1D 1H NMR spectrum of D8.21 in CDCl3 collected at 600 MHz and 293 K. Amide 1H peaks for each conformation are indicated. (B and C) (B) The trans-trans NMR structure (47% population) in CDCl3 that best matches the NMR data. It has an “open” conformation with only surface hydrogen bonds and buried but unsatisfied NHs and is similar to the trans-trans conformation observed in DMSO and DMSO-water. A representative member of this ensemble (left panel) shows four surface hydrogen bonds, whereas the ensemble of 20 structures (backbone—middle panel; backbone plus sidechain—right panel) shows the variability in orientations of the NH donor and carbonyl acceptor conformations along with buried, unsatisfied NHs. (B) An alternate “closed” trans-trans conformation. In order to assess whether the NMR data obtained for D8.21 in CHCl3 could possibly be fit to a more closed conformation with buried hydrogen bonds, we also used Cyana to reassign the ROESY data subject to restraints imposed for the four specific hydrogen bonds observed in the “closed” trans-cis conformation (47% in CHCl3), which are also observed in the designed and predicted low-energy trans-trans state (design model and LE_1 in Figure S8). Although the open trans-trans conformation (B) fits the NMR ROESY and amide temperature coefficient data better than the closed conformation, the alternate closed trans-trans conformation (C) cannot be ruled out. This ambiguity is due primarily to the chemical shift degeneracy that results from the repetitive 4-residue sequence (vLpL)2 and the symmetry of this conformation. The assignment of ROEs between degenerate/symmetric chemical shifts has multiple possibilities. For example, the assignment of ROEs to short distances between D-Pro 3 and D-Pro 7 rings in the open conformation is ambiguous because they are indistinguishable from intraresidue D-proline peaks. For the closed conformation, the D-Val 1 and 5 HNs have a characteristic short distance that is not observable in the ROESY data due to their degenerate chemical shifts. The alternative assignments of the ROEs by Cyana are based on preliminary structures and can be influenced by one or two manual restraints guiding it toward one or the other conformation. (D) The trans-cis conformation determined from NMR data in CHCl3 (53% population).
Figure S10
Figure S10
Low-energy structural clusters for design D9.16, related to Figure 4 (A) The 250 lowest energy predicted structures for D9.16 were selected and clustered using the Rosetta energy_based_clustering application. The cluster naming (LE_X) is based on the ranking of the lowest energy member from each cluster. The lowest energy structure for 10 lowest energy clusters is labeled on the energy versus RMSD plot. Orange points: predicted structures with no cis-peptide bond; gray points: predicted structures with at least one cis-peptide bond; blue points: structures obtained after local minimization of the design model (LE_0). (B) Lowest energy member from each of the 10 lowest energy clusters is shown in the stick representation. The color of stick representation is based on the presence or absence of any cis-peptide bond in the structure. Orange: structures with no cis-peptide bonds; gray: structures with at least one cis-peptide bond; blue: design model. Position of cis-peptide bonds indicated in labels. Side chains for non proline (or D-proline) positions are not shown for clarity. The boxes with gray background denote the structures that match the X-ray crystal or the NMR structures.
Figure 5
Figure 5
Designed macrocycles are orally bioavailable in vivo in rodent models Plasma concentration of unmodified full-length peptides measured after intravenous (IV), subcutaneous (SQ), and oral (PO) administration in mice (D8.3.p1, D10.1, and D11.3) and rats (D11.2) (n = 3 mice per dosing route for D8.3.p1, D10.1, and D11.3 and n = 3 rats per dosing route for D11.2). D8.3.p1 and D10.1 were studied in female BALB/c mice, D11.2 was studied in male Sprague Dawley (SD) rats, and D11.3 was studied in male swiss albino mice. See also Data S5.

Comment in

  • Predicting permeable macrocycles.
    Villanueva MT. Villanueva MT. Nat Rev Drug Discov. 2022 Nov;21(11):798. doi: 10.1038/d41573-022-00166-3. Nat Rev Drug Discov. 2022. PMID: 36192644 No abstract available.

References

    1. Adolf-Bryfogle, J., Labonte, J.W., Kraft, J.C., Shapovalov, M., Raemisch, S., Lütteke, T., DiMaio, F., Bahl, C.D., Pallesen, J., King, N.P., et al. (2021). Growing Glycans in Rosetta: Accurate de novo glycan modeling, density fitting, and rational sequon design. - PMC - PubMed
    1. Alford R.F., Leaver-Fay A., Jeliazkov J.R., O’Meara M.J., DiMaio F.P., Park H., Shapovalov M.V., Renfrew P.D., Mulligan V.K., Kappel K., et al. The Rosetta All-Atom Energy Function for Macromolecular Modeling and Design. J. Chem. Theory Comput. 2017;13:3031–3048. - PMC - PubMed
    1. Baxter N.J., Williamson M.P. Temperature dependence of 1H chemical shifts in proteins. J. Biomol. NMR. 1997;9:359–369. - PubMed
    1. Bhardwaj G., Mulligan V.K., Bahl C.D., Gilmore J.M., Harvey P.J., Cheneval O., Buchko G.W., Pulavarti S.V.S.R.K., Kaas Q., Eletsky A., et al. Accurate de novo design of hyperstable constrained peptides. Nature. 2016;538:329–335. - PMC - PubMed
    1. Bockus A.T., Lexa K.W., Pye C.R., Kalgutkar A.S., Gardner J.W., Hund K.C.R., Hewitt W.M., Schwochert J.A., Glassey E., Price D.A., et al. Probing the physicochemical boundaries of cell permeability and oral bioavailability in lipophilic macrocycles inspired by natural products. J. Med. Chem. 2015;58:4581–4589. - PubMed

Publication types