. 2022 Sep 15;185(19):3501-3519.e20.
doi: 10.1016/j.cell.2022.08.005. Epub 2022 Aug 29.

Microbiota imbalance induced by dietary sugar disrupts immune-mediated protection from metabolic syndrome

Affiliations

Microbiota imbalance induced by dietary sugar disrupts immune-mediated protection from metabolic syndrome

Yoshinaga Kawano et al. Cell. .

Abstract

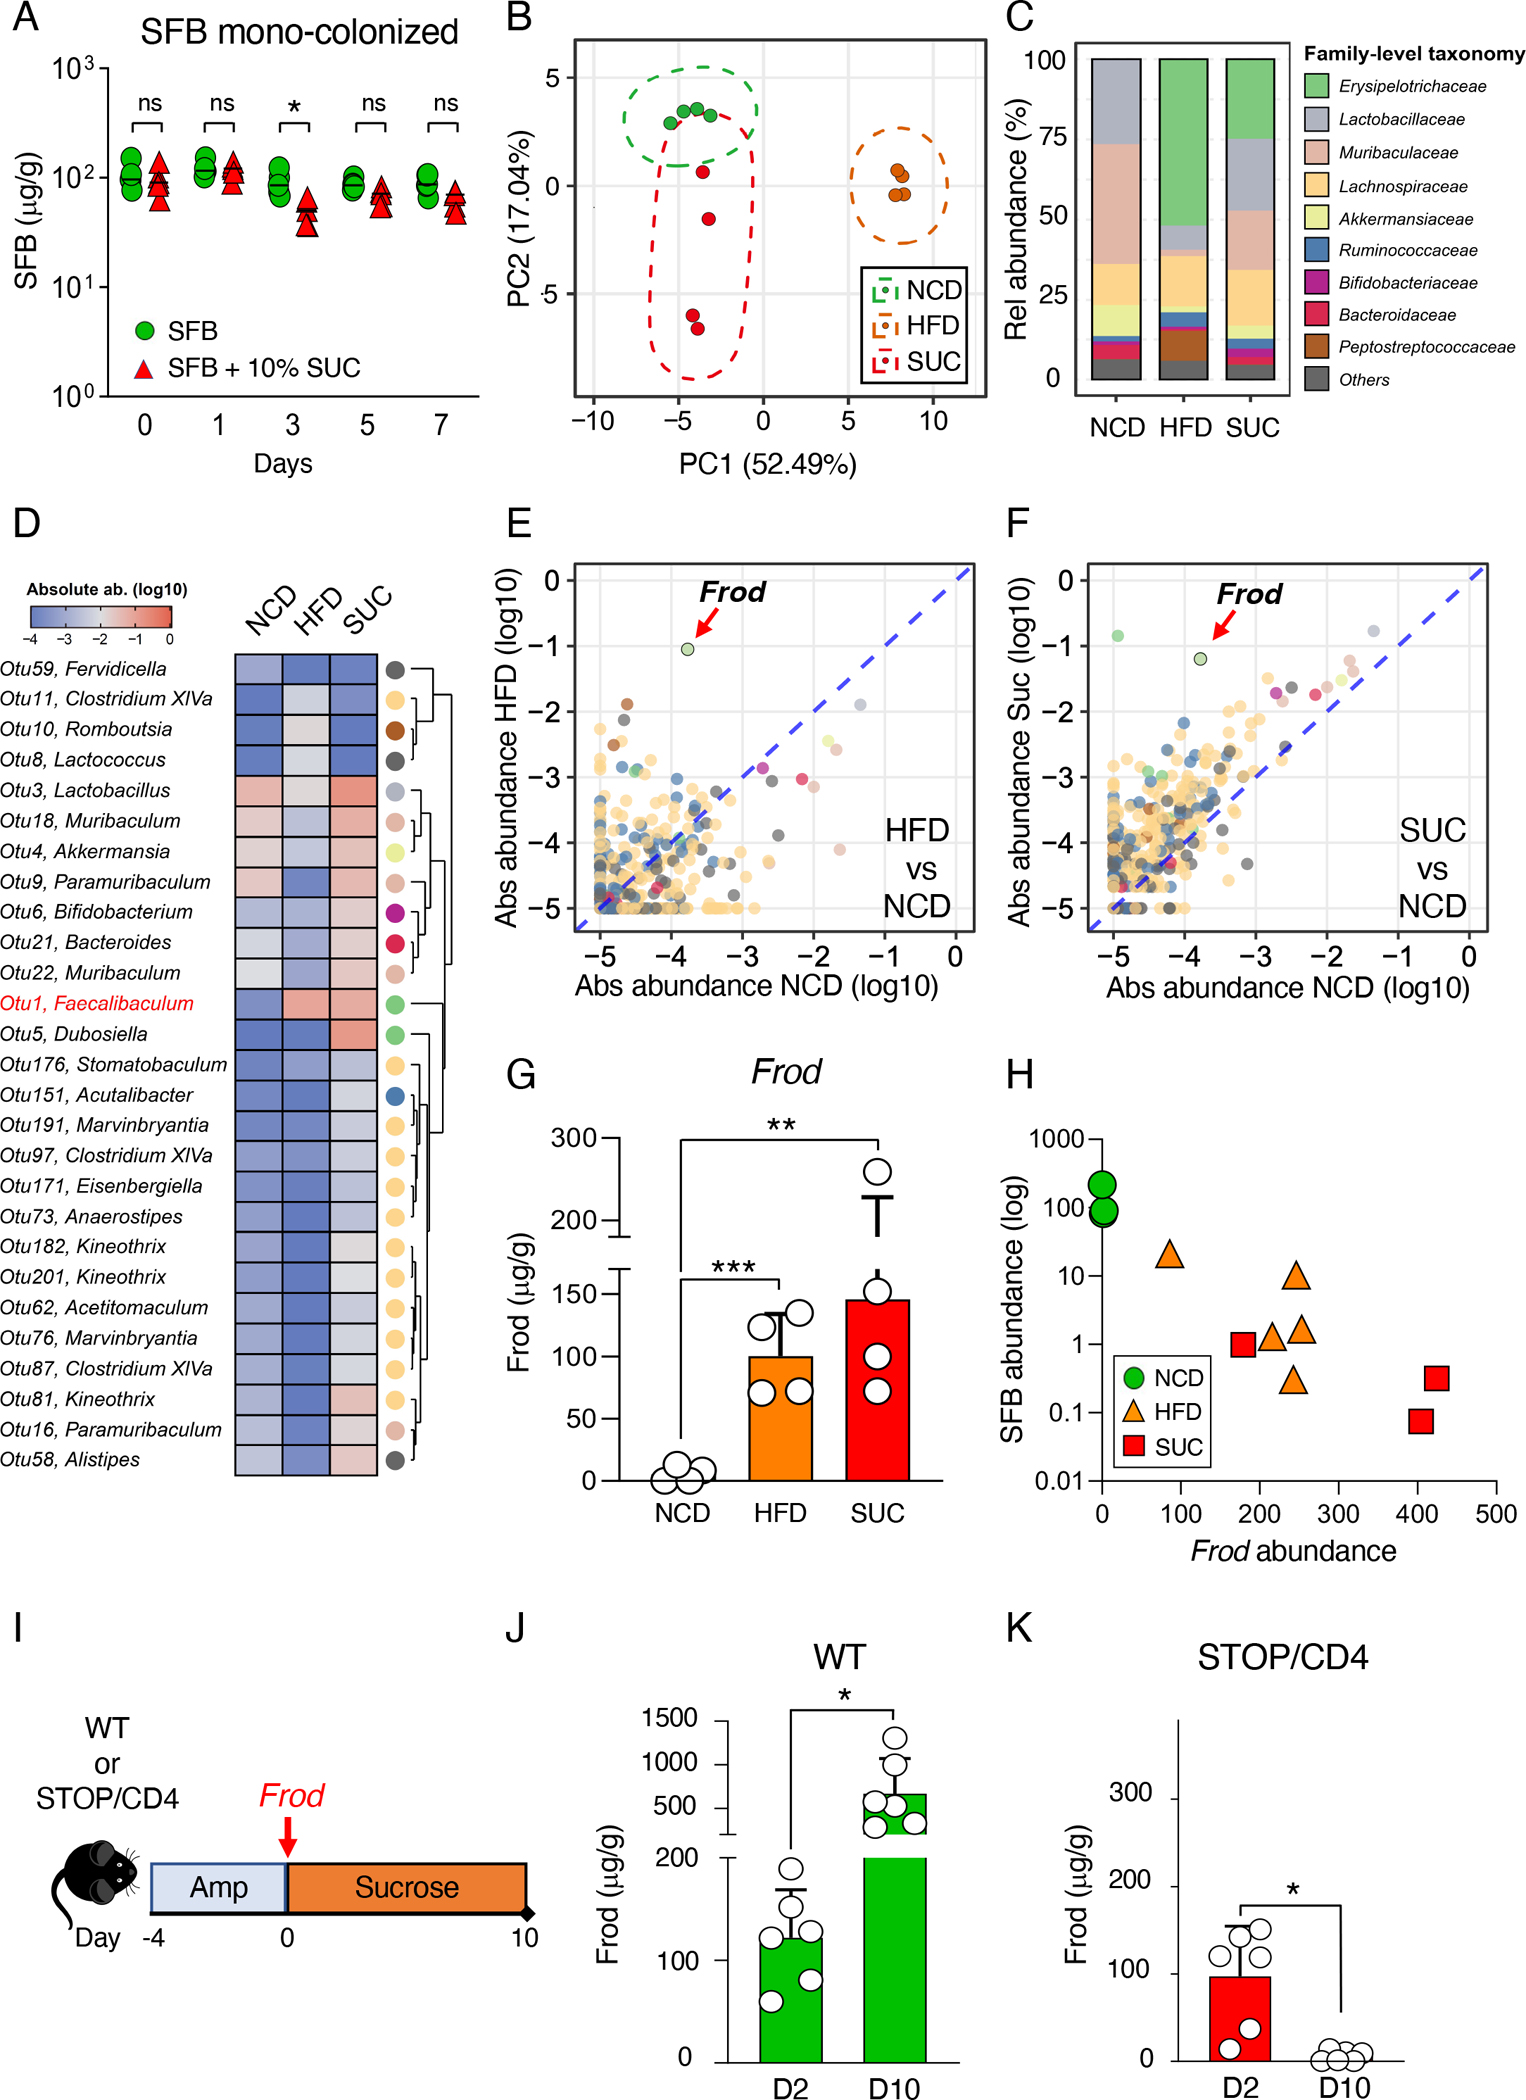
How intestinal microbes regulate metabolic syndrome is incompletely understood. We show that intestinal microbiota protects against development of obesity, metabolic syndrome, and pre-diabetic phenotypes by inducing commensal-specific Th17 cells. High-fat, high-sugar diet promoted metabolic disease by depleting Th17-inducing microbes, and recovery of commensal Th17 cells restored protection. Microbiota-induced Th17 cells afforded protection by regulating lipid absorption across intestinal epithelium in an IL-17-dependent manner. Diet-induced loss of protective Th17 cells was mediated by the presence of sugar. Eliminating sugar from high-fat diets protected mice from obesity and metabolic syndrome in a manner dependent on commensal-specific Th17 cells. Sugar and ILC3 promoted outgrowth of Faecalibaculum rodentium that displaced Th17-inducing microbiota. These results define dietary and microbiota factors posing risk for metabolic syndrome. They also define a microbiota-dependent mechanism for immuno-pathogenicity of dietary sugar and highlight an elaborate interaction between diet, microbiota, and intestinal immunity in regulation of metabolic disorders.

Keywords: CD36; IL-17; Th17 cells; lipid absoprtion; metabolic syndrome; micobiota; mucosal immunity; obesity; segmented filamentous bacteria; sugar.


Conflict of interest statement

Declaration of interests H.H.W. is a scientific advisor of SNIPR Biome, Kingdom Supercultures, and Fitbiomics, who were not involved in the study. K.H. is a scientific advisory board member of Vedanta Biosciences and 4BIO CAPITAL, who were not involved in the study.

Figures

Figure 1.
Figure 1.. HFD disrupts intestinal immune homeostasis by eliminating Th17-inducing microbiota
(A-F) Flow cytometry for T cell transcription factors (A-D) and cytokines (E, F) in SI LP CD4 T cells in C57BL/6 mice fed NCD or HFD for 4 weeks. Plots gated on TCRβ+CD4+ cells. Treg, Foxp3+RORγtneg; Th17, IL-17+IFNγneg. Data from two out of multiple independent experiments, N=7 mice/group. (G) Quantitative RT-PCR of Il17a expression in terminal ileum of C57BL/6 mice fed NCD or HFD for 5 weeks. Data combined from three independent experiments, N=7–10 mice/group. (H) Th1 cells (IFNγ+IL-17neg) from experiments in (E). (I, J) Time course of the proportion of Th17 cells (RORγt+Foxp3neg) in SI LP CD4 T cells (I) and SFB levels in feces (J) in C57BL/6 mice fed NCD or HFD. Data from two out of multiple independent experiments N=3–8 mice/group. (K) Quantitative PCR for SFB 16S DNA in terminal ileum mucosa of C57BL/6 mice fed NCD or HFD for 7 days. Data combined from two independent experiments, N=4 mice/group (L) Experimental scheme for (M-O). CD45.2 C57BL/6 mice were colonized with SFB and switched to HFD a week later. A week later, the animals received SFB-specific 7B8/CD45.1/IL-17A-GFP TCR Tg CD4 T cells. Tg T cells were analyzed 8 days after transfer. (M-O) Representative FACS plots (M) and statistics (N, O) of expansion (N) and Th17 cell differentiation (O) of transferred Tg CD4 T cells in SI LP on Day 15. Data combined from two independent experiments, N=6 mice/group. See also Figure S1.
Figure 2.
Figure 2.. Microbiota-induced Th17 cells protect from metabolic syndrome
(A) Quantitative PCR for SFB 16S DNA in feces from WT, STOP and STOP/CD4 mice fed NCD or HFD for indicated times. Data from two out of several independent experiments, N=3–5 mice/group. (B) ILC3 in SI LP of WT, STOP and STOP/CD4 mice fed NCD or HFD for 5 weeks. Data from two out of multiple independent experiments, N=5–6 mice/group. (C, D) SI LP Th17 cells (IL-17A+IFNγneg) in SFB-positive (C) and SFB-negative (D) STOP and STOP/CD4 mice on Day 40 of HFD feeding. Data from three (C) or two (D) independent experiments out of multiple experiments, N=6–7 mice/group. (E-J) Metabolic analysis of SFB-negative (E-G) and SFB-positive (H-J) mice of the indicated genotypes fed NCD or HFD for 4–5 weeks. SFB-positive mice were colonized with SFB by oral gavage two weeks prior to diet transition. (E, H) changes in body weight. (F, G, I, J) Insulin tolerance test on Day 28 of HFD. AOC, area over the curve. Data from two (E-G) or three (H-J) independent experiments out of several experiments, N=6–11 mice/group. (K, L) Quantitative PCR for total bacterial 16S DNA (K) and quantitative RT-PCR for Tnfa transcripts in liver of STOP and STOP/CD4 mice fed HFD for 5 weeks. Data combined from two independent experiments, N=4–6 mice/group. (M, N) Body weight change (M) and insulin tolerance test at Day 28 (N), of SFB-positive STOP/CD4 mice treated with IgG control or anti-CD4 neutralizing antibody and fed HFD for 5 weeks. Data combined from two independent experiments, N=5 mice/group. (O, P) Body weight change (O) and insulin tolerance test at Day 28 (P), of HFD-fed SFB-positive STOP/CD4 and T cell-deficient STOP/CD4 mice (TCRβ−/−/RORγ-STOP/CD4-Cre). Data combined from two independent experiments, N=7 mice/group. (Q, R) Body weight change (Q) and insulin tolerance test at Day 28 (R), of HFD-fed SFB positive STOP mice with and without transfer of total WT CD4 T cells. Data combined from two independent experiments, N=5 mice/group. See also Figure S2 and S3.
Figure 3.
Figure 3.. Probiotic Th17 cell-inducing bacteria ameliorate metabolic syndrome
(A) Experimental scheme of probiotic treatment. (B) Quantitative PCR for SFB 16S DNA in feces on Day 28 of HFD. N=6–8 mice/group. (C) Quantitative RT-PCR of Il17a transcripts in terminal ileum at 5 weeks on HFD. N=6 mice/group. (D-F) Flow cytometry of cytokines in SI LP CD4 T cells at 5 weeks on HFD. N=3 mice/group. (G-L) Metabolic analysis, including body weight change (G, H), insulin tolerance test (I, J), and oral glucose tolerance test (K, L) at 4 weeks. N=8–11 mice/group. Data combined from two independent experiments with similar results. AOC, area over the curve. AUC, area under the curve. See also Figure S4.
Figure 4.
Figure 4.. Dietary sugar promotes metabolic syndrome through elimination of commensal Th17 cells
(A) SFB 16S DNA in feces from C57BL/6 mice fed natural ingredients normal chow diet (NCD) and various purified diets for 1 week. LFD, low-fat diet. HFD Inulin, HFD supplemented with inulin. Data combined from two independent experiments, N=3–11 mice/group. (B) SFB 16S DNA in feces from C57BL/6 mice fed NCD, HFD, or a 50:50 mix NCD:HFD. Data combined from two independent experiments, N=3–6 mice/group. (C) SFB 16S DNA in feces from C57BL/6 mice fed NCD plus various concentrations of sucrose (SUC) in the drinking water. Data from two out of multiple independent experiments, N=3–7 mice/group. (D-G) RORγt+ (D) Th17 cells, IL-17A+ (E) Th17 cells, and RORγt expression in Foxp3negTCRβ+CD4+ cells (F, G) in SI LP of mice fed NCD with and without 10% sucrose (SUC) in the drinking water for 1 week. Data from two out of multiple independent experiments, N=6–7 mice/group. (H-O) Metabolic and immune cell phenotypes of SFB-negative (H-K) or SFB-positive (L-O) C57BL/6 mice fed NCD, HFD, or sugar-free HFD (SF-HFD) for 4 weeks. SFB-positive mice were colonized with SFB by oral gavage two weeks prior to the change of diet. (H, L) changes in body weight. (I, J, M, N) insulin tolerance test on Day 28. (K, O) SI LP Th17 cells (IL-17A+IFNγneg) as proportion of TCRβ+CD4+ cells on Day 40. Data from two out of four independent experiments, N=5–9 mice/group. (P, Q) Body weight change (P) and insulin tolerance test on Day 28 (Q), of SFB-colonized C57BL/6 mice fed NCD, HFD, SF-HFD, or SF-HFD supplemented with 10% sucrose (SUC) in the drinking water for 5 weeks. Data combined from two independent experiments, N=5 mice/group. (R, S) Body weight change (R) and insulin tolerance test on Day 28 (S), of SFB-colonized Th17 cell-deficient RORγtflox/flox/CD4-Cre mice and control littermates fed SF-HFD. Data combined from two independent experiments, N=5 mice/group. See also Figure S5.
Figure 5.
Figure 5.. Dietary sugar displaces Th17 microbiota by increasing Faecalibaculum rodentium
(A) SFB 16S DNA in feces of germ-free mice monocolonized with SFB and fed NCD or NCD plus 10% sucrose (SUC) in the drinking water. Data from one out of two independent experiments, N=5 mice/group. (B) PCoA plot of 16S microbiota analysis in feces from WT mice on NCD, or 10 days on HFD or NCD plus 10% sucrose in drinking water. Data from one out of two independent experiments, N=4 mice/group. (C, D) Family level taxonomy and relative abundance (C) and OTU taxonomy and absolute abundance (D) in 16S analysis of microbiota in the groups in (B). (E, F) Enrichment analysis of absolute abundance of microbiota OTUs comparing (E) HFD vs NCD and (F) NCD+10% sucrose vs NCD. (G) Quantitative PCR data for Faecalibaculum rodentium (Frod) in feces from WT mice on NCD, or 10 days on HFD or NCD plus 10% sucrose in drinking water. Data from one out of two independent experiments, N=4 mice/group. (H) Correlation of SFB and Frod levels in individual animals. Data from one out of two independent experiments, N=3–5 mice/group. (I-K) Sugar-mediated Frod expansion requires ILC3. (I) Experimental scheme. WT and STOP/CD4 mice were pre-treated with Ampicillin (Amp) before introducing Frod by oral gavage and 10% sucrose in the drinking water. Frod levels in feces of (J) WT or (K) ILC3-deficient STOP/CD4 mice on Day 2 (D2) and Day 10 (D10) post gavage. Data combined from two independent experiments, N=6 mice/group. See also Figure S6.
Figure 6.
Figure 6.. Frod is sufficient to displace SFB
(A-C) Germ-free C57BL/6 mice were colonized with SFB, either alone or together with Frod. (A) Experimental scheme. (B) SFB and (C) Frod levels were followed in feces for 2 weeks. Data from one out of two independent experiments, N=5 mice/group. (D-F) Germ-free C57BL/6 mice were colonized with SFB and Frod for 17 days before addition of 10% sucrose (SUC) in the drinking water. (D) Experimental scheme. (E) SFB and (F) Frod levels in feces 10 days after SUC introduction. N=4 mice/group. (G-I) Germ-free C57BL/6 mice were colonized with SFB and 10 days later colonized with Frod. (G) Experimental scheme. (H) SFB and (I) Frod levels were followed in feces for 17 days. Data from two out of four independent experiments, N=7–8 mice/group. (J) SFB-monocolonized mice were gavaged with Frod and bacteria levels were followed in feces. N=6–8 mice/group. (K) Transmission electron microscopy of terminal ileum at the 24-hour timepoint of (J). SFB and Frod in the mucus (left) and lumen (right). See also Figure S6.
Figure 7.
Figure 7.. Commensal Th17 cells prevent metabolic syndrome by regulating intestinal lipid absorption.
(A-C) Total lipid contents in IEC (A), liver (B) and feces (C) of STOP and STOP CD4 mice fed HFD for 5 weeks. Data from two independent experiments, N=4 mice/group. (D) Cd36 transcripts in ileum IEC from STOP and STOP/CD4 mice fed HFD for 4 weeks. Data from two independent experiments, N=3–5 mice/group. (E) Cd36 transcripts in ileum IEC from STOP/CD4 mice and TCRβ-KO STOP/CD4 mice (DKO) fed HFD for 5 weeks. Data from two independent experiments, N=3–5 mice/group. (F-H) Cd36 transcripts in IEC from duodenum (F), jejunum(G) and ileum (H) of WT mice and Th17 cell-deficient RORγtflox/CD4-Cre mice under NCD. Data from two independent experiments, N=4 mice/group. (I) Cd36 transcripts in ileum IEC of IL-17A-deficient mice and corresponding WT littermates. Data from two independent experiments, N=5–8 mice/group. (J) Cd36 transcripts in ileum IEC of WT mice treated with anti-IL-17A neutralizing or control IgG antibody. Data from two independent experiments, N=4–6 mice/group. (K) Cd36 transcripts in terminal ileum enteroids treated with rIL-17A in vitro (analysis of RNA-Seq data from Kumar et al., 2016). (L) Cd36 transcripts in ileum IEC from SFB-negative and SFB-positive WT mice fed NCD, HFD and SF-HFD for 10 days. Data combined from two independent experiments, N=3–5 mice/group. (M-P) Body weight change (L, M) and insulin tolerance test on Day 28 (N, O) of WT and Cd36−/− mice fed SF-HFD for 4 weeks. Data from one out of two independent experiments, N=4 mice/group. (Q) IL-17+ Th17 cells in the SI LP of WT and Cd36−/− mice fed SF-HFD for 5 weeks. Proportion of TCRβ+CD4+ cells. Data from one out of two independent experiments, N=4 mice/group. See also Figure S7.

Comment in

References

    1. Afshin A, Forouzanfar MH, Reitsma MB, Sur P, Estep K, Lee A, Marczak L, Mokdad AH, Moradi-Lakeh M, Naghavi M, et al. (2017). Health Effects of Overweight and Obesity in 195 Countries over 25 Years. The New England journal of medicine 377, 13–27. - PMC - PubMed
    1. Alexander M, Ang QY, Nayak RR, Bustion AE, Sandy M, Zhang B, Upadhyay V, Pollard KS, Lynch SV, and Turnbaugh PJ (2022). Human gut bacterial metabolism drives Th17 activation and colitis. Cell host & microbe 30, 17–30 e19. - PMC - PubMed
    1. Atarashi K, Nishimura J, Shima T, Umesaki Y, Yamamoto M, Onoue M, Yagita H, Ishii N, Evans R, Honda K, et al. (2008). ATP drives lamina propria T(H)17 cell differentiation. Nature 455, 808–812. - PubMed
    1. Atarashi K, Tanoue T, Ando M, Kamada N, Nagano Y, Narushima S, Suda W, Imaoka A, Setoyama H, Nagamori T, et al. (2015). Th17 Cell Induction by Adhesion of Microbes to Intestinal Epithelial Cells. Cell 163, 367–380. - PMC - PubMed
    1. Barman M, Unold D, Shifley K, Amir E, Hung K, Bos N, and Salzman N (2008). Enteric salmonellosis disrupts the microbial ecology of the murine gastrointestinal tract. Infect Immun 76, 907–915. - PMC - PubMed

Publication types