. 2022 Oct 4;34(10):1548-1560.e6.
doi: 10.1016/j.cmet.2022.08.005. Epub 2022 Aug 29.

PIDDosome-SCAP crosstalk controls high-fructose-diet-dependent transition from simple steatosis to steatohepatitis

Affiliations

PIDDosome-SCAP crosstalk controls high-fructose-diet-dependent transition from simple steatosis to steatohepatitis

Ju Youn Kim et al. Cell Metab. .

Abstract

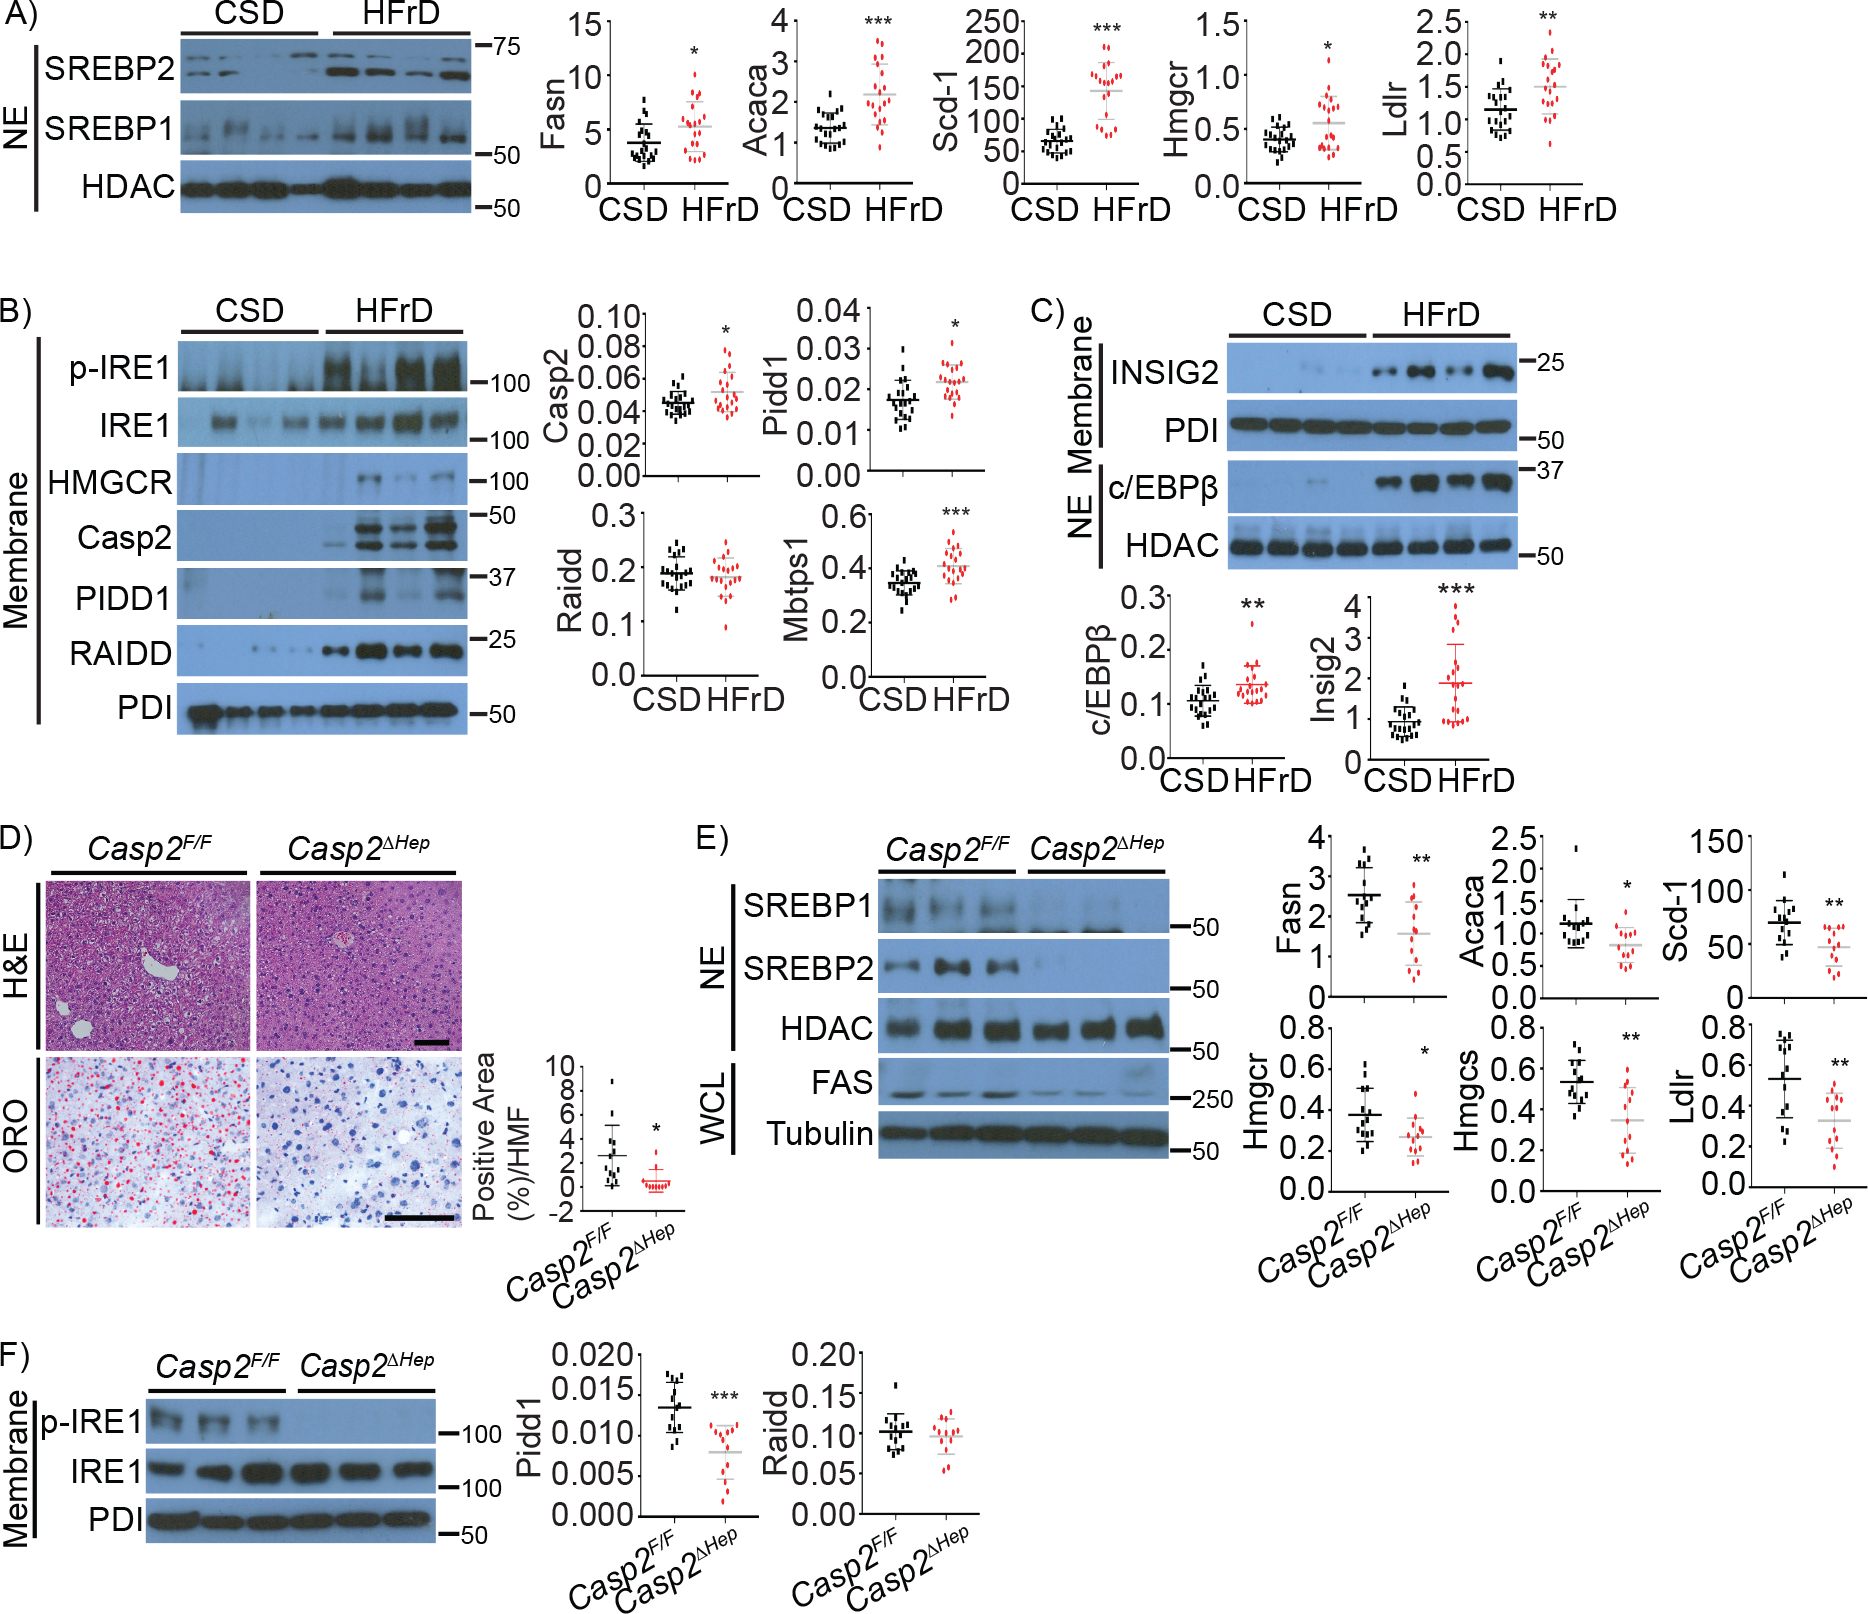
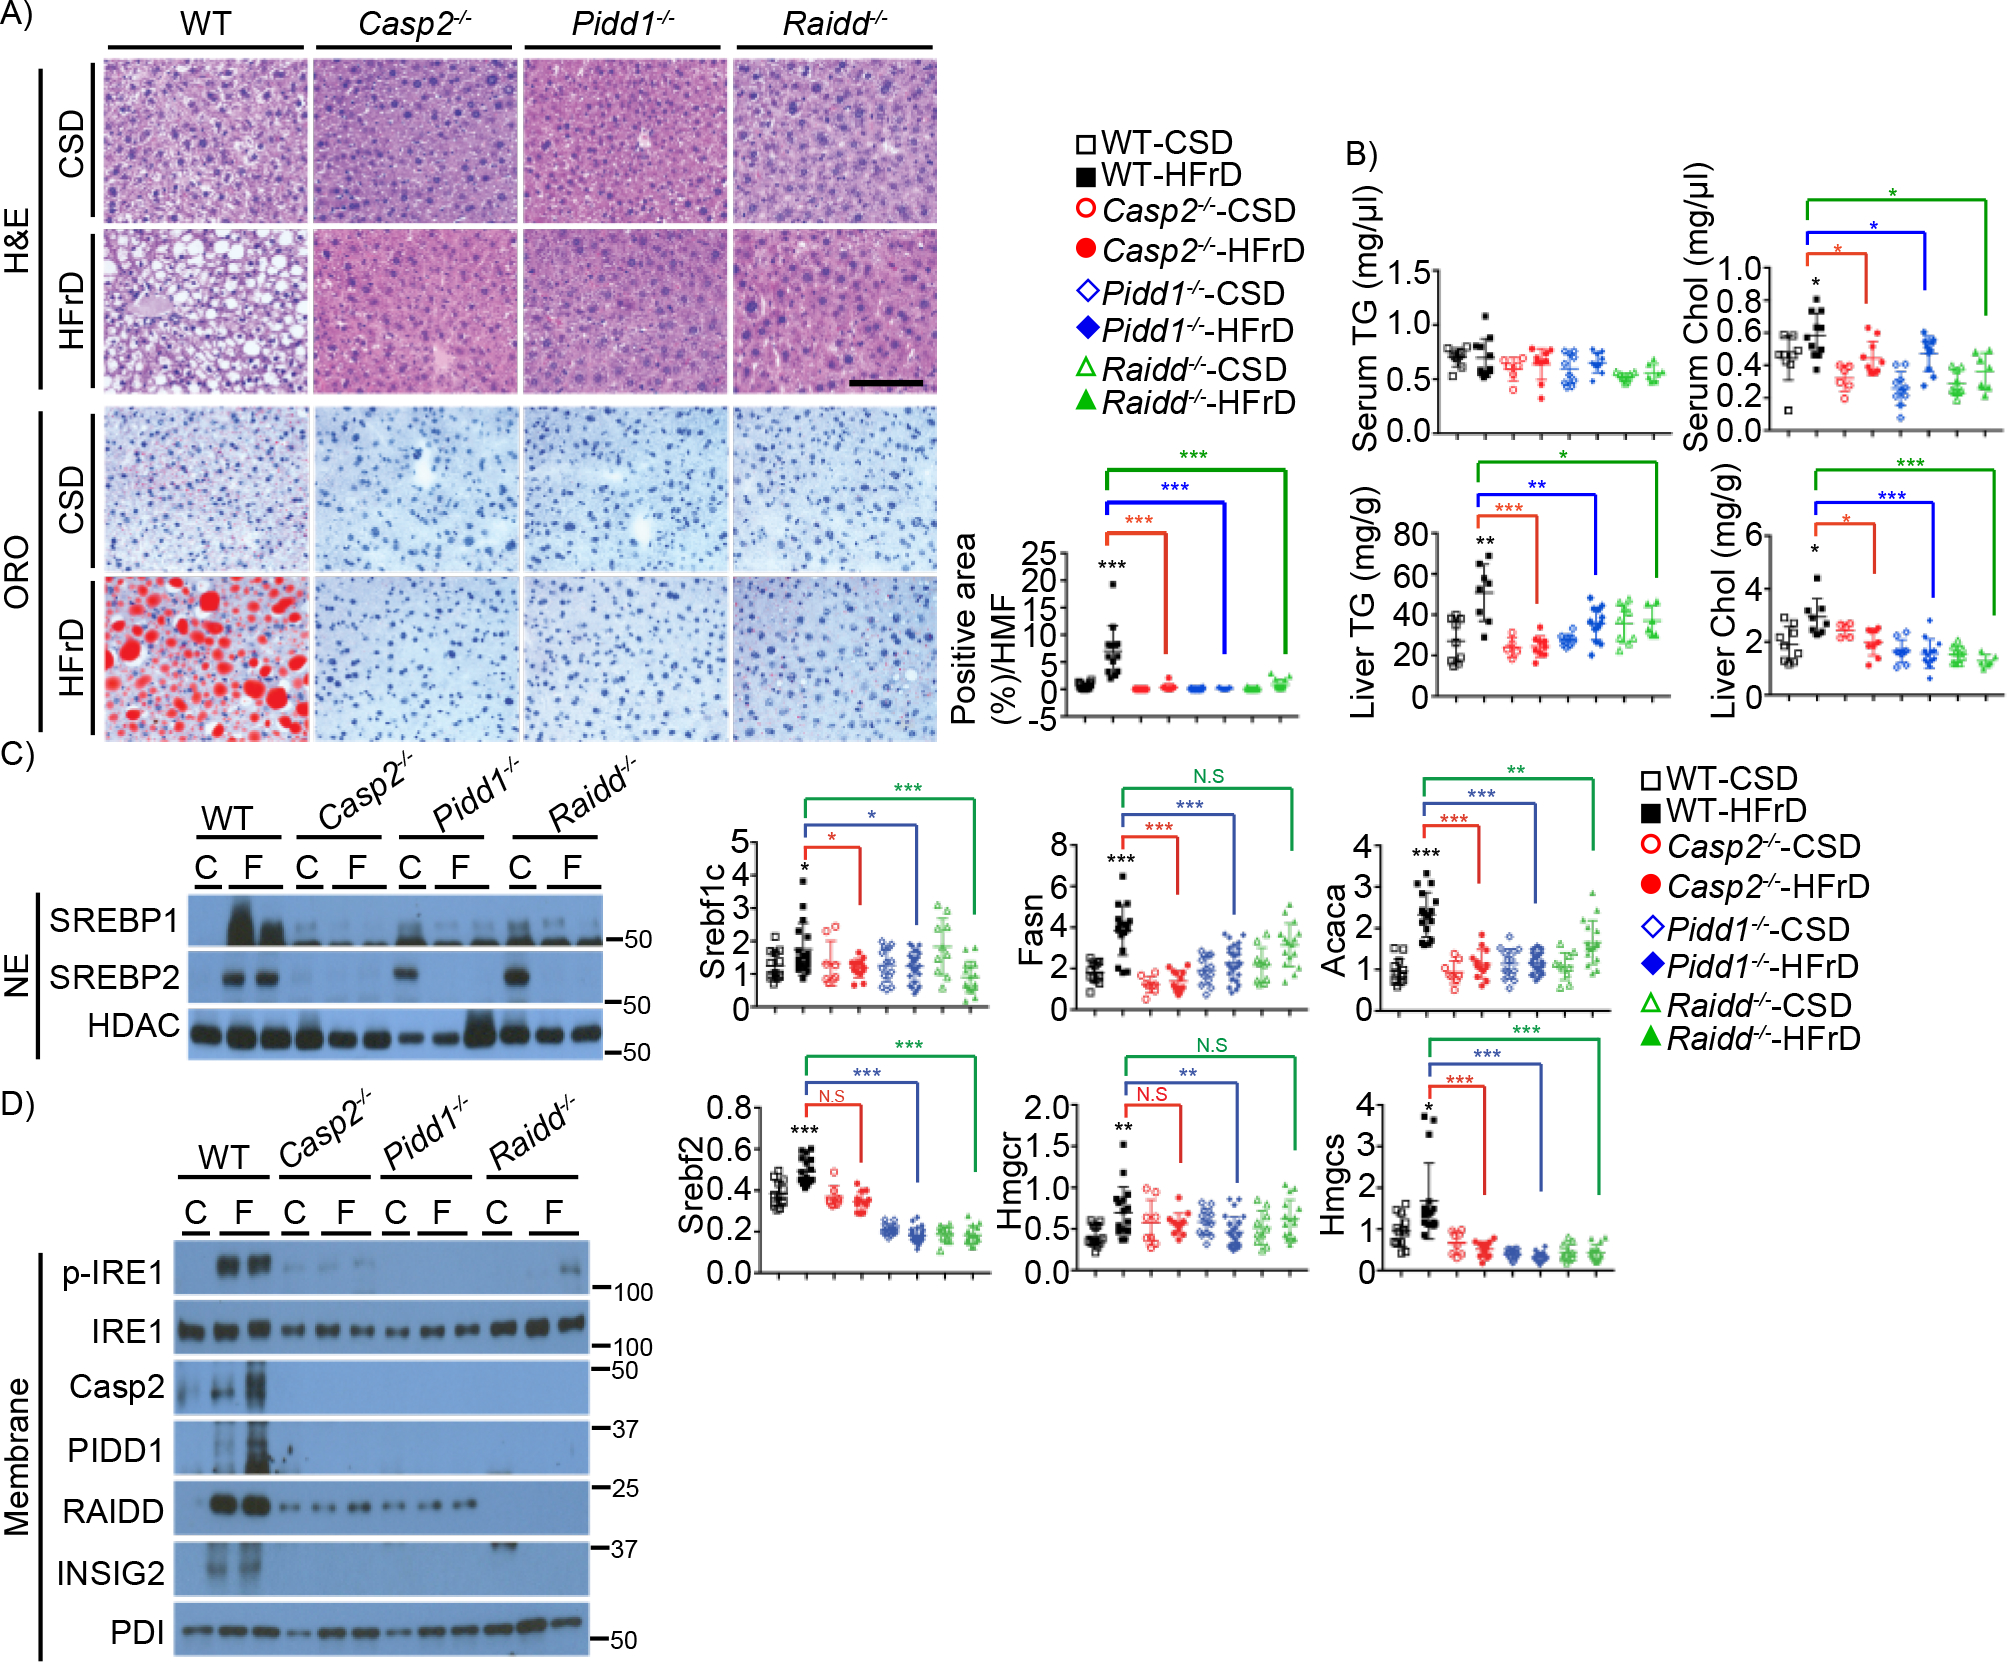
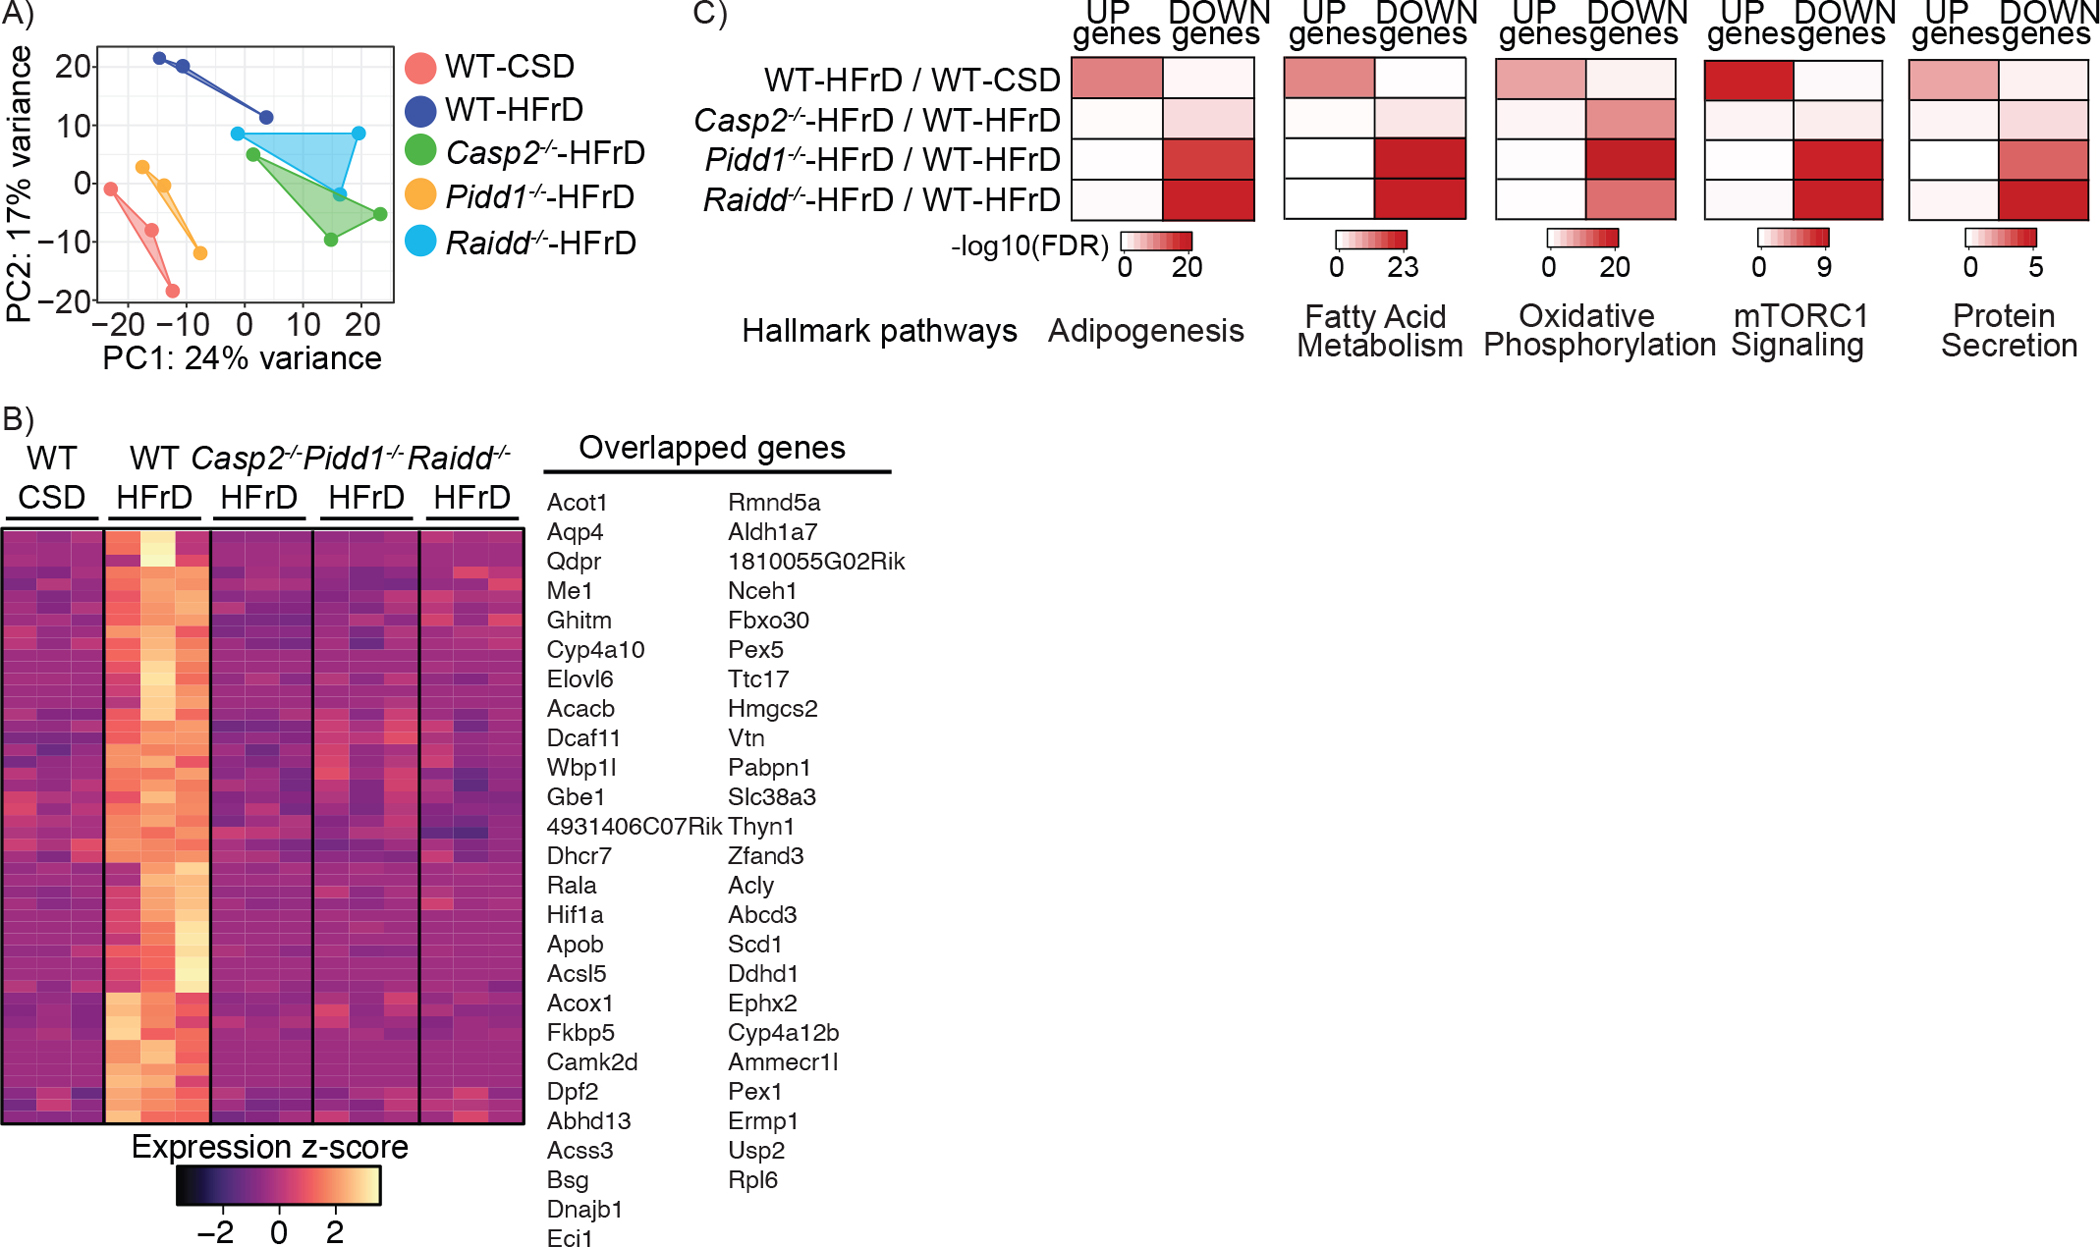
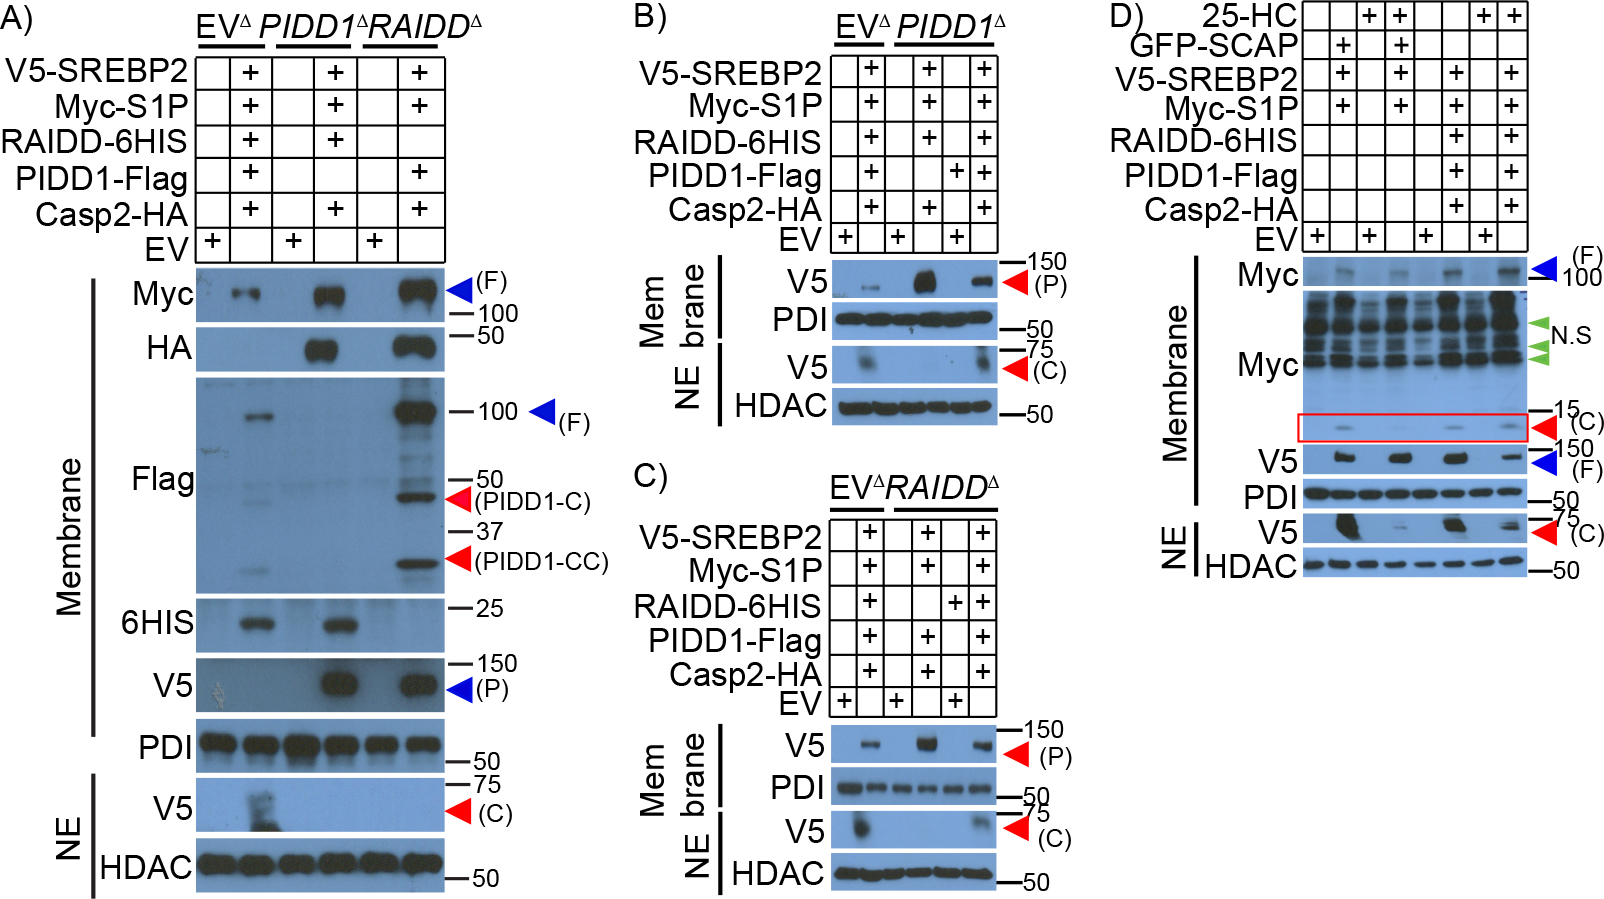
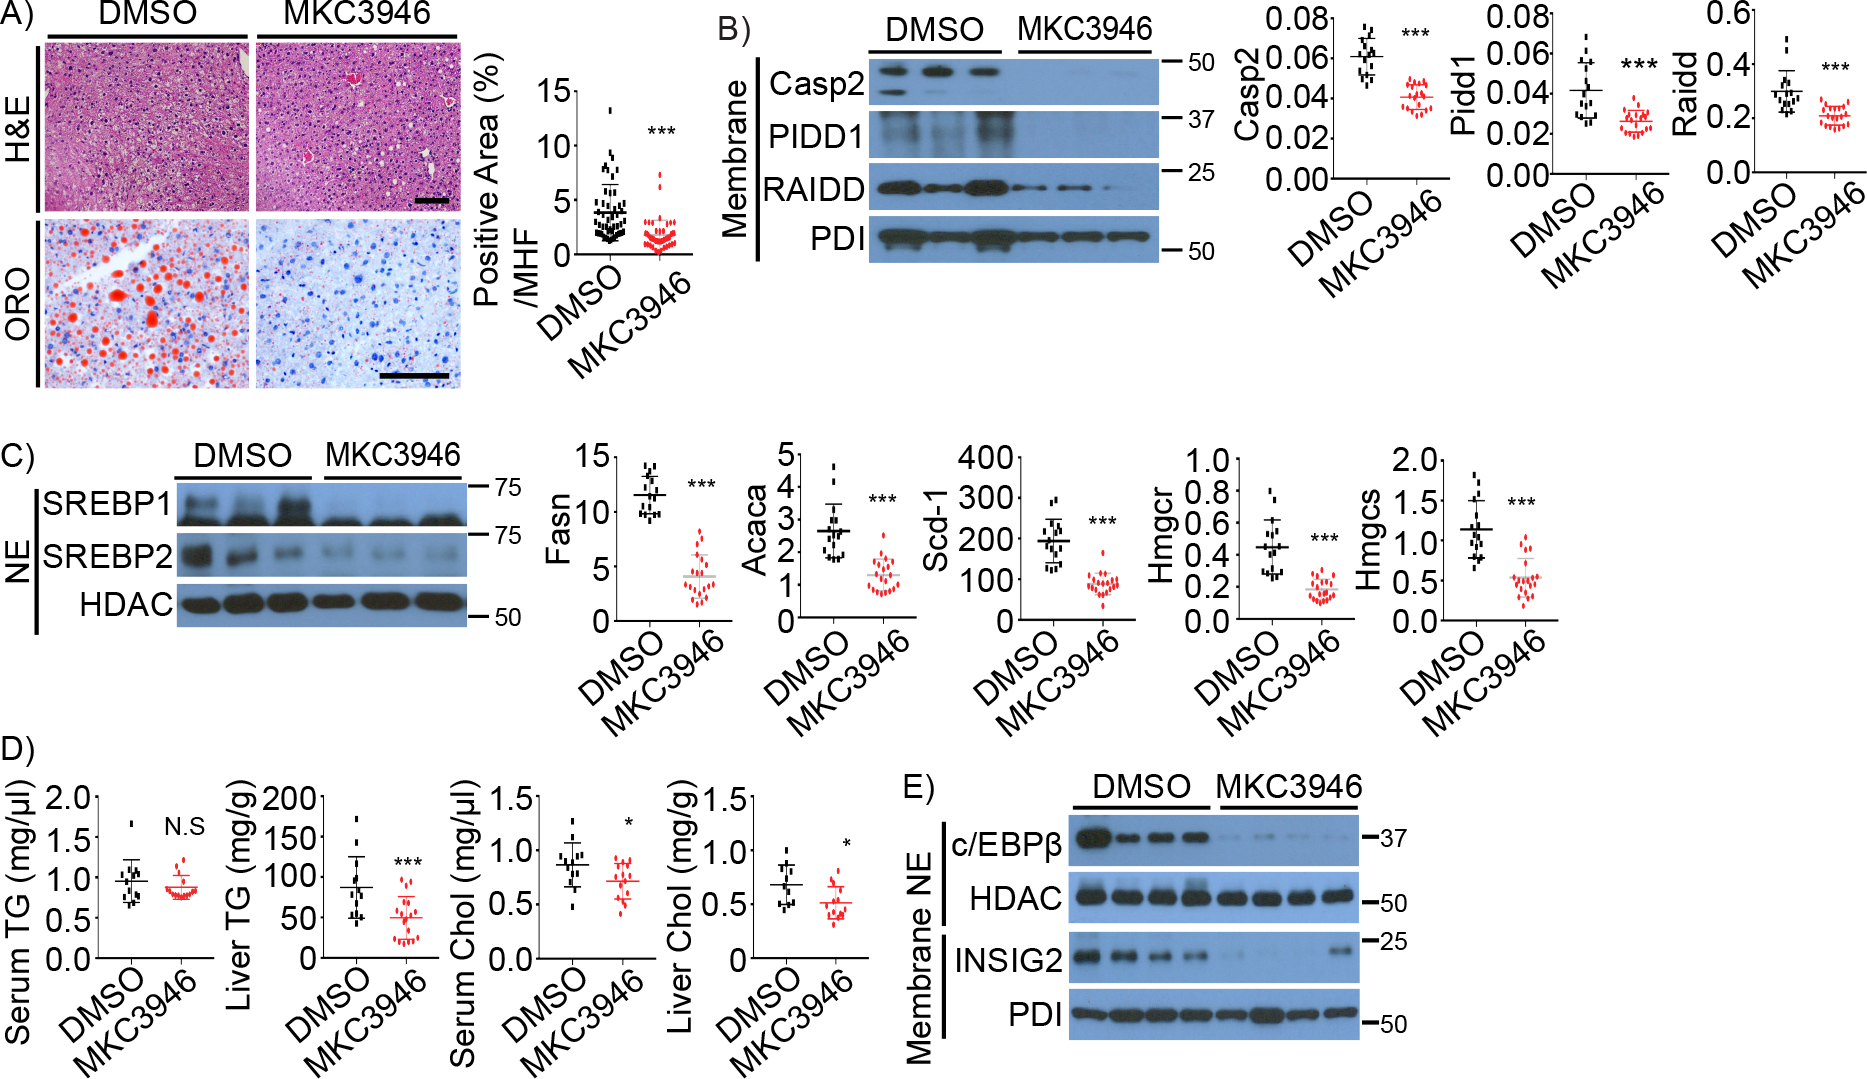
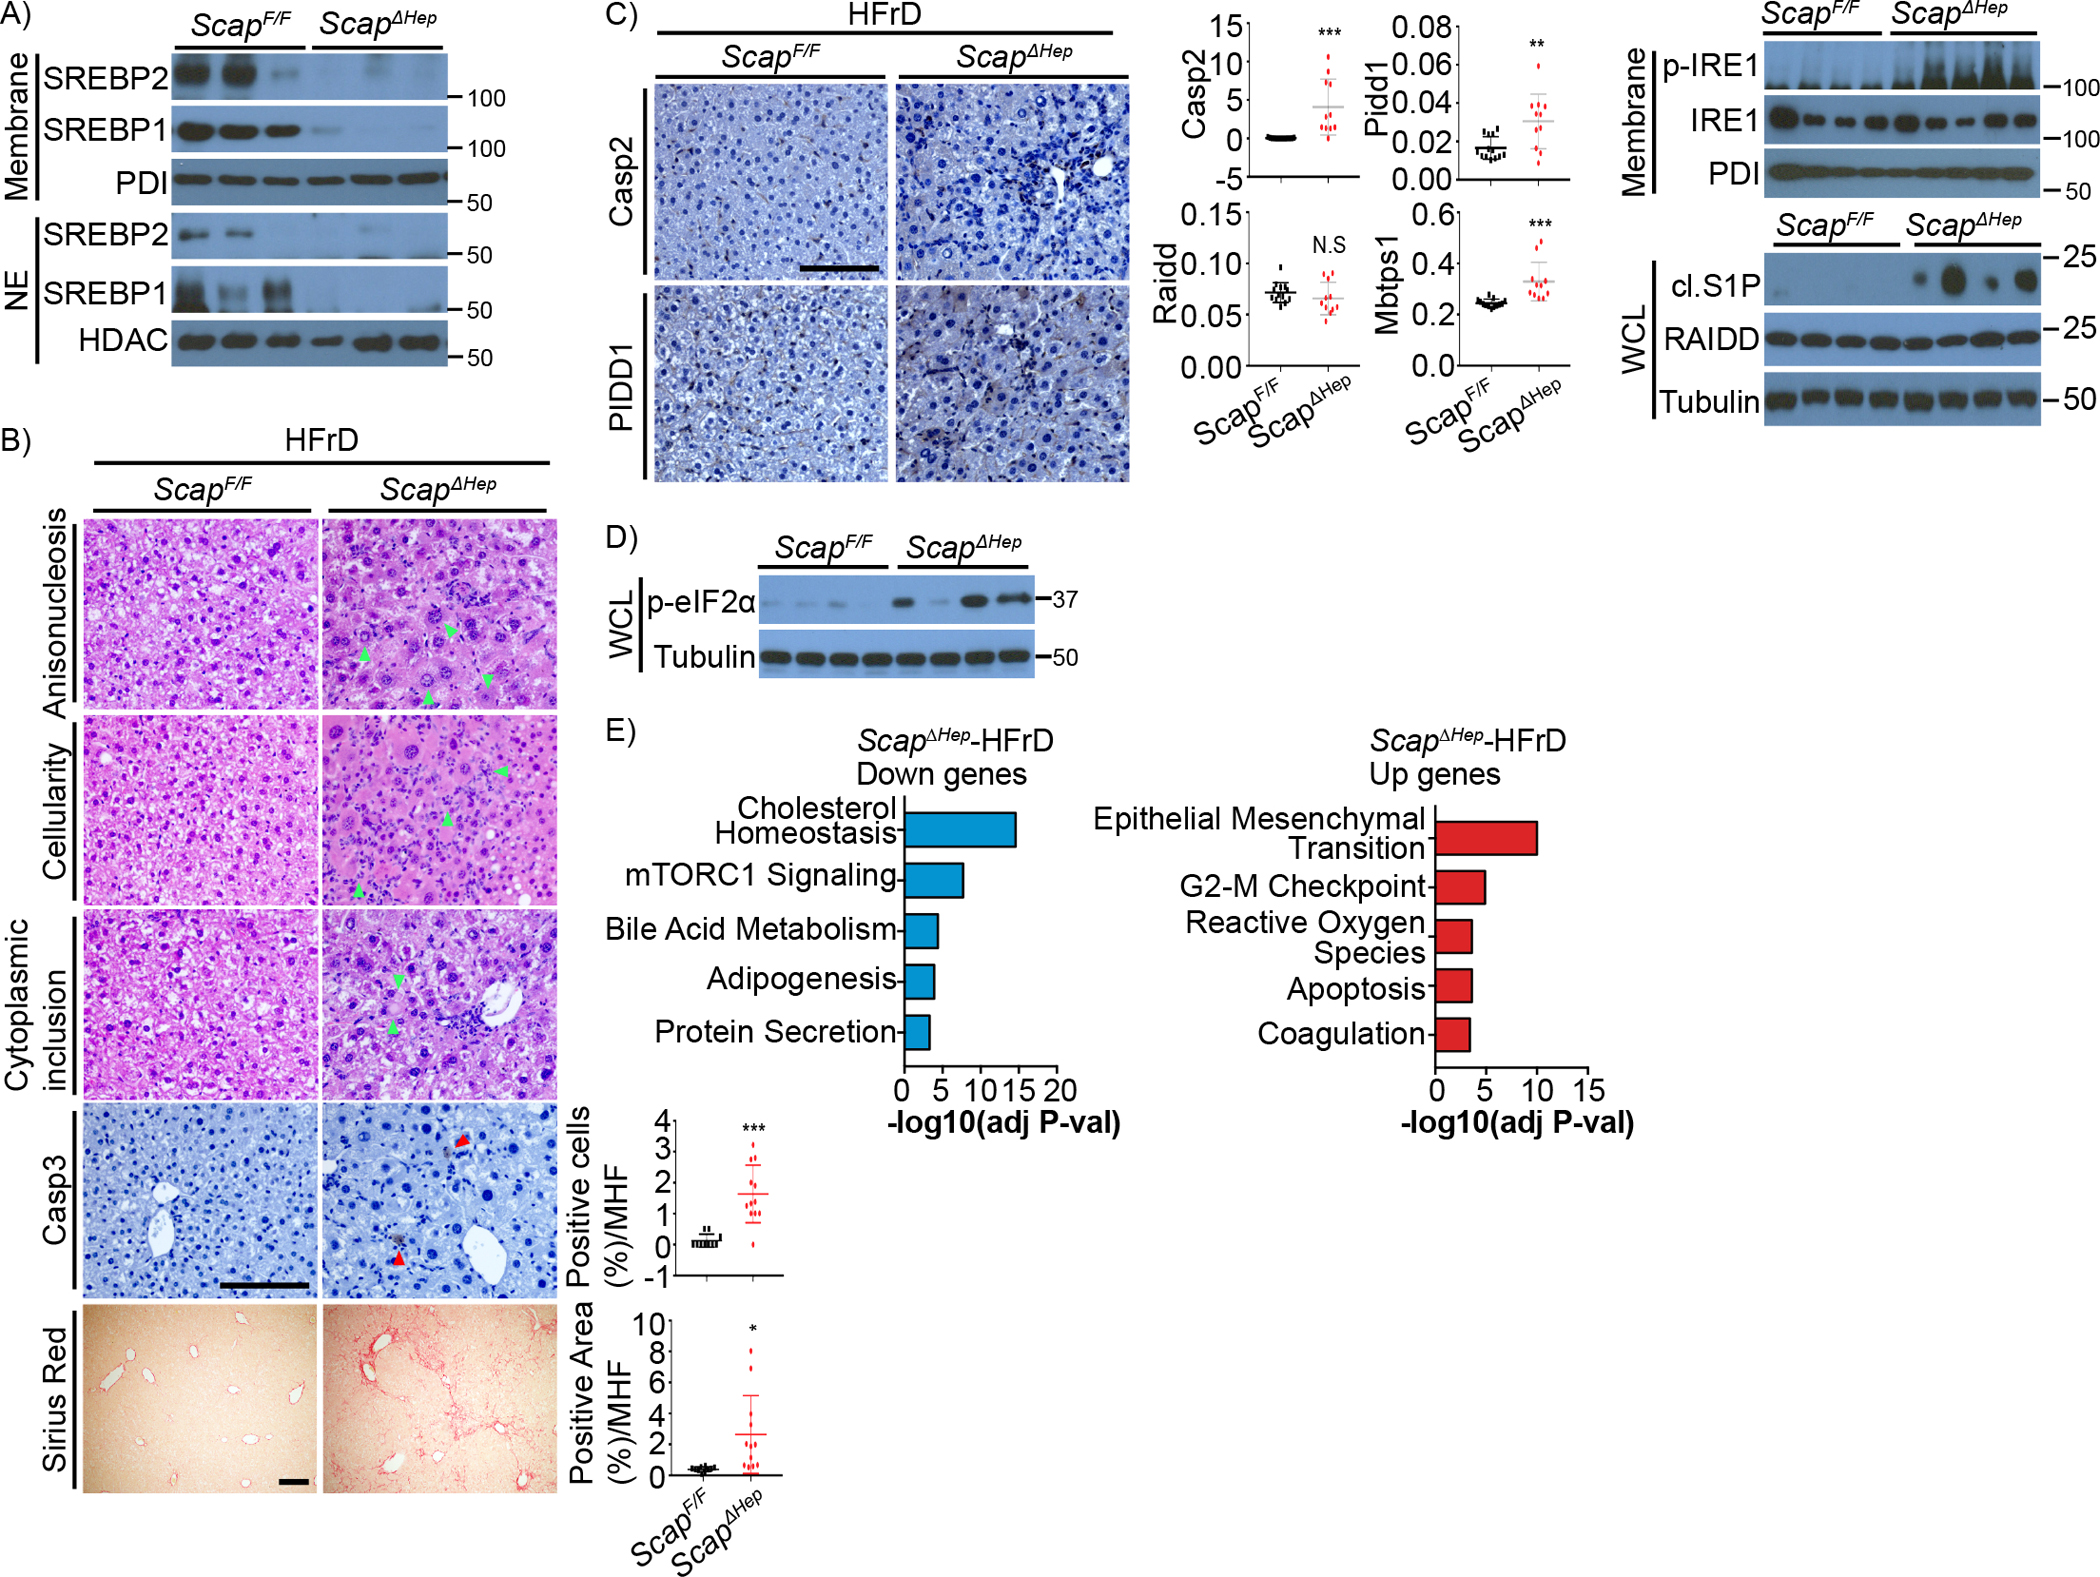
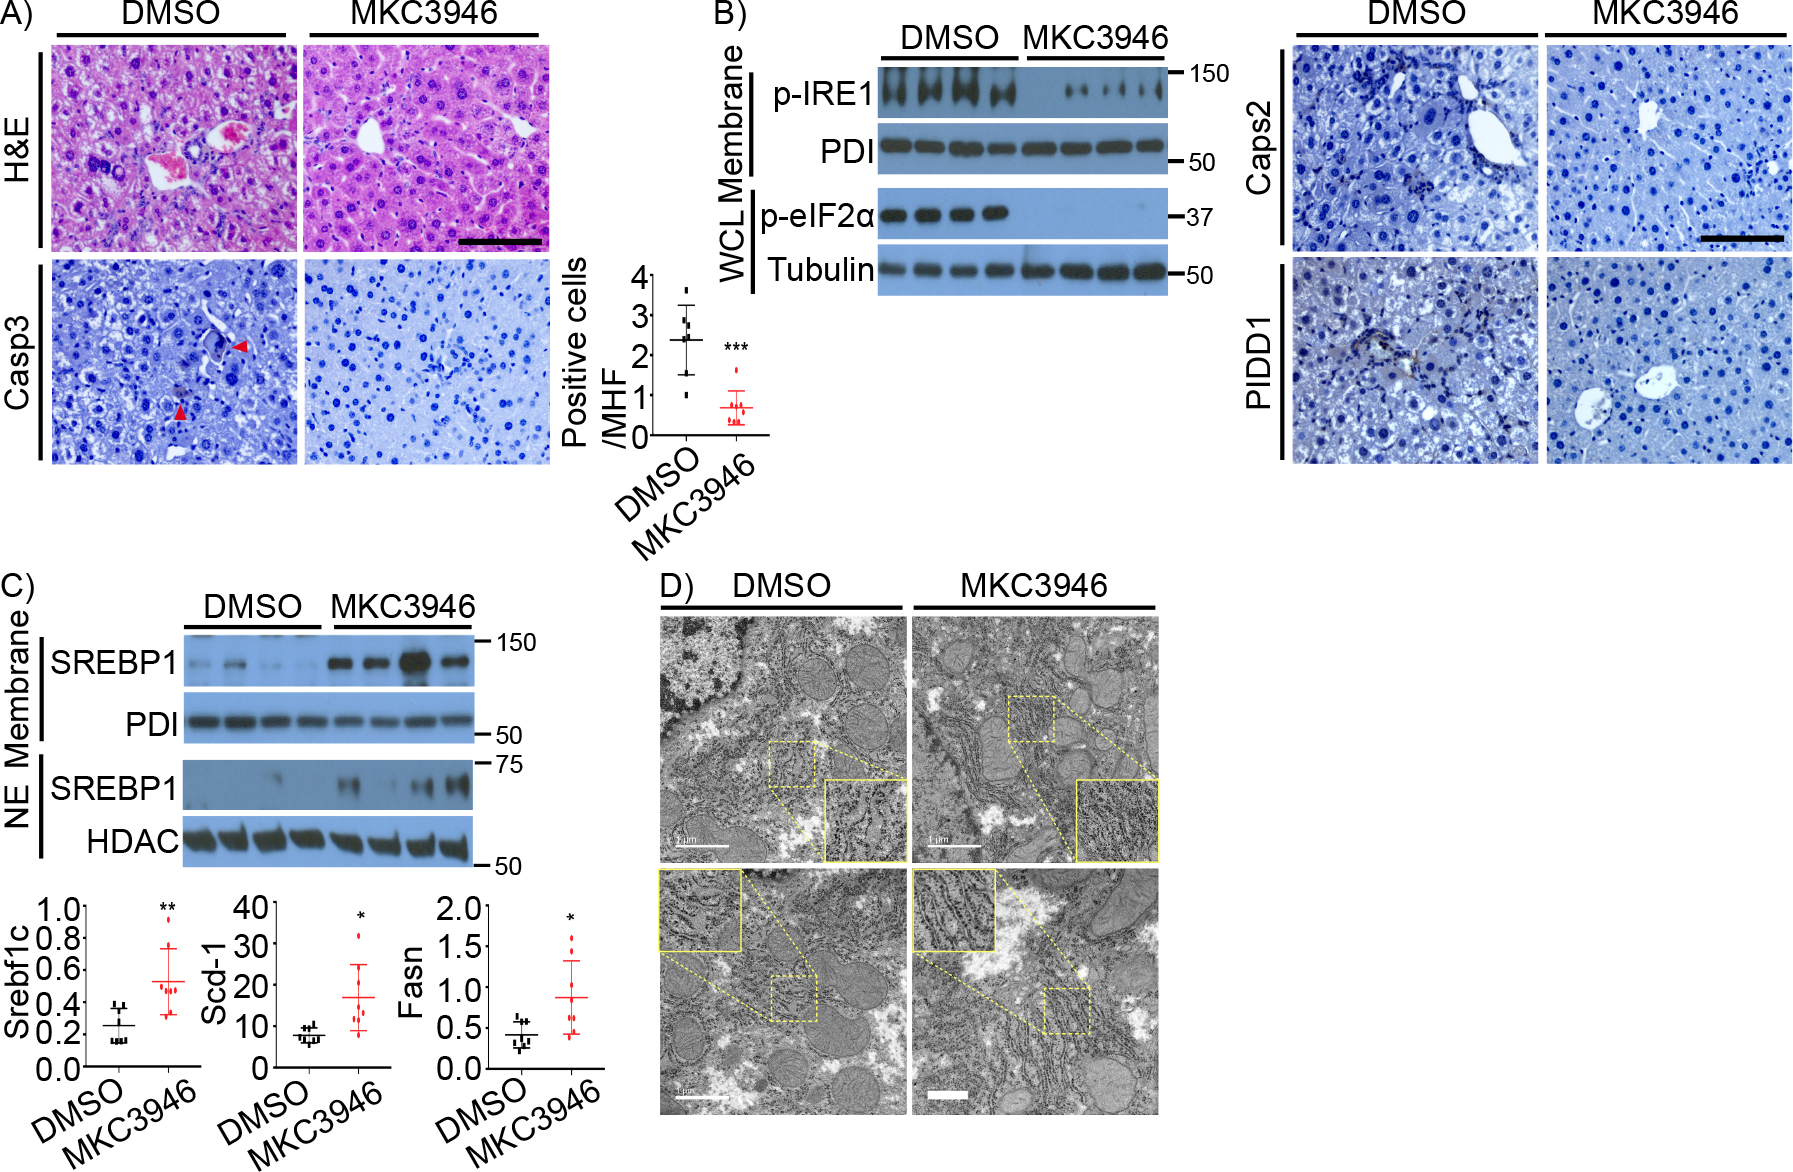
Sterol deficiency triggers SCAP-mediated SREBP activation, whereas hypernutrition together with ER stress activates SREBP1/2 via caspase-2. Whether these pathways interact and how they are selectively activated by different dietary cues are unknown. Here, we reveal regulatory crosstalk between the two pathways that controls the transition from hepatosteatosis to steatohepatitis. Hepatic ER stress elicited by NASH-inducing diets activates IRE1 and induces expression of the PIDDosome subunits caspase-2, RAIDD, and PIDD1, along with INSIG2, an inhibitor of SCAP-dependent SREBP activation. PIDDosome assembly activates caspase-2 and sustains IRE1 activation. PIDDosome ablation or IRE1 inhibition blunt steatohepatitis and diminish INSIG2 expression. Conversely, while inhibiting simple steatosis, SCAP ablation amplifies IRE1 and PIDDosome activation and liver damage in NASH-diet-fed animals, effects linked to ER disruption and preventable by IRE1 inhibition. Thus, the PIDDosome and SCAP pathways antagonistically modulate nutrient-induced hepatic ER stress to control non-linear transition from simple steatosis to hepatitis, a key step in NASH pathogenesis.

Keywords: ER stress; IRE1; NAFLD; NASH; PIDDosome; SCAP; SREBP; caspase-2; steatohepatitis; steatosis.


Conflict of interest statement

Declaration of interests M.K. is the founder and scientific advisory board member of Elgia Therapeutics and receives research support from Merck, Jenssen, and Gossamer. J.Y.K. and M.K. are authors/inventors of patent titled Method for inhibition nonalcoholic steatohepatitis, nonalcoholic fatty liver disease, and/or de novo lipogenesis (2017-152-2) (patent is pending approval).

Figures

Figure 1.
Figure 1.. Hepatocyte-specific Casp2 ablation prevents fructose induced steatosis.
A-C: WT BL6 mice were fed cornstarch (CSD, n=21) or high fructose (HFrD, n=20) diets for 12 weeks and analyzed as indicated. A. Nuclear SREBP1 and 2 and relative target mRNA amounts. B. Representative immunoblots (IB) of phosphorylated IRE1 (p-IRE1), HMGCR, and PIDDosome components. The corresponding mRNAs were quantitated by Q-RT-PCR and their relative amounts are shown on the right. C. Representative IB analysis (top) and mRNA quantification of INSIG2 and c/EBPβ (bottom). D-F: Casp2 floxed (Casp2F/F, n=14) and liver specific Casp2 knockout (Casp2ΔHep, n=13) mice were fed HFrD for 12 weeks and analyzed. D. Representative hematoxylin and eosin (H&E) stained formalin fixed paraffin embedded (FFPE) liver sections and oil red O (ORO) stained frozen liver sections. Four high magnification fields (HMF) were taken from each liver and quantified by Image J software. Quantification is on the right. E. IB of nuclear SREBPs and FAS in whole tissue lysates (left), and relative amounts of lipogenic enzyme mRNAs (right). F. IRE1 phosphorylation (left) and relative PIDDosome component mRNAs (right). Results are mean ± SEM. Scale bar, 100 μm. Statistical significance was determined by two-tailed Student’s t test. *p < 0.05, **p < 0.005, ***p < 0.001.
Figure 2.
Figure 2.. PIDDosome components are required for fructose induced hepatosteatosis.
A. WT, Casp2−/−, Pidd1−/−, and Raidd−/− mice were fed CSD or HFrD for 12 weeks and liver sections from indicated mice were H&E and ORO stained. Four HMFs were taken from each section and ORO-positive areas were quantitated and shown on the right. B. Serum and liver triglyceride (TG) and cholesterol (Chol) from above mice (Serum: WT-CSD: n=9, WT-HFrD: n=11, Casp2−/−-CSD: n=6, Casp2−/−-HFrD: n=10, Pidd1−/−-CSD: n=10, Pidd1−/−-HFrD: n=10, Raidd−/−-CSD: n=9, Raidd−/−-HFrD: n=7; Liver: WT-CSD: n=9, WT-HFrD: n=8, Casp2−/−-CSD: n=5, Casp2−/−-HFrD: n=9, Pidd1−/−-CSD: n=9, Pidd1−/−-HFrD: n=13, Raidd−/−-CSD: n=9, Raidd−/−-HFrD: n=6). C. Representative IB analysis of nuclear SREBPs (left) and relative lipogenic enzyme mRNAs (right) in livers of indicated mice. (WT-CSD: n=13, WT-HFrD: n=17, Casp2−/−-CSD: n=8, Casp2−/−-HFrD: n=13, Pidd1−/−-CSD: n=14, Pidd1−/−-HFrD: n=27, Raidd−/−-CSD: n=10, Raidd−/−-HFrD: n=16). D. IB analysis of indicated proteins in the above mouse livers. Scale bar, 100 μm. Positive areas were quantitated using Image J software. Statistical significance was evaluated by one way ANOVA and Tuckey’s multiple comparison. *p < 0.05, **p < 0.005, ***p < 0.001. C-CSD, F-HFrD.
Figure 3.
Figure 3.. PIDDosome components control fructose induced lipid metabolizing genes.
WT, Casp2−/−, Pidd1−/−, and Raidd−/− mice were fed CSD or HFrD for 12 weeks. Total liver RNA was extracted and subjected to whole genome RNA-seq analysis. A. Principal Component Analysis (PCA) plot showing 5 groups with 3 biological replicates each. The PCA captured the variation of the samples among 5 groups, showing PC1 and PC2 scores. Each group is shown with geom_polygon function of ggplot2. B. Venn diagram showing overlapping genes from 4 comparative analyses. Selected overlapping genes are listed on the right. C. Heatmap showing significantly altered genes among the 5 groups. Overlapping pathways among 4 comparisons (n=50) were visualized in z-score scale.
Figure 4.
Figure 4.. PIDD1 and RAIDD are needed for Casp2 activation.
A-C. Parental (EVΔ), PIDD1- (PIDD1Δ) or RAIDD-ablated (RAIDDΔ) HEK293 cells were transfected with plasmids encoding epitope-tagged PIDDosome components, S1P, and SREBP2 as indicated and cultured for 16 hrs. Membrane and nuclear fractions were isolated and the indicated proteins were IB analyzed. D. HEK293 cells were transfected with the indicated plasmids and supplemented with 25-hydroxycholesterol (25-HC, 1 μg/ml) for 16 hrs. Indicated proteins were IB analyzed. Cleaved S1P is shown in the red box. Each experiment was repeated at least 3 times and representative results are shown. F-Full length, C-Cleaved, P-precursor, N.S-non-specific, NE-nuclear extract.
Figure 5.
Figure 5.. IRE1 inhibition prevents PIDDosome and SREBP activation.
WT mice were fed HFrD for 8 weeks, followed by DMSO (n=16) or MKC3946 (3 mg/kg, n=20) treatments every two days for 4 weeks. A. H&E and ORO staining of liver sections. Quantification is shown on the right. B, C. The indicated proteins in liver lysates of above mice were IB analyzed (left). PIDDosome components (B) and relative lipogenic enzyme mRNAs (C) were quantitated and the results shown on the right. D. Serum and liver TG and Chol in above mice. E. IB of c/EBPβ and INSIG2 in liver lysates of above mice. Results are mean ± SEM. Scale bar, 100 μm. Statistical significance was performed by two-tailed Student’s t test. *p < 0.05, **p < 0.005, ***p < 0.001. N.E-nuclear extract.
Figure 6.
Figure 6.. Scap ablation potentiates fructose-induced ER stress and PIDDosome activation.
ScapF/F (n=13) and ScapΔhep (n=11) mice were fed HFrD for 12 weeks. A. IB analysis of precursor and cleaved SREBP1/2 in above livers. B. Liver sections from above mice were stained with H&E, Sirius red, and cleaved Casp3 antibody. Anisonucleosis, portal cellularity, cytoplasmic inclusion, indicated by light green arrowheads, and Casp3-positive hepatocytes, indicated by red arrowheads, and fibrosis were visualized in above livers. Quantification is shown on the right. C. IHC analysis of Casp2 and PIDD1 in livers of above mice and relative mRNA expression of PIDDosome components and S1P (MBTPS1) are shown on the right. IB analysis of phospho-IRE1 and cleaved (cl.) S1P is at the bottom. D. eIF2α phosphorylation in livers of above mice. E. Hallmark pathways from Enrich analysis using up- or down-regulated genes in HFrD-ScapΔhep compared to HFrD-ScapF/F livers with 3 biological replicates each. Results are mean ± SEM. Scale bar, 100 μm. Statistical significance was performed by two-tailed Student’s t test. *p < 0.05, **p < 0.005, ***p < 0.001.
Figure 7.
Figure 7.. IRE1 inhibition alleviates ER stress and damage in the HFrD-fed ScapΔhep liver.
ScapΔhep mice were fed HFrD for 8 weeks, followed by DMSO (n=8) or MKC3946 (3 mg/kg, n=8) treatment every two days for 4 weeks. A. H&E and Casp3 staining of FFPE liver sections. Quantification of cleaved Casp3-positive hepatocytes is on the right. B. B of ER stress markers (left) and Casp2 and PIDD IHC (right) of above livers. C. IB analysis of SREBP1 (left) and mRNA of lipogenic enzymes (right) in above livers. D. EM images of above livers. Disrupted and well-organized RER are highlighted and enlarged in the dotted yellow boxes. Results are mean ± SEM. Scale bar in H&E image, 100 μm. Scale bar in EM images, 1000 nm. Statistical significance was performed by two-tailed Student’s t test. *p < 0.05, **p < 0.005, ***p < 0.001.

Comment in

References

    1. Abdelmalek MF, Lazo M, Horska A, Bonekamp S, Lipkin EW, Balasubramanyam A, Bantle JP, Johnson RJ, Diehl AM, Clark JM, et al. (2012). Higher dietary fructose is associated with impaired hepatic adenosine triphosphate homeostasis in obese individuals with type 2 diabetes. Hepatology 56, 952–960. - PMC - PubMed
    1. Afonso MS, Machado RM, Lavrador MS, Quintao ECR, Moore KJ, and Lottenberg AM (2018). Molecular Pathways Underlying Cholesterol Homeostasis. Nutrients 10. - PMC - PubMed
    1. Arguello G, Balboa E, Arrese M, and Zanlungo S (2015). Recent insights on the role of cholesterol in non-alcoholic fatty liver disease. Biochim Biophys Acta 1852, 1765–1778. - PubMed
    1. Berube C, Boucher LM, Ma W, Wakeham A, Salmena L, Hakem R, Yeh WC, Mak TW, and Benchimol S (2005). Apoptosis caused by p53-induced protein with death domain (PIDD) depends on the death adapter protein RAIDD. Proc Natl Acad Sci U S A 102, 14314–14320. - PMC - PubMed
    1. Brown MS, and Goldstein JL (1997). The SREBP pathway: regulation of cholesterol metabolism by proteolysis of a membrane-bound transcription factor. Cell 89, 331–340. - PubMed

Publication types