. 2022 Aug 30;13(1):4501.
doi: 10.1038/s41467-022-32266-4.

Multi-omics analysis defines highly refractory RAS burdened immature subgroup of infant acute lymphoblastic leukemia

Affiliations

Multi-omics analysis defines highly refractory RAS burdened immature subgroup of infant acute lymphoblastic leukemia

Tomoya Isobe et al. Nat Commun. .

Abstract

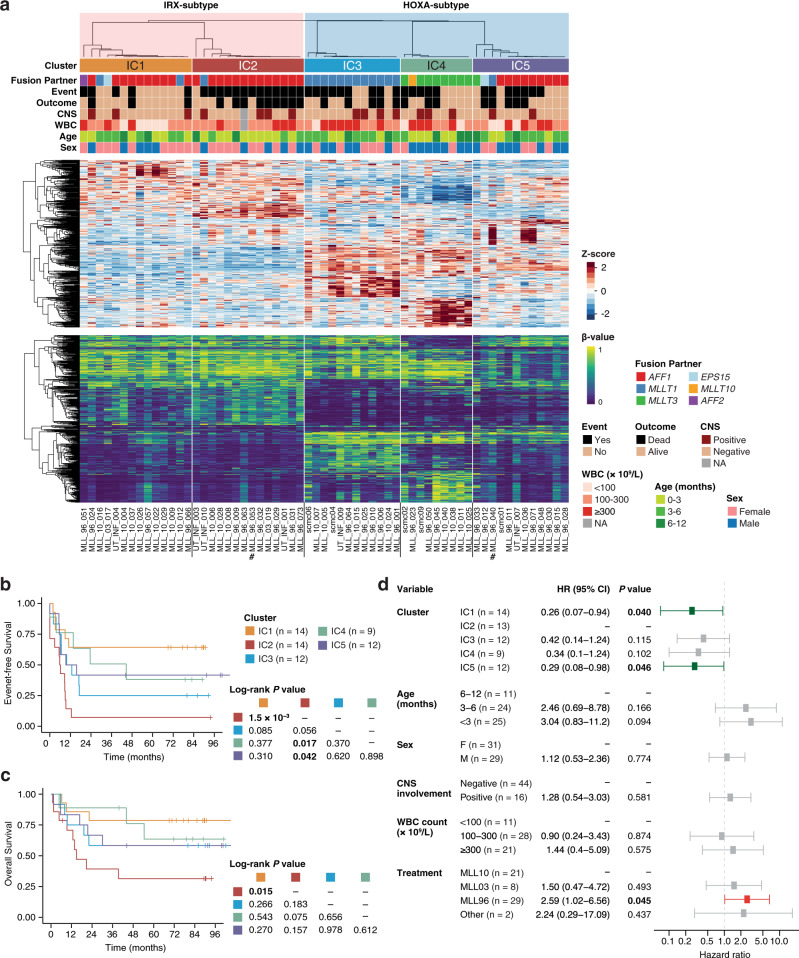
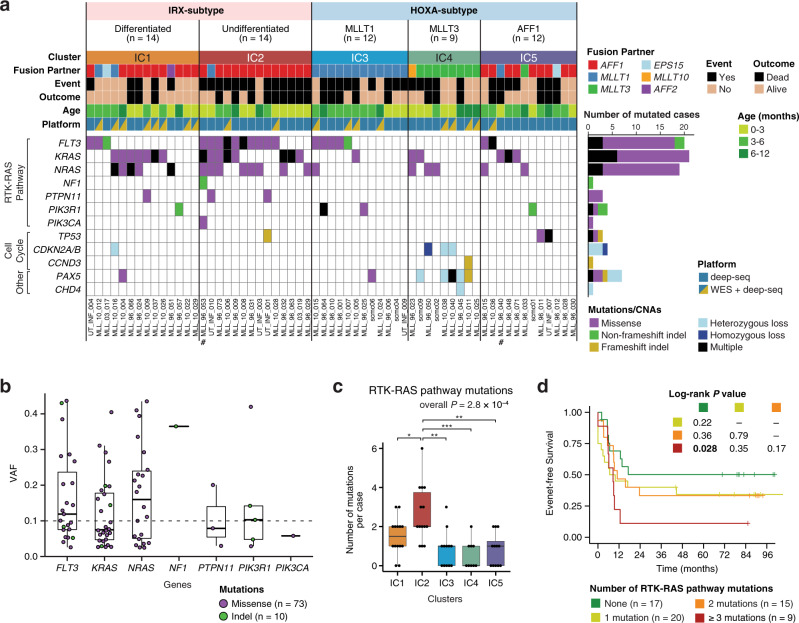
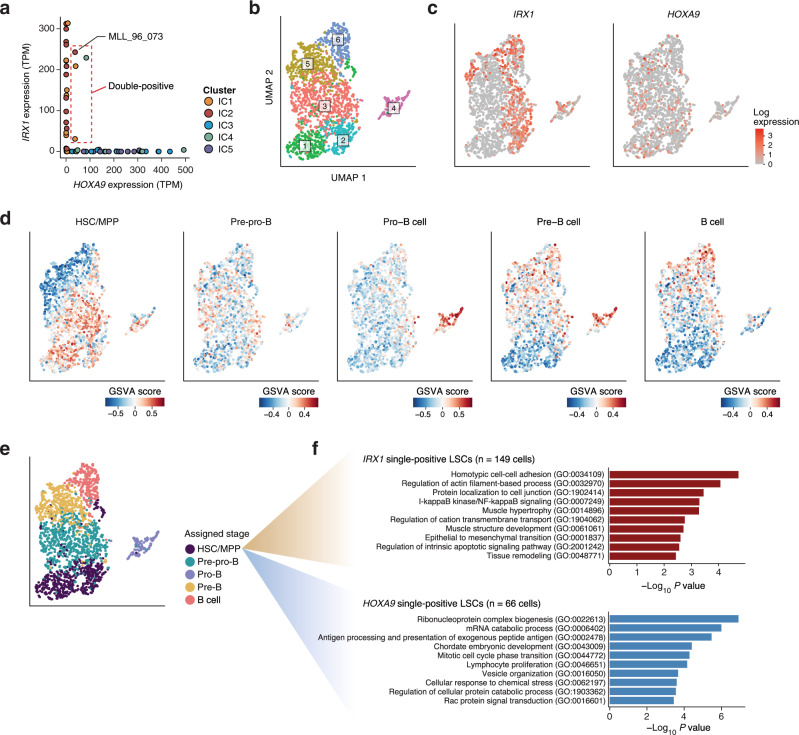
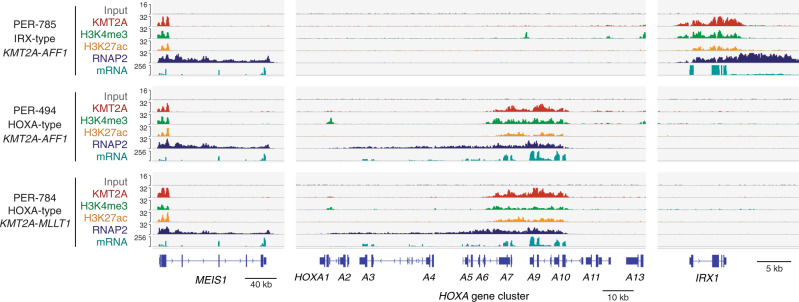
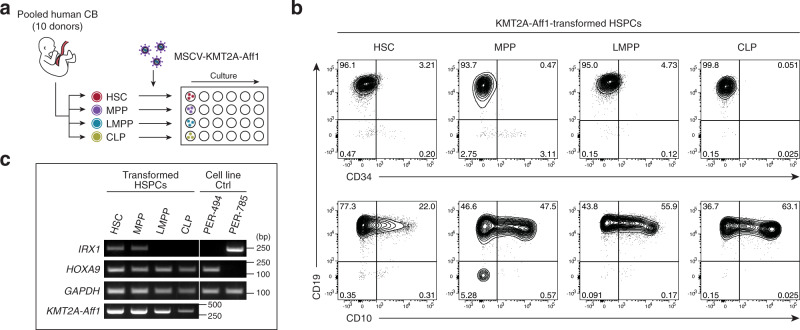
KMT2A-rearranged infant acute lymphoblastic leukemia (ALL) represents the most refractory type of childhood leukemia. To uncover the molecular heterogeneity of this disease, we perform RNA sequencing, methylation array analysis, whole exome and targeted deep sequencing on 84 infants with KMT2A-rearranged leukemia. Our multi-omics clustering followed by single-sample and single-cell inference of hematopoietic differentiation establishes five robust integrative clusters (ICs) with different master transcription factors, fusion partners and corresponding stages of B-lymphopoietic and early hemato-endothelial development: IRX-type differentiated (IC1), IRX-type undifferentiated (IC2), HOXA-type MLLT1 (IC3), HOXA-type MLLT3 (IC4), and HOXA-type AFF1 (IC5). Importantly, our deep mutational analysis reveals that the number of RAS pathway mutations predicts prognosis and that the most refractory subgroup of IC2 possesses 100% frequency and the heaviest burden of RAS pathway mutations. Our findings highlight the previously under-appreciated intra- and inter-patient heterogeneity of KMT2A-rearranged infant ALL and provide a rationale for the future development of genomics-guided risk stratification and individualized therapy.


Conflict of interest statement

The authors declare no competing interests.

Figures

Fig. 1
Fig. 1. Dual-omics-integrative clustering of KMT2A-r infant ALL.
a Comprehensive dual-omics heatmaps of KMT2A-r infant ALL. Top: clinicopathological features of the discovery cohort of 61 infants. The dendrogram is from consensus clustering and indicates sample-to-sample distances. Middle: Expression heatmap of cluster marker genes. The top 100 significantly up- or downregulated marker genes for each of the five ICs were included. Bottom: Methylation heatmap of cluster marker probes. The top 100 significantly hyper- or hypomethylated marker probes for each of the five ICs were included. Number signs (#) indicate the two cases with B/M MPAL. CNS central nervous system, WBC white blood cell, NA not available. b, c Survival analysis comparing the EFS (b) and OS (c) of different ICs of KMT2A-r infant ALL. d Multivariate Cox proportional hazards analysis for EFS. ICs and known clinical prognostic factors, as well as treatment protocols, were included in the model. One patient (MLL_96_063) was excluded due to missing clinical information; a total of 60 infants were included, and the subtotal number of cases in each variable group is indicated. Error bars show the 95% confidence interval. Two-sided raw P values are shown. HR hazard ratio, CI confidence interval.
Fig. 2
Fig. 2. Integrative comparison of transcriptome and DNA methylome in infant ALL.
a, b Integrative scatter plots contrasting expression differences with DNA methylation differences in IC2 (a) and IC4 (b). Genes and probes with significant differences in gene expression (|log2 fold change | ≥2 and two-sided adjusted P < 0.05) and DNA methylation (|Δβ | ≥0.2 and two-sided adjusted P < 0.05) are highlighted in red. c, d Correlated gene expression and DNA methylation of dual-omics cluster markers FLT1 (c), CD34 and MME (d). Pearson correlation coefficients (R) and raw Pearson correlation P values are indicated. Box plots show median and first/third quartiles. The whisker extends from the smallest to the largest values within 1.5 × IQR from the box hinges.
Fig. 3
Fig. 3. Differential enrichment of B-lineage and hemato-endothelial developmental signatures in KMT2A-r infant ALL.
a Enrichment analysis comparing the expression of B-cell developmental signatures in the five ICs. Enrichment scores were calculated at the individual sample level using GSVA, and the median value for each signature in each cluster is plotted. Kruskal–Wallis P values are indicated on the right of the heatmap. b Cluster-specific enrichment of B-lineage signatures evaluated with GSEA. NES normalized enrichment score, FDR false discovery rate. c Significant under-enrichment of B-progenitor signatures in IC2. d Uniform manifold approximation and projection (UMAP) visualization of a published single-cell gene expression atlas of murine gastrulation (n = 116,312 cells). The right upper box shows a magnified section of the blood development trajectory (n = 13,881 cells). e GSVA enrichment of positive targets of IRX1 and HOXA9 within the blood development trajectory. f Enrichment analysis of endothelial cell signatures comparing IRX subtype vs. HOXA subtype. g Density scatter plot comparing the DNA methylation levels of IRX subtype and HOXA subtype. Differential methylation was assessed on the basis of genomic tiling regions with a 5-kb window. Methylation levels of the tiling regions are shown as density in blue, and individual points are plotted in the 1% sparsest areas of the plot. The 100 most significantly hypomethylated regions in the IRX and HOXA subtypes are shown in purple and brown, respectively. h LOLA enrichment analysis on the 100 differentially methylated regions highlighted in (g). The top ten most significantly enriched categories from CODEX or ENCODE entries of the LOLA Core databases are shown.
Fig. 4
Fig. 4. Mutational landscape of KMT2A-r infant ALL subgroups.
a Gene mutations and CNAs in the different subgroups of KMT2A-r infant leukemia. Number signs (#) indicate the two cases with B/M MPAL. b VAFs of RTK-RAS pathway mutations detected with deep-seq. The VAF of 0.1 is indicated by a dashed horizontal line. Box plots show median and first/third quartiles. c Number of mutations in the RTK-RAS pathway per case. All 61 cases of the discovery cohort are included: IC1 (n = 14), IC2 (n = 14), IC3 (n = 12), IC4 (n = 9), and IC5 (n = 12). Box plots show median and first/third quartiles. Overall P value is from Kruskal–Wallis test. P values for pairwise cluster comparisons are from the two-sided Wilcoxon rank-sum test. *P < 0.05; **P < 0.01; ***P < 0.001. Raw P values are as follows: P = 0.034 (IC2 vs. IC1), 1.2 × 10−3 (IC2 vs. IC3), 7.0 × 10−4 (IC2 vs. IC4), and 1.2 × 10−3 (IC2 vs. IC5). d Survival analysis based on the number of RTK-RAS pathway mutations.
Fig. 5
Fig. 5. Single-cell transcriptome analysis of an infant with IRX/HOXA double-positive ALL.
a Two-dimensional display of IRX1 and HOXA9 gene expression in each patient sample. A case of double-positive ALL (MLL_96_073) is denoted. b UMAP visualization of the single-cell transcriptome of MLL_96_073. Clusters were identified with the Louvain method. c Log normalized expression values of IRX1 and HOXA9 in the leukemia cells of MLL_96_073. d Single-cell-level enrichment of B-lineage developmental signatures computed with the GSVA algorithm. e Inferred developmental stages of the leukemia cells from MLL_96_073. Marker signatures were computed for the cell clusters identified in (b), and were assigned as cluster-defining developmental stages. f Enriched Gene Ontology terms in the IRX1-positive LSCs (n = 149 cells; upper panel) and HOXA9-positive LSCs (n = 66 cells; lower panel).
Fig. 6
Fig. 6. Different chromatin landscapes of IRX and HOXA subtypes of KMT2A-r infant ALL cell lines.
ChIP-seq profiles of KMT2A, H3K4me3, H3K27ac, and RNA polymerase II (RNAP2) at the MEIS1, HOXA, and IRX1 loci. RNA sequencing profiles are also depicted.
Fig. 7
Fig. 7. IRX-type leukemia-initiating potential is lost earlier in B-cell development than HOXA-type potential.
a Schematic outline of in vitro CB transformation assay. CB HSPCs were sorted, transduced with KMT2A-Aff1, and cultured on MS-5 stroma cells under lymphoid conditions. b Flow cytometry plots of KMT2A-Aff1-transformed HSPCs. c RT-PCR of IRX1 and HOXA9 in the transformed HSPCs. HOXA-type (PER-494) and IRX-type (PER-785) cell lines are shown as controls. Experiments were independently repeated three times, and representative results are shown. Source data are provided as a Source Data file.

References

    1. Downing JR, et al. The pediatric cancer genome project. Nat. Genet. 2012;44:619–622. doi: 10.1038/ng.2287. - DOI - PMC - PubMed
    1. Hilden JM, et al. Analysis of prognostic factors of acute lymphoblastic leukemia in infants: report on CCG 1953 from the Children’s Oncology Group. Blood. 2006;108:441–451. doi: 10.1182/blood-2005-07-3011. - DOI - PMC - PubMed
    1. Pieters R, et al. Outcome of infants younger than 1 year with acute lymphoblastic leukemia treated with the interfant-06 protocol: results from an International Phase III Randomized Study. J. Clin. Oncol. 2019;37:2246–2256. doi: 10.1200/JCO.19.00261. - DOI - PubMed
    1. Tomizawa D, et al. A risk-stratified therapy for infants with acute lymphoblastic leukemia: a report from the JPLSG MLL-10 trial. Blood. 2020;136:1813–1823. doi: 10.1182/blood.2019004741. - DOI - PubMed
    1. Brown PA, et al. FLT3 inhibitor lestaurtinib plus chemotherapy for newly diagnosed KMT2A-rearranged infant acute lymphoblastic leukemia: Children’s Oncology Group trial AALL0631. Leukemia. 2021;35:1279–1290. doi: 10.1038/s41375-021-01177-6. - DOI - PMC - PubMed

MeSH terms

Substances