. 2022 Aug 30;13(1):5113.
doi: 10.1038/s41467-022-32800-4.

Comprehensive structural assignment of glycosaminoglycan oligo- and polysaccharides by protein nanopore

Affiliations

Comprehensive structural assignment of glycosaminoglycan oligo- and polysaccharides by protein nanopore

Parisa Bayat et al. Nat Commun. .

Abstract

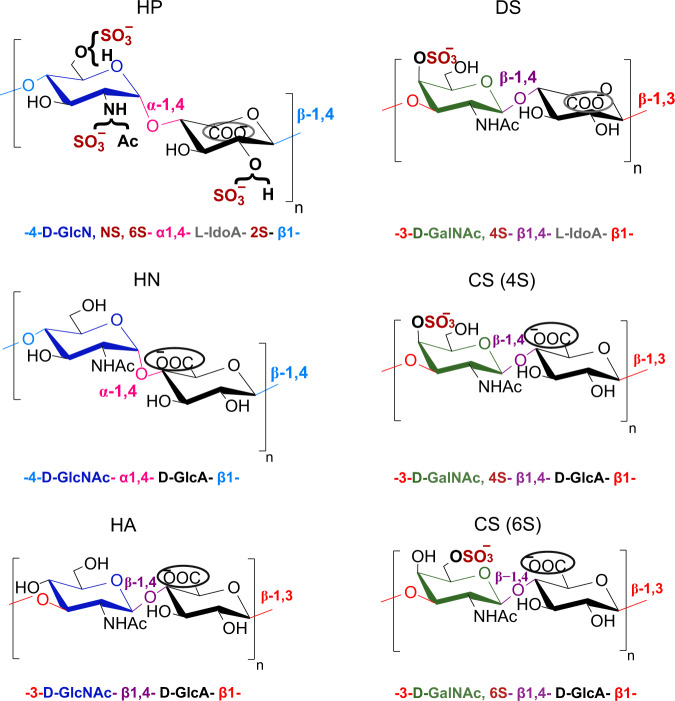
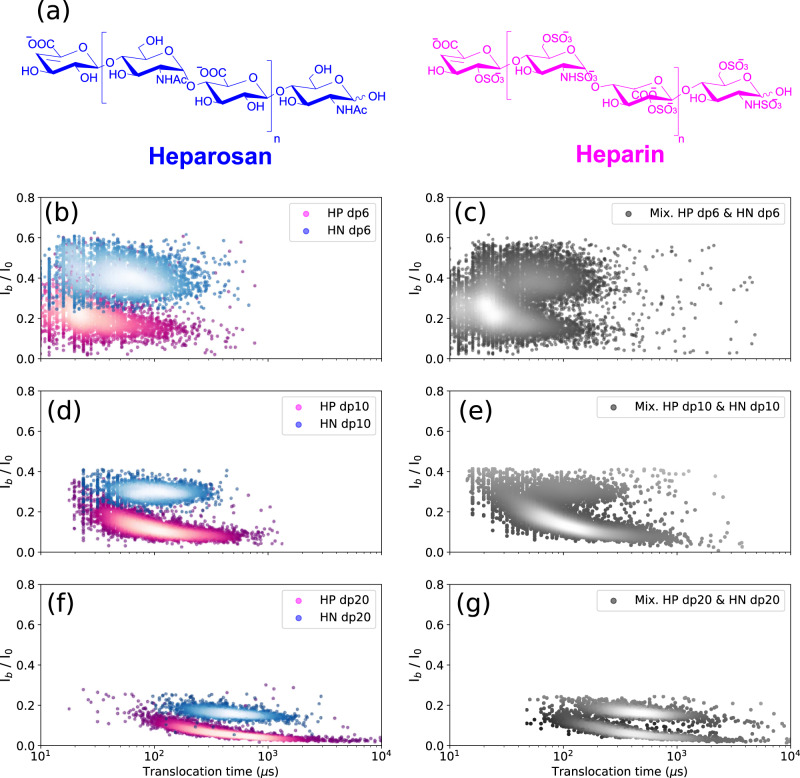
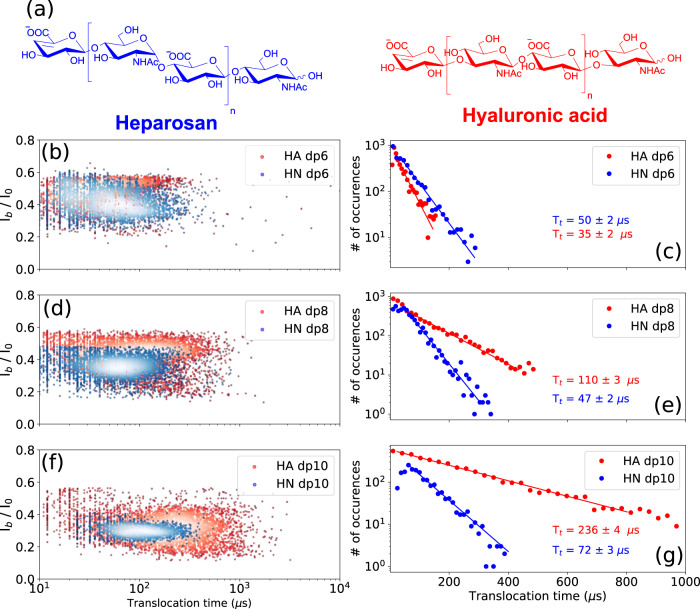
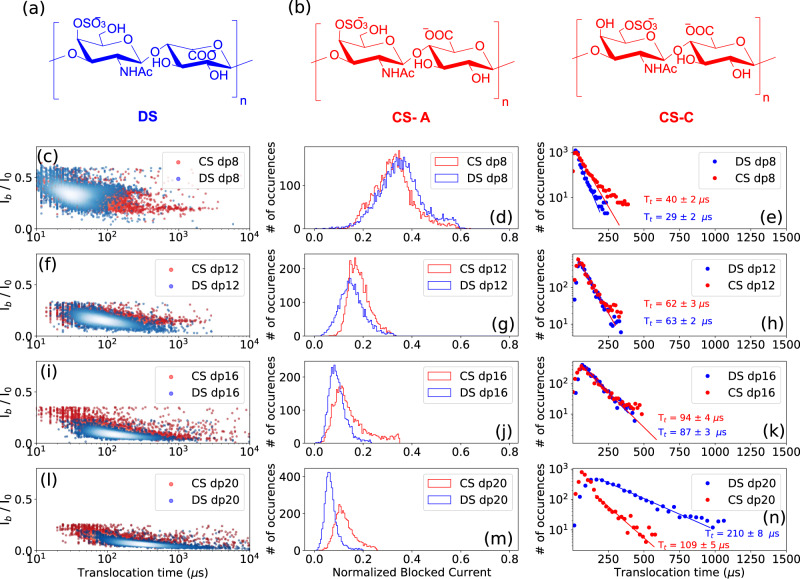
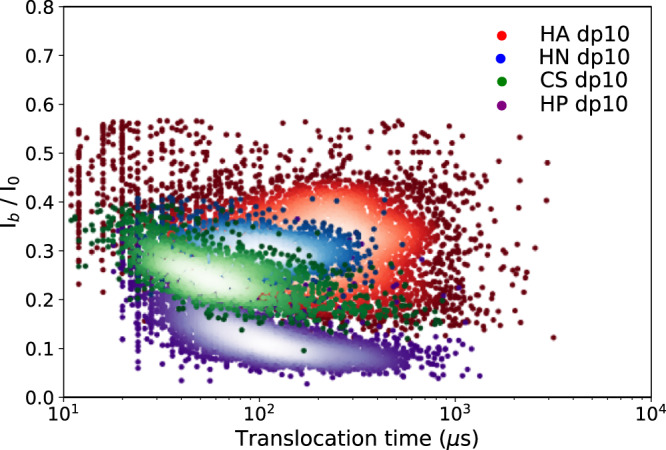
Glycosaminoglycans are highly anionic functional polysaccharides with information content in their structure that plays a major role in the communication between the cell and the extracellular environment. The study presented here reports the label-free detection and analysis of glycosaminoglycan molecules at the single molecule level using sensing by biological nanopore, thus addressing the need to decipher structural information in oligo- and polysaccharide sequences, which remains a major challenge for glycoscience. We demonstrate that a wild-type aerolysin nanopore can detect and characterize glycosaminoglycan oligosaccharides with various sulfate patterns, osidic bonds and epimers of uronic acid residues. Size discrimination of tetra- to icosasaccharides from heparin, chondroitin sulfate and dermatan sulfate was investigated and we show that different contents and distributions of sulfate groups can be detected. Remarkably, differences in α/β anomerization and 1,4/1,3 osidic linkages can also be detected in heparosan and hyaluronic acid, as well as the subtle difference between the glucuronic/iduronic epimers in chondroitin and dermatan sulfate. Although, at this stage, discrimination of each of the constituent units of GAGs is not yet achieved at the single-molecule level, the resolution reached in this study is an essential step toward this ultimate goal.


Conflict of interest statement

The authors declare no competing interests.

Figures

Fig. 1
Fig. 1. Constituent disaccharide units of the different GAGs studied: heparin (HP), heparosan (HN), hyaluronic acid (HA), dermatan sulfate (DS), and chondroitin sulfate (CS).
The structural determinants studied are represented by different colors for the different types of monosaccharide units (d-Glc (dark blue), d-Gal (green), or uronic acid (black)), the type of glycosidic linkage within each disaccharide repeating unit (α−1,4 or β−1,4) and also between the disaccharide units (β−1,4 or β−1,3), the epimer position of the carboxylate group in uronic acid (encircled carboxylic acid at up (d-GlcA) or down (l-IdoA)) and also the presence or absence of sulfate groups.
Fig. 2
Fig. 2. Single-channel detection of heparin (HP) oligosaccharides in the dpn range between tetrasaccharide dp4 and icosasaccharide dp20 (dpn, n = 4-20) analyzed individually and in mixture by successive introduction of HP oligosaccharides into the cis compartment.
a Schematics of the experimental setup with aerolysin inserted in a lipid bilayer (not to scale). The ionic current is recorded while applying a constant voltage. b Illustration of typical single nanopore current recording in presence of HP dp10. The current is blocked by the presence of the molecule inside the channel (translocation). For each translocation event the blocked current Ib, the open pore current I0 and the duration of event Tt are calculated. c Scatter plot for HP dp10 with the associated current histogram, translocation time histogram with logarithmic binning and the corresponding integrated probability (red curve and right axis). The black dot represents the first event represented on b. The distortion of the event cloud at short timescale is due to the signal distortion from the low-pass filtering of the signal. d Scatter plots obtained for different sizes of HP oligosaccharides when they were analyzed individually. Each dot represents the translocation of a single molecule. At least 2000 events were recorded for each molecule type. e Integrated probability of translocation for different sizes of HP oligosaccharides. Scatter plots of the f HP dp4, g mixture of HP dp4 and HP dp6, h mixture of HP dp4, HP dp6 and HP dp10, i mixture of HP dp4, HP dp6, HP dp10 and HP dp16, and j mixture of HP dp4, HP dp6, HP dp10, HP dp16 and HP dp20. The relative density of events on the plots is highlighted by the markers color: the brighter the dot, the denser the events. Progressive appearing of the deeper and longer events is clearly seen by the shift of the clouds of events towards long translocation times. All data were recorded in 4 M LiCl, 25 mM HEPES buffer and 1.0 mM EDTA at pH 7.5, 20.0 °C, at the bias voltage of +60 mV and using 43 μM of each oligosaccharide. For mixture analysis, oligosaccharides were added one by one at the same concentration (10 μM) to the cis chamber and the residual current was measured. Source data for this figure are provided as a Source Data file.
Fig. 3
Fig. 3. Investigation of size discrimination of heparin polysaccharides using AeL nanopore.
Scatter plots derived from HP polysaccharides with the average molecular weights of a 5 kDa, b 11 kDa and c 16 kDa; and d of enoxaparin with the average molecular weight of 4.5 kDa. e Superimposed translocation time histograms corresponding to ad scatter plots. Distinct translocation times are observed for three different sizes of HP polysaccharides. Enoxaparin distribution is clearly not mono-exponential contrarly to other samples. The timescales resulting from mono-exponential fits are 406 ± 15 µs, 1279 ± 30 µs, 1717 ± 73 µs and 278 ± 24 µs for HP 5 kDa (dp18), HP 11 kDa (dp38), HP 16 kDa (dp55) and enoxaparin, respectively. f Superimposed Ib histograms corresponding to a, d scatter plots. The superimposed Ib histograms of enoxaparin and 5 kDa HP show that enoxaparin has a rather broad distribution of oligosaccharides compared to 5 kDa HP despite their close average molecular weights. g Translocation time versus polymerization degree from data of Figs. 2 and 3e. The straight line is a guide to the eye and the errors bars represent the statistical standard deviation resulting from the curve fitting procedure of the distribution. The mean translocation time would be about 40 µs per monomer. The deviation from the linearity for short oligo length is due to the signal distortion at short timescales. All data were recorded in 4 M LiCl, 25 mM HEPES buffer and 1.0 mM EDTA at pH 7.5, 20.0 °C, and at the bias voltage of +60 mV. Source data for this figure are provided as a Source Data file.
Fig. 4
Fig. 4. Discrimination of the non-sulfated heparosan and fully sulfated heparin oligosaccharides analyzed individually and in mixture.
a Structures of the heparosan and heparin. Superimposed scatter plots of b HN dp6 and HP dp6, d HN dp10 and HP dp10, and f HN dp20 and HP dp20. Scatter plot of the mixture of c HN dp6 and HP dp6, e HN dp10 and HP dp10, and g HN dp20 and HP dp20. Discrimination between HP and HN oligosaccharides in each size class is observed. All data were recorded in 4 M LiCl, 25 mM HEPES buffer and 1.0 mM EDTA at pH 7.5, 20.0 °C, and at the bias voltage of +60 mV. The concentrations in the mixture for HN and HP dp6 were 50 μM and 10 μM, respectively; HN and HP dp10 were 50 μM and 25 μM, respectively; and. HN and HP dp20 were 10.5 μM and 3.5 μM, respectively. In order to avoid pore closure, lower concentrations were used for the dp20 chains. Source data for this figure are provided as a Source Data file.
Fig. 5
Fig. 5. Effect of the osidic bond on the translocation behavior of the GAGs.
a Structures of the heparosan (HN) and hyaluronic acid (HA). Superimposed scatter plots of the b HA dp6 and HN dp6, d HA dp8 and HN dp8, and f HA dp10 and HN dp10. Superimposed Tt histograms of the c HA dp6 and HN dp6, e HA dp8 and HN dp8, and g HA dp10 and HN dp10. A noticeable difference in translocation time is observed between HA and HN oligosaccharides. HA oligosaccharides show a much steeper ramp in increase of the Tt as a function of size than HN oligosaccharides. The time distributions were fitted to a mono-exponential function leading to the timescales given on the corresponding graphs. All data were recorded in 4 M LiCl, 25 mM HEPES buffer and 1.0 mM EDTA at pH 7.5, 20.0 °C, and at the bias voltage of +60 mV. Source data for this figure are provided as a Source Data file.
Fig. 6
Fig. 6. Probing the effect of GlcA / IdoA epimerization on the translocation behavior of the GAGs.
Structure of a dermatan sulfate (DS) and b chondroitin sulfate (CS) A and C. Superimposed scatter plots of the c DS dp8 and CS dp8 f DS dp12 and CS dp12, i DS dp16 and CS dp16, and l DS dp20 and CS dp20. Superimposed Ib histograms of the d DS dp8 and CS dp8 g DS dp12 and CS dp12, j DS dp16 and CS dp16, and m DS dp20 and CS dp20. Superimposed Tt histograms of the e DS dp8 and CS dp8, h DS dp12 and CS dp12, k DS dp16 and CS dp16, and n DS dp20 and CS dp20. Slightly deeper current blockades are observed for DS oligosaccharides suggesting a larger spatial volume of DS compared to CS oligosaccharides. While DS dp8 presents a slightly shorter Tt compared to CS dp8, DS and CS dp12 and dp16 oligosaccharides show comparable dwell times, and a longer Tt is observed for the DS dp20 compared to CS dp20. The time distributions were fitted to a monoexponential function leading to the timescales given on the corresponding graphs. All data were recorded in 4 M LiCl, 25 mM HEPES buffer and 1.0 mM EDTA at pH 7.5, 20.0 °C, and at the bias voltage of +60 mV. Source data for this figure are provided as a Source Data file.
Fig. 7
Fig. 7. Superimposed scatter plot of events observed with dp10 oligosaccharides of hyaluronic acid (HA), heparosan (HN), chondroitin sulfate (CS), heparin (HP).
It shows the differences between the various families of oligosaccharides observed in this study. They vary by their osidic bond (HA vs HN), building block (HA vs CS) or degree of sulfation (HP vs HN). The timescales of translocation and the blocked current are different for each species and the event cluster are distinguishable, establishing a fingerprint of these oligosaccharides. All the experiments were performed using similar experimental conditions: 4 M LiCl, 25 mM HEPES buffer and 1.0 mM EDTA at pH 7.5, 20.0 °C, and at the bias voltage of +60 mV. Concentrations of HN and HA dp10 were 100 μM, and HP and CS dp10 were 43 μM. Source data for this figure are provided as a Source Data file.

Similar articles

Cited by

References

    1. Ricard-Blum S, Lisacek F. Glycosaminoglycanomics: where we are. Glycoconj. J. 2017;34:339–349. - PubMed
    1. Lepedda, A. J. et al. Glycosaminoglycans: from vascular physiology to tissue engineering applications. Front. Chem. 9, 680836 (2021). - PMC - PubMed
    1. Kjellén L, Lindahl U. Specificity of glycosaminoglycan–protein interactions. Curr. Opin. Struct. Biol. 2018;50:101–108. - PubMed
    1. Pepi, L. E., Sanderson, P., Stickney, M. & Amster, I. J. Developments in mass spectrometry for glycosaminoglycan analysis: a review. Mol. Cell. Proteomics20, 100025 (2021). - PMC - PubMed
    1. Compagnon I, Schindler B, Renois-Predelus G, Daniel R. Lasers and ion mobility: new additions to the glycosaminoglycanomics toolkit. Curr. Opin. Struct. Biol. 2018;50:171–180. - PubMed

Publication types