Randomized Controlled Trial
. 2022 Aug 30;13(1):4940.
doi: 10.1038/s41467-022-32289-x.

A Pilot randomized trial to examine effects of a hybrid closed-loop insulin delivery system on neurodevelopmental and cognitive outcomes in adolescents with type 1 diabetes

Collaborators, Affiliations
Randomized Controlled Trial

A Pilot randomized trial to examine effects of a hybrid closed-loop insulin delivery system on neurodevelopmental and cognitive outcomes in adolescents with type 1 diabetes

Allan L Reiss et al. Nat Commun. .

Abstract

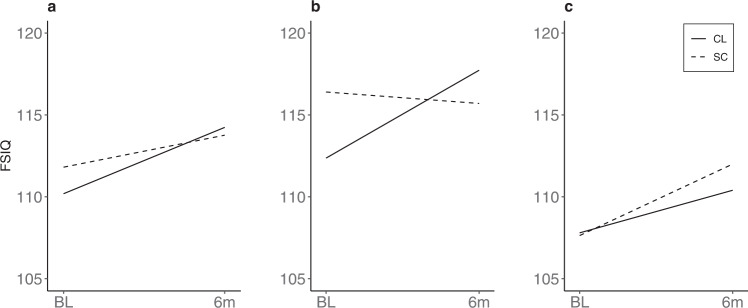
Type 1 diabetes (T1D) is associated with lower scores on tests of cognitive and neuropsychological function and alterations in brain structure and function in children. This proof-of-concept pilot study (ClinicalTrials.gov Identifier NCT03428932) examined whether MRI-derived indices of brain development and function and standardized IQ scores in adolescents with T1D could be improved with better diabetes control using a hybrid closed-loop insulin delivery system. Eligibility criteria for participation in the study included age between 14 and 17 years and a diagnosis of T1D before 8 years of age. Randomization to either a hybrid closed-loop or standard diabetes care group was performed after pre-qualification, consent, enrollment, and collection of medical background information. Of 46 participants assessed for eligibility, 44 met criteria and were randomized. Two randomized participants failed to complete baseline assessments and were excluded from final analyses. Participant data were collected across five academic medical centers in the United States. Research staff scoring the cognitive assessments as well as those processing imaging data were blinded to group status though participants and their families were not. Forty-two adolescents, 21 per group, underwent cognitive assessment and multi-modal brain imaging before and after the six month study duration. HbA1c and sensor glucose downloads were obtained quarterly. Primary outcomes included metrics of gray matter (total and regional volumes, cortical surface area and thickness), white matter volume, and fractional anisotropy. Estimated power to detect the predicted treatment effect was 0.83 with two-tailed, α = 0.05. Adolescents in the hybrid closed-loop group showed significantly greater improvement in several primary outcomes indicative of neurotypical development during adolescence compared to the standard care group including cortical surface area, regional gray volumes, and fractional anisotropy. The two groups were not significantly different on total gray and white matter volumes or cortical thickness. The hybrid closed loop group also showed higher Perceptual Reasoning Index IQ scores and functional brain activity more indicative of neurotypical development relative to the standard care group (both secondary outcomes). No adverse effects associated with study participation were observed. These results suggest that alterations to the developing brain in T1D might be preventable or reversible with rigorous glucose control. Long term research in this area is needed.


Conflict of interest statement

N.M. had institutional device supply agreements from Medtronic for CGM and LifeScan for test strips for the study, research support from Novo Nordisk. B.B. had consultant agreements with Medtronic Diabetes, Novo Nordisk, Dexcom, ConvaTec, Lilly, and Tolerion; has provided expert testimony for Dexcom; and has research grants with Insulet, Tandem, Medtronic, and Beta Bionics. E.T. had institutional research grants with AstraZeneca, Boehringer Ingelheim, Novo Nordisk, Grifols Therapeutics, Takeda, and Amgen. S.A.W. had consultant agreements with Zealand; institutional grant support from Abbott and Medtronic; and speaker honoraria from Abbott, Dexcom, and Insulet. L.A.F. had a device supply agreement with Dexcom. A.M.A. had a device supply agreement with Dexcom. M.T. had a data safety monitoring board agreement with Daiichi Sankyo. W.T. had consultant agreements with AstraZeneca, Boehringer Ingelheim, Eli Lilly, Novo Nordisk, and Sanofi and data safety monitoring board agreements with Eisai, MannKind, and Tolerion. K.E. had a consultant agreement with PicoLife Technology. J.L. received consulting fees, paid to his institution, from Animas Corporation, Bigfoot Biomedical, Tandem Diabetes Care, and Eli Lilly and Company. No other potential competing interests relevant to this article were reported.

Figures

Fig. 1
Fig. 1. Group differences in brain structure over time.
Trajectories for (a) average cortical thickness (mm), (b) total surface area (cm2), and (c) caudate volume (mm3) are shown for Closed Loop (CL) and Standard Care (SC) groups.
Fig. 2
Fig. 2. Longitudinal differences in cortical gray matter between groups.
Corrected significance map showing cortical areas that exhibited a significant interaction of group by time in vertex-wise repeated measures ANOVAs that controlled for age and total brain volume in analyses of volume (a) and surface area (b), and that controlled for age in analyses of the thickness (c). Significance maps were thresholded using a two-tailed alpha level of 0.05, corrected for multiple comparisons. Cool colors indicate greater reductions over time in the Closed Loop (CL) group relative to the Standard Care (SC) group. The two left columns show the lateral and medial surfaces of the left hemisphere, respectively. The two right columns show the lateral and medial surfaces of the right hemisphere, respectively.
Fig. 3
Fig. 3. Longitudinal differences in whole-brain gray matter between groups.
Brain maps resulting from voxel-based morphometry analysis showing the location of significant between-group differences in regional gray matter trajectories. Regional differences in brain volume between participants in the closed-loop (CL) and standard care (SC) groups were analyzed using voxel-wise repeated measures general linear model, covarying for average total gray matter (or white matter) volume and age. Significance maps were thresholded using a two-tailed alpha level of 0.05, corrected for multiple comparisons. a 3D surface rendering of the cluster (light gray) that exhibits between-group differences, corrected for multiple comparisons. b Voxel-wise P value map of gray matter growth differences within the significant cluster. Cool colors indicate greater reductions over time in the Closed Loop (CL) group relative to the Standard Care (SC) group.
Fig. 4
Fig. 4. Longitudinal differences in brain activation between groups.
Results from fMRI analyses showing a greater reduction in activation over time in the Closed Loop (CL) relative to the Standard Care (SC) group. a Line chart showing changes in regional activity over time by group based on mixed-effects modeling conditional on age (Y axis is in arbitrary units or “AU”). The right panel (b, c) shows brain areas that exhibited a significant interaction of group by time in voxel-wise linear mixed effects controlling for age. Significance maps were thresholded using a two-tailed alpha of 0.05, corrected for multiple comparisons. Cool colors indicate reduced activation over time in the CL relative to the SC group. Group by time differences were predominantly located in subregions of the executive function network, including the right inferior frontal gyrus and right parietal cortex as well as the dorsal anterior cingulate cortex. Panel b displays a sagittal view of the brain; panel c displays a coronal view.
Fig. 5
Fig. 5. Moderator of treatment effect on cognitive trajectories.
% Glucose >250 mg/dl as a moderator of treatment effect on Full-Scale IQ (FSIQ): a overall intention-to-treat effect in the total sample. b Baseline % glucose >250 mg/dl < =25%. c Baseline % glucose >250 mg/dl >25%. Line charts show change from baseline (BL) to end of study at 6 months (6 m). Trajectories for Closed Loop (CL) and Standard Care (SC) groups are shown.
Fig. 6
Fig. 6. Correlation between change in glucose sensor values and change in cognitive and imaging metrics over time.
Association of change from baseline to 6 months in (a) Perceptual Reasoning Index (PRI) with % time in range (TIR) nighttime and (b) cortical surface area (SA) with % glucose >250 mg/dl nighttime. Closed Loop (CL) group shown by solid diamonds, Standard Care (SC) groups by open circles.

References

    1. Bober E, Buyukgebiz A. Hypoglycemia and its effects on the brain in children with type 1 diabetes mellitus. Pediatr. Endocrinol. Rev. 2005;2:378–382. - PubMed
    1. Urakami T. Severe hypoglycemia: is it still a threat for children and adolescents with type 1 diabetes? Front Endocrinol. 2020;11:609. doi: 10.3389/fendo.2020.00609. - DOI - PMC - PubMed
    1. Ahmet A, Dagenais S, Barrowman NJ, Collins CJ, Lawson ML. Prevalence of nocturnal hypoglycemia in pediatric type 1 diabetes: a pilot study using continuous glucose monitoring. J. Pediatr. 2011;159:297–302.e291. doi: 10.1016/j.jpeds.2011.01.064. - DOI - PubMed
    1. Shivaprasad, C. et al. Continuous glucose monitoring for the detection of hypoglycemia in patients with diabetes of the exocrine pancreas. J. Diabetes Sci. Technol. 15, 1313–1319 (2020). - PMC - PubMed
    1. Jaser SS, Jordan LC. Brain health in children with type 1 diabetes: risk and protective factors. Curr. Diab Rep. 2021;21:12. doi: 10.1007/s11892-021-01380-w. - DOI - PMC - PubMed

Publication types

Associated data