. 2022 Aug 30;13(1):5114.
doi: 10.1038/s41467-022-32791-2.

Single-cell transcriptome and translatome dual-omics reveals potential mechanisms of human oocyte maturation

Affiliations

Single-cell transcriptome and translatome dual-omics reveals potential mechanisms of human oocyte maturation

Wenqi Hu et al. Nat Commun. .

Abstract

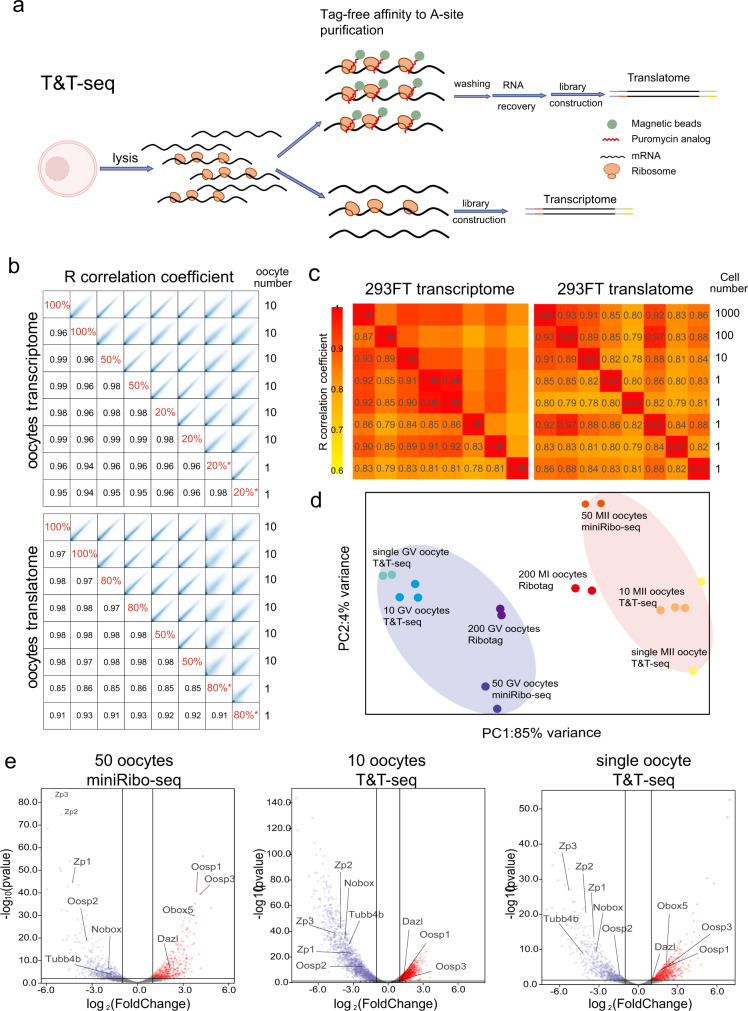
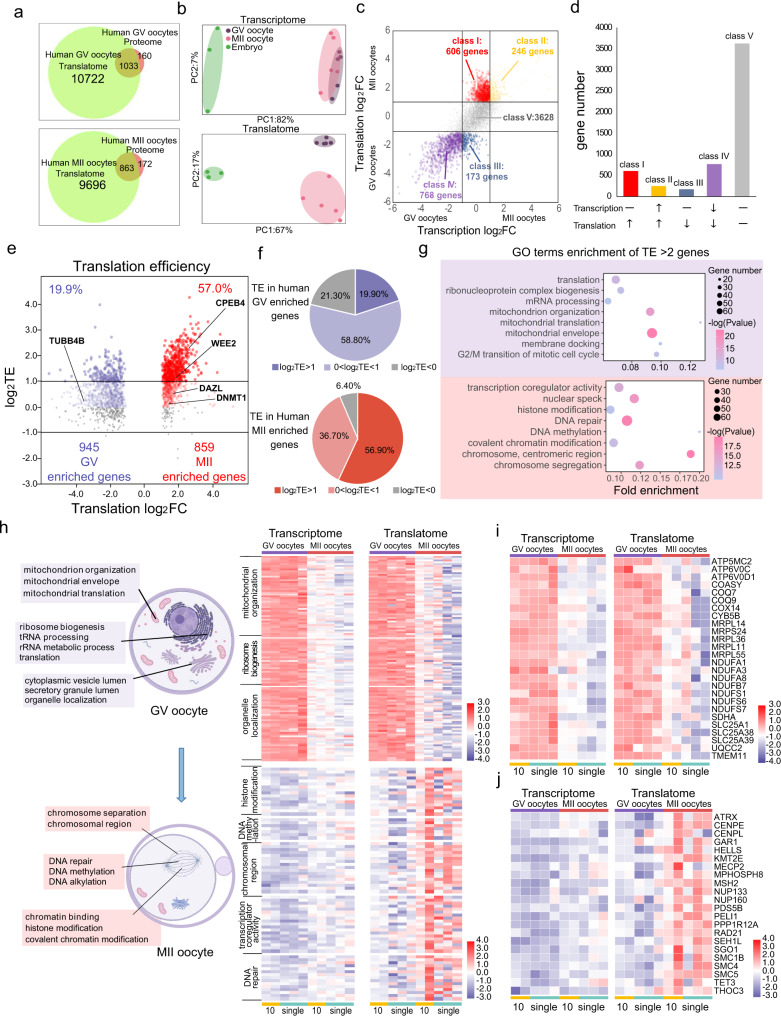
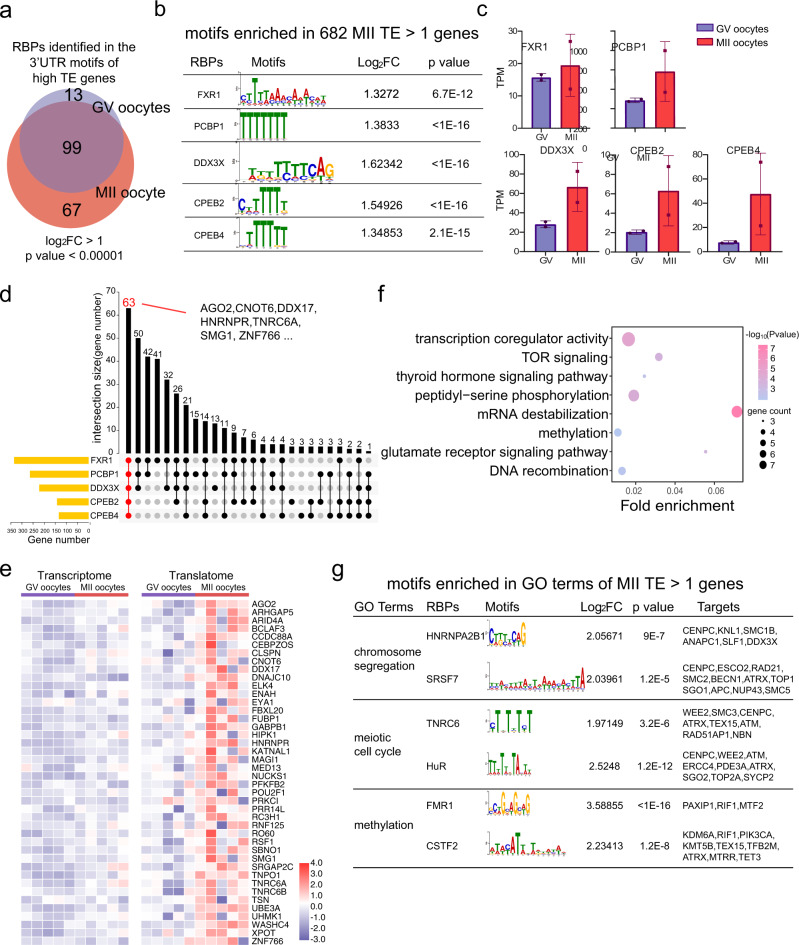
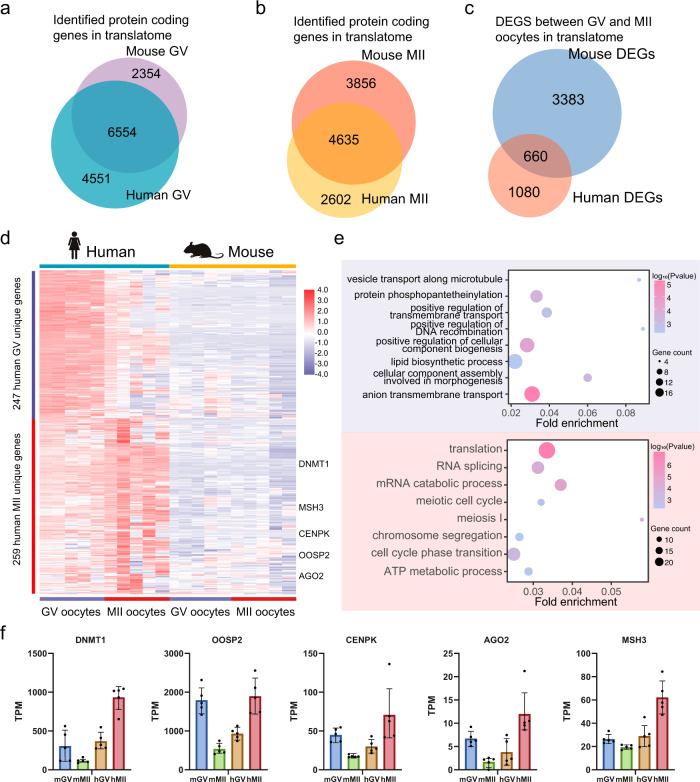
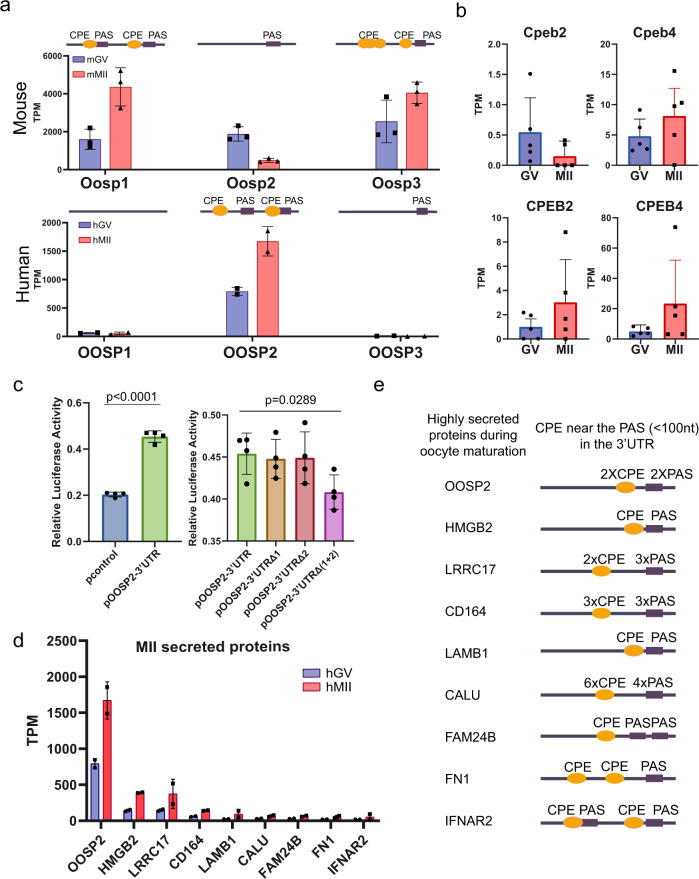
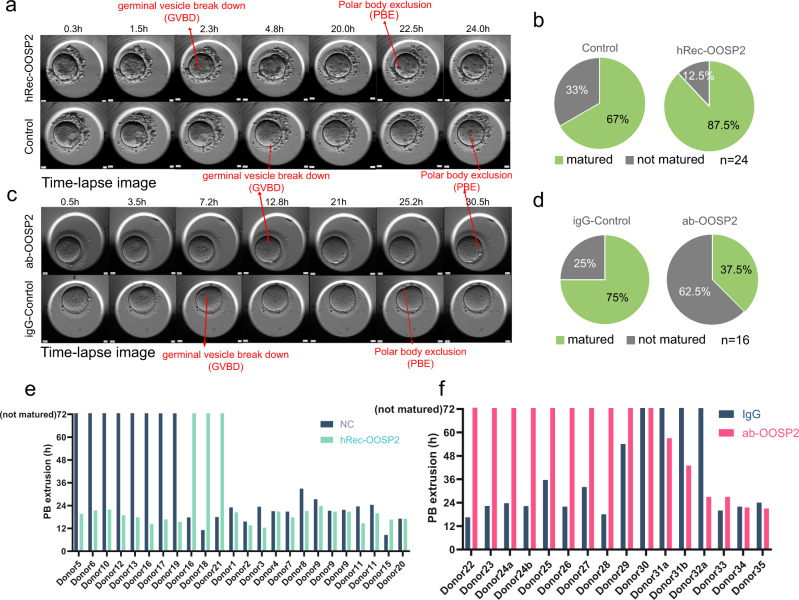
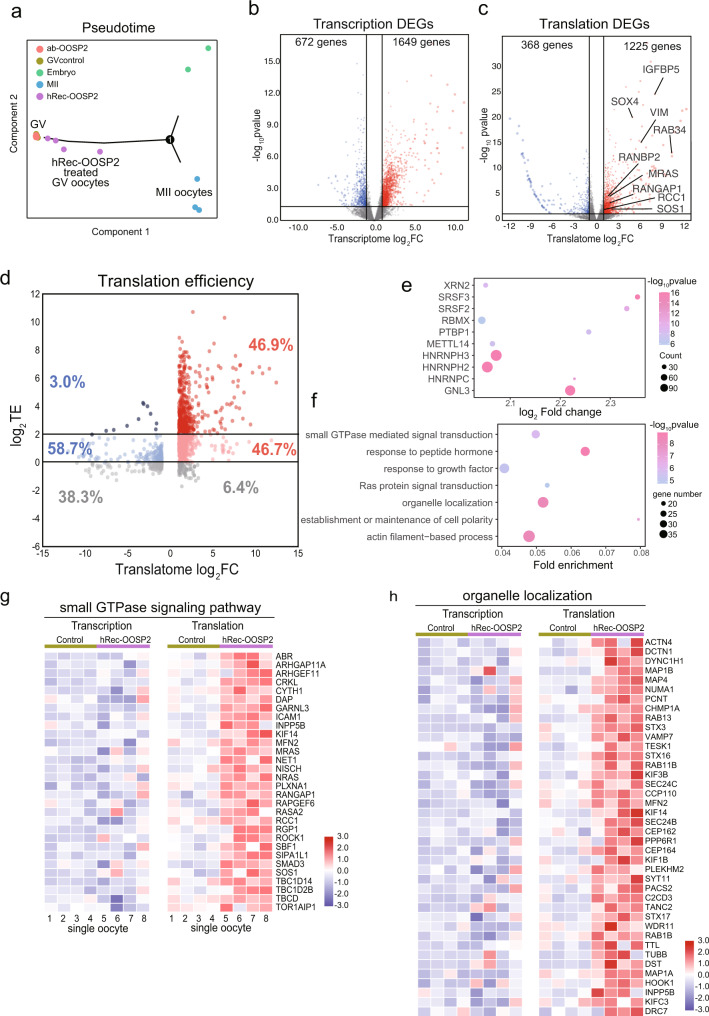
The combined use of transcriptome and translatome as indicators of gene expression profiles is usually more accurate than the use of transcriptomes alone, especially in cell types governed by translational regulation, such as mammalian oocytes. Here, we developed a dual-omics methodology that includes both transcriptome and translatome sequencing (T&T-seq) of single-cell oocyte samples, and we used it to characterize the transcriptomes and translatomes during mouse and human oocyte maturation. T&T-seq analysis revealed distinct translational expression patterns between mouse and human oocytes and delineated a sequential gene expression regulation from the cytoplasm to the nucleus during human oocyte maturation. By these means, we also identified a functional role of OOSP2 inducing factor in human oocyte maturation, as human recombinant OOSP2 induced in vitro maturation of human oocytes, which was blocked by anti-OOSP2. Single-oocyte T&T-seq analyses further elucidated that OOSP2 induces specific signaling pathways, including small GTPases, through translational regulation.


Conflict of interest statement

The authors declare no competing interests.

Figures

Fig. 1
Fig. 1. Transcriptomes and translatomes generated by T&T-seq of mouse single-oocytes and 293FT cells.
a Schematic diagram depicting major procedures and principles of T&T-seq. Created with BioRender.com. b Correlation coefficient of the transcriptome and translatome data from different oocyte lysate ratios and different oocyte numbers, * indicates single-oocyte samples. c Correlation coefficient heatmap of the transcriptomes and translatomes using different number of 293FT cells. d PCA plot of T&T-seq and Ribo-tag (published) sequencing data. Blue area covers GV oocytes and the red area covers MII oocytes. e Volcano plots showing DEGs identified by miniRibo-seq (50 oocytes) and T&T-seq (10 or single oocyte). p < 0.05, wald test, log2 foldchange > 1.
Fig. 2
Fig. 2. Distinct transcriptome and translatome patterns of GV and MII human oocytes.
a Venn plot showing the translated gene number using T&T-seq (TPM > 1) and the number of proteins detected in an independent study using 100 oocytes. b PCA plots of different development stages of human oocytes and embryos using T&T-seq. Green area covers morula embryos, purple covers GV oocytes, and pink covers MII oocytes. c Scatter plot showing the DEGs between GV and MII oocytes in transcriptome and translatome (TPM > 1 in both GV and MII oocytes), p < 0.05, wald test, log2 foldchange > 1. Class I (red) denotes genes translationally upregulated in MII translatome but transcriptionally constant in both stages. Class IV (purple) denotes genes with higher translation and transcription in GV oocytes. d Graph showing the number of genes in each class of c. Upward arrow indicates upregulated gene expression of either transcription or translation in MII oocytes. The downward arrow indicates downregulated gene expression of either transcription or translation in MII oocytes. Horizontal line indicates gene expression remains unchanged from GV to MII stages. e Volcano plot showing the translation efficiency (TE) changes from GV to MII stages. TE of each gene is depicted as log2TE in GV and MII oocytes. Red color denotes MII enriched genes. Blue color denotes GV enriched genes. Higher intensity of color indicates gene with higher TE. f Pie charts showing the proportion of different gene groups of TE of e. g Representative GO terms enrichment of TE > 2 (or log2TE > 1) genes. Purple background covers terms enriched in GV oocytes. Red background covers terms enriched in MII oocytes (p-value, hypergeometric test). h Representative GO terms with T&T expression heatmaps contrasting highly translated genes in GV and MII oocytes. Genes expression heatmaps of the same sets of genes and the same set of samples with specific GO terms. Created with BioRender.com. i Expression heatmap showing specific genes enriched in mitochondrial organization and mitochondrial translation GO terms. j Expression heatmap showing specific genes enriched in the chromosomal region and DNA methylation GO terms.
Fig. 3
Fig. 3. High TE genes carry RNA-binding-protein motifs at their 3’UTRs with high frequency.
a Venn plot of putative RBPs identified in 3’UTR motifs of high TE genes in GV and MII oocytes, log2Fold change > 1, p < 0.00001, one-sided t-test (see the “Methods” section). Blue circle covers RBPs bound to 3’UTR of high TE in GV oocytes. Red circle covers RBPs bound to 3’UTR of high TE in MII oocytes. Intercepted area indicates RBPs bound to 3’UTR of high TE in both GV and MII. b 5 RBPs with the high significant values and their binding motifs enriched in MII TE > 1 gene (p-value, one-sided t-test). c The translational expression levels in GV and MII of the top 5 RBPs shown in b. Data from two biological replicates of 10 human oocytes. Error bar denotes standard deviation (SD). d Upset plot showing the number of the overlapped targeted genes containing the five RBP motifs. 63 genes including AGO2, CNOT6 are potentially co-regulated by the 5 RBPs. e T&T heatmap of representative genes potentially co-regulated by 5 RBPs. f Representative GO terms of the genes co-regulated by the 5 RBPs (p-value, hypergeometric test). g motifs enriched in GO terms of MII TE > 1 genes (p-value, one-sided t-test).
Fig. 4
Fig. 4. Translatome difference between human and mouse.
a Veen plot shows overlap of translatome of GV oocytes between human and mouse. b Veen plot shows the overlap of translatome of GV oocytes between human and mouse. c Veen plot shows the overlap of DEGs identified by translatome between human and mouse. d Expression heatmap of human unique DEGs. e GO enrichment of human unique DEGs. Blue background shows terms enriched in human GV oocytes. Red background shows terms enriched in human GV oocytes. Specific human MII enriched genes are labeled on the right (p-value, hypergeometric test). Created with BioRender.com. f Translational expression levels of the representative genes of human and mouse GV and MII oocytes. Data from five biological replicates of human and mouse oocytes. Data are presented as mean values ± SD.
Fig. 5
Fig. 5. CPE motif in the 3’UTR regulate the oocyte secreted proteins.
a The translational expressions of OOSP gene family in human and mouse GV and MII oocytes. The CPE and PAS elements and positions at the 3’UTRs are indicated on the top of each mouse and human OOSP gene. are indicated on the right of mouse and human OOSP genes. Data from 2 biological replicates of 10 human oocytes and 3 biological replicates of 10 mouse oocytes. Error bar denotes SD. b Translational expressions of CPEB2 and CPEB4 n = 5 (including 10 and single oocyte data). Data are presented as mean values ± SD. c 3’-UTR Luciferase reporter assays of CPEB4 transfected with wild-type or the two mutated CPEB4 elements at the 3’-UTR of OOSP2. n = 4, (four independent biological replicates per 293FT cell populations, ∼25,000 cells in each sample, Unpaired two-sided t-test). Data are presented as mean values ± SD. d Translation expression levels of human MII enriched secreted proteins at GV and MII stages. Data from two biological replicates of 10 human oocytes. Error bar denotes SD. e 3’UTRs of the MII highly translated and secreted proteins showing the number and approximate location of CPE and PAS motifs.
Fig. 6
Fig. 6. OOSP2 promote human oocytes maturation in vitro.
a Time-lapse image showing the progressive maturation of human GV oocytes in hRec-OOSP2 containing medium (top row) and control medium (bottom row) with indicated time (h). Red arrows indicate the occurrence of GVBD or PBE. b Pie chart showing the maturation rate of hRec-OOSP2 treated oocytes and control oocytes. n = 24 (21 pairs of independent donors, each pair of oocytes was from the same donor. Chi-square = 2.9484, p = 0.08586, Chi-square test). c Time-lapse images showing the progressive maturation of human GV oocytes in antibody against OOSP2 (ab-OOSP2) containing medium (top row) and control medium (ig-Control, bottom row) with indicated time (h). Red arrows indicate the occurrence of GVBD or PBE. d Pie chart shows the maturation rate of ab-OOSP2 treated oocytes and igG control oocytes. n = 16 (14 pairs of independent donors, each pair of oocytes was from the same donor. Chi-square = 4.57143, p = 0.03251, Chi-square test). e PBE duration of each pair of oocytes in hRec-OOSP2 and control oocytes. PBE duration over 72 h is counted as not matured. f PBE duration of each pair of oocytes in ab-OOSP2 and the control oocytes. PBE duration over 72 h is counted as not matured.
Fig. 7
Fig. 7. Single-cell T&T-seq helps to reveal transcriptome and translatome changes after OOSP2 treated human oocytes.
a Pseudotime analysis showing the developmental stages of GV control oocytes, hRec-OOSP2 treated oocyte, ab-OOSP2 treated oocytes, MII oocytes, and morula embryos. b Volcano plot showing transcriptome DEGs of GV control oocytes versus hRec-OOSP2 treated oocyte (p-value, wald test) c Volcano plot showing translatome DEGs of GV control oocytes versus hRec-OOSP2 treated oocyte (p-value, wald test). d Volcano plot showing the TE changes after treated with hRec-OOSP2. TE of each gene is depicted as log2TE of control and hRec-OOSP2 treated oocytes. Red dot indicates upregulated genes in hRec-OOSP2 treated oocytes. Blue dot indicates GV enriched genes. The darker the color, the higher the TE. e Putative RBPs (top10 fold change) identified by 3’UTR motifs of TE > 4 genes after treated with hRec-OOSP2 (p-value, one-sided t-test). f Representative GO terms of TE > 4 genes after treated with hRec-OOSP2 (p-value, hypergeometric test). g, h T&T expression heatmap of the OOSP2 upregulated translational genes involved in small GTPase signaling pathway and organelle localization.

References

    1. Schwanhausser B, et al. Global quantification of mammalian gene expression control. Nature. 2011;473:337–342. - PubMed
    1. Wang ZY, et al. Transcriptome and translatome co-evolution in mammals. Nature. 2020;588:642–647. - PMC - PubMed
    1. Chen J, et al. Genome-wide analysis of translation reveals a critical role for deleted in azoospermia-like (Dazl) at the oocyte-to-zygote transition. Genes Dev. 2011;25:755–766. - PMC - PubMed
    1. Broix L, Turchetto S, Nguyen L. Coordination between transport and local translation in neurons. Trends Cell Biol. 2021;31:372–386. - PubMed
    1. Piccirillo CA, Bjur E, Topisirovic I, Sonenberg N, Larsson O. Translational control of immune responses: from transcripts to translatomes. Nat. Immunol. 2014;15:503–511. - PubMed

Publication types