. 2022 Aug 30;13(1):5099.
doi: 10.1038/s41467-022-32818-8.

Controlling gene expression with deep generative design of regulatory DNA

Affiliations

Controlling gene expression with deep generative design of regulatory DNA

Jan Zrimec et al. Nat Commun. .

Abstract

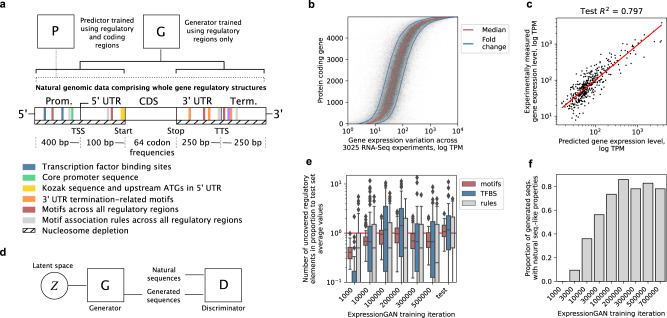
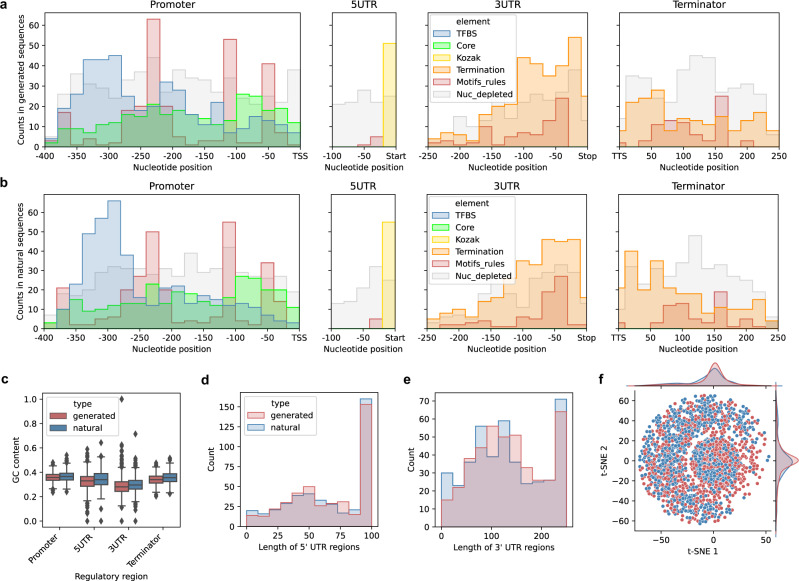
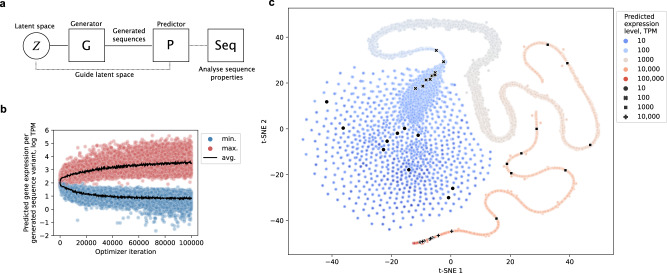
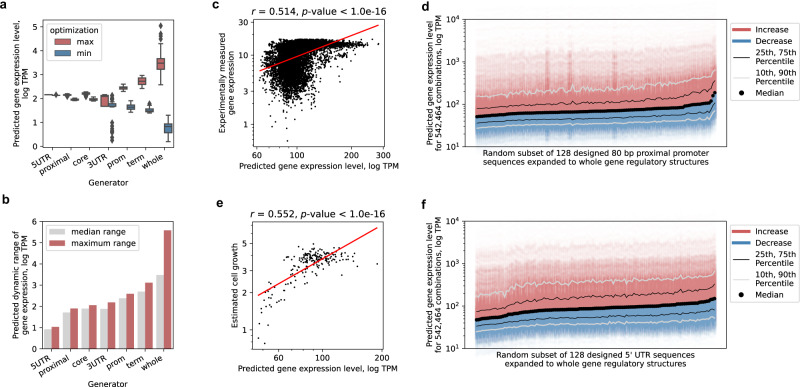
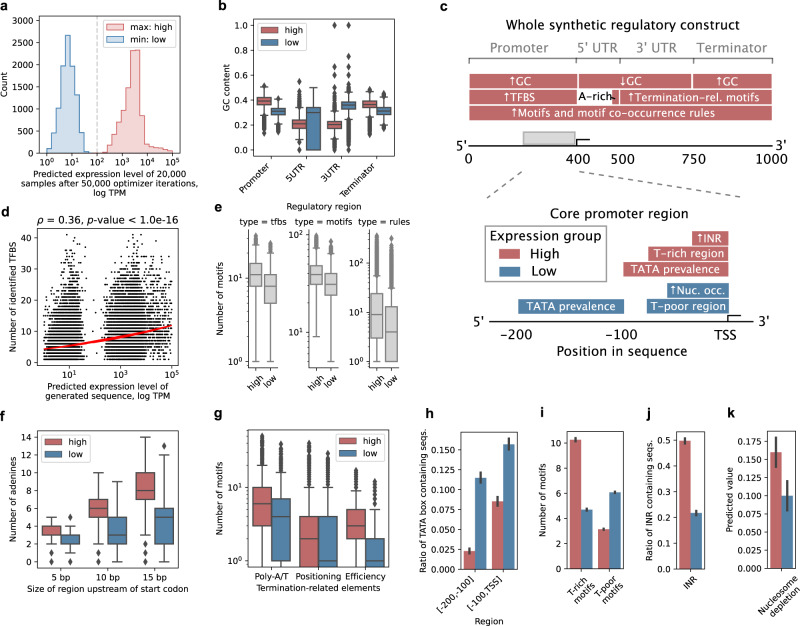
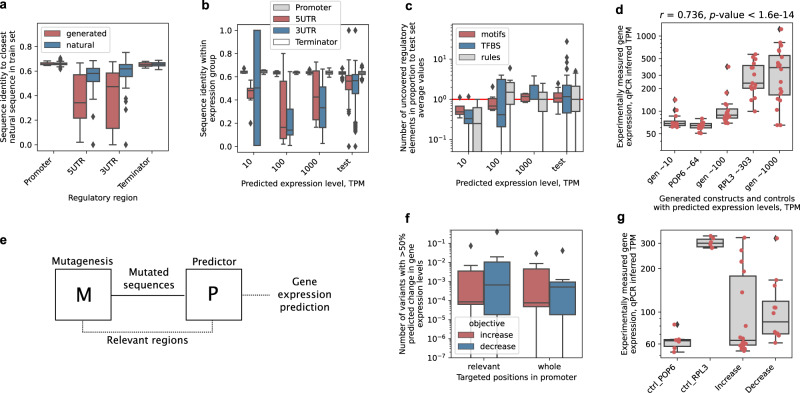
Design of de novo synthetic regulatory DNA is a promising avenue to control gene expression in biotechnology and medicine. Using mutagenesis typically requires screening sizable random DNA libraries, which limits the designs to span merely a short section of the promoter and restricts their control of gene expression. Here, we prototype a deep learning strategy based on generative adversarial networks (GAN) by learning directly from genomic and transcriptomic data. Our ExpressionGAN can traverse the entire regulatory sequence-expression landscape in a gene-specific manner, generating regulatory DNA with prespecified target mRNA levels spanning the whole gene regulatory structure including coding and adjacent non-coding regions. Despite high sequence divergence from natural DNA, in vivo measurements show that 57% of the highly-expressed synthetic sequences surpass the expression levels of highly-expressed natural controls. This demonstrates the applicability and relevance of deep generative design to expand our knowledge and control of gene expression regulation in any desired organism, condition or tissue.


Conflict of interest statement

The authors declare no competing interests.

Figures

Fig. 1
Fig. 1. Implementing a generative strategy to design regulatory DNA.
a Schematic depiction of the Saccharomyces cerevisiae natural genomic sequencing dataset was used to train both the predictive (P) and generative (G) models used in the study. The dataset spanned the whole gene regulatory structure of 1000 bp and included promoter, terminator, and untranslated regions (UTRs) as well as codon frequencies of coding regions. The different natural sequence properties related to DNA cis-regulatory grammar and further analyzed with the generator are indicted: transcription factor binding sites (TFBS, blue), core promoter elements (green), 5′ UTR elements (yellow), termination-related motifs (orange), deep learning-uncovered motifs (red) and motifs association rules (gray), and nucleosome depletion (dashed lines) (see Supplementary Table 1 for a full list of tested seq. properties). b Median expression levels per gene (red line) derived from 3025 RNA-Seq experiments, with a 1-fold change marked in either direction (blue lines). c Performance of the deep predictive model of gene expression on the test dataset (n = 424), trained on natural genomic sequences spanning the whole gene regulatory structure. Red line denotes the least squares fit. d Overview of the generative adversarial network (GAN) approach, which iteratively trains a generative and discriminative deep neural network, the former learning to generate realistic sequences using random points in the latent space and the latter learning to discriminate between natural and generated sequences, resulting in a highly accurate generator. e Proportion of TFBS (blue), DNA motifs (red), and motif association rules (gray) in samples of generated sequences across generator training iterations (n = 64 each) relative to average amounts found in the natural test set. Red line denotes an equal amount. Boxes denote interquartile (IQR) ranges, centers mark medians and whiskers extend to 1.5 IQR from the quartiles. f Relative amount of generated sequences with properties similar to those of the natural test set (see Supplementary Table 1 and Supplementary Fig. 2). Source data are provided as a Source Data file.
Fig. 2
Fig. 2. Deep learning-generated sequences exhibit properties of natural regulatory DNA.
a, b Cumulative positional distribution of known DNA regulatory grammar elements (see Fig. 1a) across the regulatory regions of a generated synthetic and b natural sequences (n = 425 each). Shown are yeast TFBS identified (q-value < 0.05) using FIMO (blue) and TATA core promoter elements, (green) in promoters, Kozak sequences, in 5′ UTRs (yellow), termination related motifs (positioning, efficiency and poly-AT motifs), in 3′ UTRs and terminators (orange), and deep learning-uncovered expression-related motifs and motif association rules (red) as well as nucleosome depletion, (gray) across all regions. Note that the amount of Kozak sequences and nucleosome depleted positions are not shown to scale, with 4-fold and 200-fold dilutions, respectively, to improve visualization (see separate comparisons across elements in Supplementary Fig. 3). TSS denotes the transcription start site, Start/Stop the coding sequence start/stop positions and TTS the transcription termination site. c GC content in the equal-sized subsets of generated synthetic (red) and natural test sequences (blue) across the regulatory regions (n = 425 each). d Distribution of 5′UTR lengths in the synthetic (red) and (blue) natural sequences. Boxes denote interquartile (IQR) ranges, centers mark medians and whiskers extend to 1.5 IQR from the quartiles. e Distribution of 3′UTR lengths in the synthetic (red) and natural (blue) sequences. f T-distributed stochastic neighbor embedding (t-SNE) dimensionality reduction over the sequence identity distance matrix among equal amounts of combined generated (red) and natural (blue) sequences (n = 2000 each). Source data are provided as a Source Data file.
Fig. 3
Fig. 3. Predictor-guided generator optimization enables gene-specific navigation of the regulatory sequence-expression landscape.
a Schematic depiction of the procedure to optimize the generator using a trained predictor, which introduces codon frequency information into the generative approach and explores the input latent space of the generator to produce sequence variants across the whole range of gene expression, providing precise navigation of the gene regulatory sequence-expression landscape. b Predicted expression levels of generated sequence variants across optimization iterations set to either maximize (red) or minimize (blue) expression levels (n = 64,000). Black lines denote average expression levels and TPM transcripts per million. c T-distributed stochastic neighbor embedding (t-SNE) mapping of the input latent subspaces that produce unique sequence variants spanning ~6 orders of magnitude of gene expression (black and colored dots: progression of low to high expression levels is marked with progression from blue to red, respectively), uncovered using the predictor-guided generator optimization. Black dots represent selections of 10 sequence variants per each of the 4 expression groups covering a 4 order-of-magnitude range of predicted expression levels from TPM ~10 to ~10,000. Source data are provided as a Source Data file.
Fig. 4
Fig. 4. Whole gene regulatory structure unlocks a wider range of expression control than single regulatory regions.
a Predicted gene expression levels with optimized generators of different single regulatory region parts or sequences spanning the whole gene regulatory structure (n = 64 per specific generator optimization target sample, maximization marked red, minimization blue). Boxes denote interquartile (IQR) ranges, centers mark medians and whiskers extend to 1.5 IQR from the quartiles. b Dynamic ranges between median (gray) and extreme values (red) in the optimized sequence samples from a. c Correlation analysis between published experimentally measured gene expression levels (defined medium) of 80 bp proximal promoter sequences (−170 to −90 relative to TSS) and our predictions (n = 10,282). Red line denotes the least-squares fit. The T-test was used. d Increases (red) and decreases (blue) of predicted gene expression levels with a random subset of the 80 bp proximal promoter designs when expanded and combined with all 4238 native gene regulatory structures to create 1000 bp constructs (n = 542,464). Black dots denote median levels, black lines the interquartile range and gray lines the 10th and 90th percentiles, respectively. e Correlation analysis between published estimated cell growth of 5′ UTR designs (at the optimal level of evolutionary rounds) and our predicted gene expression levels (n = 200). Red line denotes the least-squares fit. The T-test was used. f Increases (red) and decreases (blue) of gene expression levels with a random subset of the 5′ UTR designs when expanded and combined with all 4238 native gene regulatory structures to create 1000 bp constructs (n = 542,464). Black dots denote median levels, black lines the interquartile range and gray lines the 10th and 90th percentiles, respectively. Source data are provided as a Source Data file.
Fig. 5
Fig. 5. ExpressionGAN-generated regulatory DNA carries sequence determinants of gene expression control.
a Distribution of predicted expression levels of generated sequence samples from low (blue) and high (red) expression bins (n = 10,000 each) after 50,000 iterations of ExpressionGAN optimization (see Fig. 3). TPM denotes transcripts per million. bk Panels display sequence properties of the generated sequences from the low (blue) and high (red) expression bins. b GC content across the regulatory regions of the generated sequences (n = 10,000 each). c Overview of findings across the whole generated synthetic regulatory constructs as well as the core promoter regions. Nuc. occ. denotes higher nucleosome occupancy. d Correlation analysis between the amount of identified TFBS (FIMO q-value < 0.05) in promoters and predicted expression levels of the generated sequences (n = 20,000). Red line denotes the least squares fit. The T-test was used. e Amount of yeast transcription factor binding sites (TFBS) and deep learning-uncovered expression-related motifs and motif association rules (n = 10,000 each). f Amount of adenines conserved in 5, 10, and 15 bp 5′ UTRs upstream of the start codon (n = 10,000 each). g Number of termination-related elements, including Poly-A/T, positioning and efficiency motifs,, (n = 10,000 each). h Proportion of sequences carrying a conserved TATA box in the distal and proximal parts of the core promoter region (n = 10,000 each) (Fig. 5c). i Amount of T-rich and T-poor motifs in the region up to 75 bp upstream of the TSS, (n = 10,000 each). j Proportion of mammalian-type INR motifs in the region up to 30 bp upstream of the TSS (n = 10,000 each). k Proportion of predicted nucleosome depletion, in the region up to 50 bp upstream of the TSS, (n = 10,000 each). For box plots in b, eg, boxes denote interquartile (IQR) ranges, centers mark medians and whiskers extend to 1.5 IQR from the quartiles. For bar plots in hk, error bars represent 95% confidence intervals. Source data are provided as a Source Data file.
Fig. 6
Fig. 6. Gene expression control using generated regulatory DNA is validated in vivo.
a Sequence homology of the experimentally validated variants produced by generator optimization (red) (see Supplementary Table 2) and natural test sequences (blue) to the respective closest representative sequences in the training dataset across the 4 regions of the gene regulatory structure (n = 81 each). b Sequence homology within the experimentally validated expression groups spanning 3 orders of magnitude of predicted expression levels (TPM of ~10, ~100 and ~1000, Supplementary Table 2; n = 12, 18, 21, respectively) as well as the natural test set (n = 192), across the 4 regions of the gene regulatory structure: promoter (gray), 5′ UTR (red), 3′ UTR (blue), terminator (white). c Proportion of TFBS (blue), DNA motifs (red) and motif association rules (gray) in the experimentally validated generated sequence variants (n = 12, 18, 21, respectively) relative to average amounts found in the natural test set (n = 192). Red line denotes equal amount to natural test set. d Quantitative PCR (qPCR) measurements of mRNA levels with groups of generated sequence variants across 3 orders of magnitude of predicted expression levels (TPM of ~10, ~100 and ~1000, Supplementary Table 2; n = 12, 18, 21, respectively). Natural regulatory regions of the POP6 and RPL3 genes were used as low and high controls with a predicted TPM of 64 and 303, respectively (n = 15 each). Spearman correlation coefficient and T-test results shown. e Schematic depiction of the mutagenesis strategy that included in silico screening, where a random mutagenesis procedure (M) was coupled with a predictor (P) of yeast gene expression, which was also used to inform the mutational procedure on which positions were the most relevant to mutate. f Amount of mutated sequence variants that achieved an over 50% increase (red) or decrease (blue) in predicted gene expression levels by mutating 10% (40 bp) of whole promoter regions (400 bp) or only the most relevant promoter positions (n = 14 each). g Quantitative PCR (qPCR) measurements of mRNA levels with 10 mutated RPL3 sequence variants predicted to achieve ~2-fold increases (n = 18) or decreases (n = 12) in expression levels from the native regulatory sequence (see Supplementary Table 2). Native regulatory regions of the RPL3 and POP6 genes were used as high and low expression controls, respectively (predicted TPM of 303 and 64, respectively; n = 6 each). For box plots in ad, f, g, boxes denote interquartile (IQR) ranges, centers mark medians and whiskers extend to 1.5 IQR from the quartiles. Red dots in d, g show separate measurements. Source data are provided as a Source Data file.

References

    1. Dunbar, C. E. et al. Gene therapy comes of age. Science359, eaan4672 (2018). - PubMed
    1. Ko Y-S, et al. Tools and strategies of systems metabolic engineering for the development of microbial cell factories for chemical production. Chem. Soc. Rev. 2020;49:4615–4636. doi: 10.1039/D0CS00155D. - DOI - PubMed
    1. Zrimec, J., Buric, F., Kokina, M., Garcia, V. & Zelezniak, A. Learning the regulatory code of gene expression. Front. Mol. Biosci. 8, 673363 (2021). - PMC - PubMed
    1. Redden H, Alper HS. The development and characterization of synthetic minimal yeast promoters. Nat. Commun. 2015;6:7810. doi: 10.1038/ncomms8810. - DOI - PMC - PubMed
    1. Curran KA, et al. Design of synthetic yeast promoters via tuning of nucleosome architecture. Nat. Commun. 2014;5:4002. doi: 10.1038/ncomms5002. - DOI - PMC - PubMed

Publication types