. 2022 Aug 30;13(1):5110.
doi: 10.1038/s41467-022-32690-6.

Structure and dynamics of Toll immunoreceptor activation in the mosquito Aedes aegypti

Affiliations

Structure and dynamics of Toll immunoreceptor activation in the mosquito Aedes aegypti

Yoann Saucereau et al. Nat Commun. .

Abstract

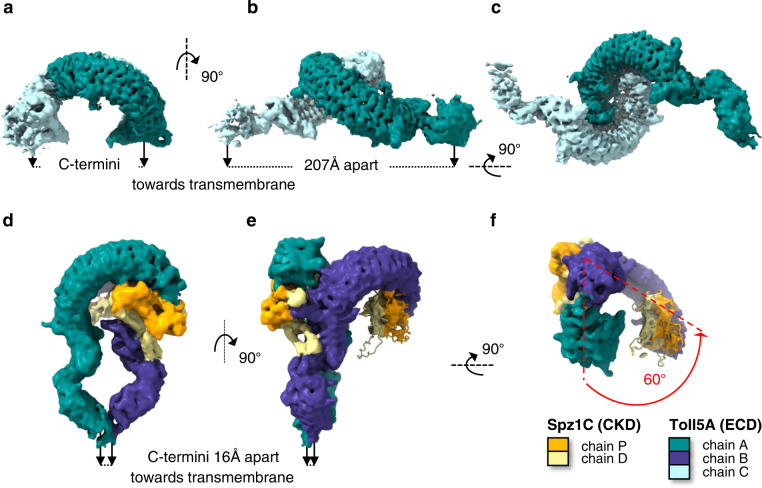
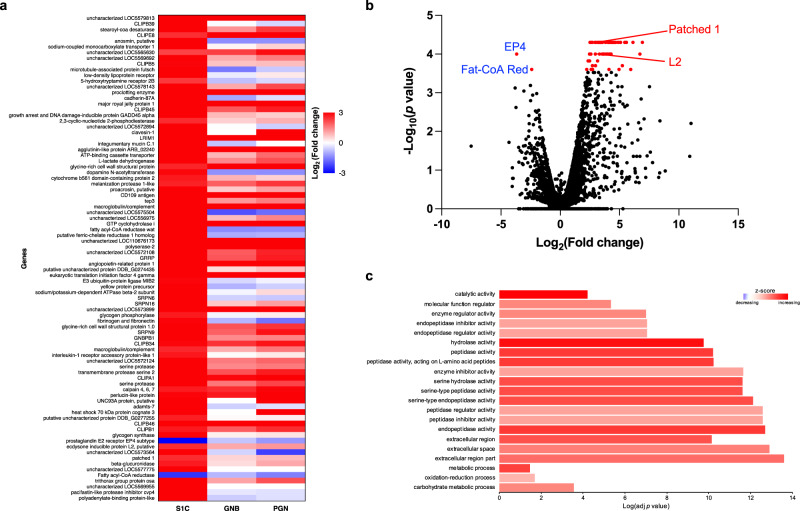
Aedes aegypti has evolved to become an efficient vector for arboviruses but the mechanisms of host-pathogen tolerance are unknown. Immunoreceptor Toll and its ligand Spaetzle have undergone duplication which may allow neofunctionalization and adaptation. Here we present cryo-EM structures and biophysical characterisation of low affinity Toll5A complexes that display transient but specific interactions with Spaetzle1C, forming asymmetric complexes, with only one ligand clearly resolved. Loop structures of Spaetzle1C and Toll5A intercalate, temporarily bridging the receptor C-termini to promote signalling. By contrast unbound receptors form head-to-head homodimers that keep the juxtamembrane regions far apart in an inactive conformation. Interestingly the transcriptional signature of Spaetzle1C differs from other Spaetzle cytokines and controls genes involved in innate immunity, metabolism and tissue regeneration. Taken together our results explain how upregulation of Spaetzle1C in the midgut and Toll5A in the salivary gland shape the concomitant immune response.


Conflict of interest statement

The authors declare no competing interests.

Figures

Fig. 1
Fig. 1. Cryo-EM structures of Toll5A homodimer and Spz1C-ligated heterodimer.
Orthogonal and bottom-up views of cryo-EM density maps. Density is colour-coded according to protein content. a–c Toll5A homodimer viewed in three different orientations. d–f Spz1C-bound heterodimer. f View from the membrane up to emphasize the asymmetry of the complex with a 60° deviation of chain B compared to chain A. The density of the second ligand is severely truncated compared to the first one probably due to lack of contact at the dimerization interface.
Fig. 2
Fig. 2. Ligand-induced asymmetry.
a Close-up top view of the homodimer interface with N-terminal receptor-receptor interactions at LRRNT1-LRR14 and accessible Z-loops. b Zoomed-in side view Spz1C concave binding to LRRNT1-LRR7. c Spz1C convex binding at the dimerization interface. Spz1C mediates extensive contacts between β-wings and the Toll5A Z-loop located between LRR14-LRR15 (Asn455-Asp465), with the distal Trp-loop stabilizing the hinge region between LRR domains. d Receptor-receptor contacts persist within the asymmetric heterocomplex. e Asymmetry in Spz1C. The proximal Trp-loop adopts a closed helical conformation with a buried Trp-31 that caps the primary receptor LRRNT1, both β-wings and the Z-loop, while the distal Trp-loop is extended and deviates from the core of the molecule, contributing to the asymmetry of the heterodimer complex.
Fig. 3
Fig. 3. Spz1C low affinity binding to Toll5A homodimer decreases protein complex flexibility.
a SPR binding analysis. Sensorgrams of Toll5A (acronym, T5A) run over a range of concentrations (0.1–7.5 μM) on an amine coupled Spz1C-chip (acronym, S1C). b SEC-SAXS dimensionless Kratky plot analysis at 50 μM. SEC-MALS analysis at 20 μM (c) and 50 μM (d) of Toll5A on its own (blue) and in complex with Spz1C (orange). Both MALS and SAXS were carried out upon loading ~50 μl samples at the given concentrations onto a Superose 6 size-exclusion chromatography column (GE Healthcare) in 50 mM Tris pH 7.5, 50 mM NaCl.
Fig. 4
Fig. 4. Slow exchanges in receptor-receptor interactions in the absence of ligand contrast with fast dynamics in the presence of ligand.
AUC sedimentation velocity profiles and the shifts in sedimentation coefficients are indicative of dynamical behaviour or the receptor in the presence and the absence of its ligand (a–b). Mass photometry (c–d) reveals the concentration-dependent stoichiometries of Toll5A and Spz1C. The single-ligated Toll5A dimer is detected at the lowest measurable concentration of 25 nM (c), whereas saturated dimer and ligated monomer appear at 50 nM and above (d).
Fig. 5
Fig. 5. Cleaved but not proprotein Spaetzle1C activates antimicrobial peptide production.
Spz1C activates a set of antimicrobial peptides (a), over a large range of concentrations (b), and in an isoform-specific manner (c). Expression of anti-microbial peptides in Aag2 cells at 12 hours after stimulation with heat-inactivated extract from Gram-negative bacteria (abbreviated GNB) or Spz1C (proS1C and S1C: before and after cleavage of the pro-domain, respectively) upon addition of purified protein at 100 nM in the media and RT-qPCR. Data are presented as box plot with whiskers min to max values. (n = 12 biologically independent experiments–Except “Vago” condition where n = 9) (b) Kinetics curves of GRRP expression in Aag2 cells after stimulation with different concentration of Spz1C (S1C). The fitted curve (in orange) represents smoothed conditional means calculated by ggPlot2 on R. Data are mean ± SEM. (n = 18 to 36 biologically independent experiments for each concentration). c Differences in Gambicin (Gam) expression upon Spz1C, Drosophila melanogaster Spz1 (DmS1), and Aedes aegypti Spz5 (S5) stimulation. Heat-inactivated E.coli extract (GNB) was used as a positive control and conditioning buffer was used as a negative control. Data are presented as box plot with whiskers min to max values. (n = 12 biologically independent experiments for “GNB” and “S1C” condition, n = 9 for “S5” condition and n = 3 for “DmS1” conditions). For all experiments, expression values (Log2(FC)) were determined using the ΔΔCT method with normalisation to mRNA levels of the eEFG1a housekeeping gene. The dotted line indicates a value of Fold Change=2 as we determined to the limit to have change in expression profile. All Statistical analyses were performed in R using one-sided Student T-test or Kruskal–Wallis test (according to application condition of each after testing normality and equality of variances of each condition) to compare result versus a FC > 2 with significance p value defined > 0.05. Stars indicate significance: * = p value < 0.05, ** = p value < 0.01, and *** = p value < 0.001. Source data are provided as a Source Data file.
Fig. 6
Fig. 6. Spz1C transcriptional signature in Aag2 cells by RNAseq analysis.
a Heat map of genes exhibiting different responses to S1C stimulation compared to MOCK-stimulated Aag2 cells. Corresponding gene expression is also shown for Gram-negative bacteria (GNB) and PGN stimulation. b Volcano plot of individual two-sided pairwise comparisons of S1C versus MOCK-stimulated Aag2 cells expression. Significantly differentially expressed genes (DE-genes) are in red, non-significant genes are in black. Data in a and b are represented using CummeRbund package 2.8.2 for visualization of CuffData objects generated by Cufflinks package 2.2.1. c Gene ontology (GO) term enrichment analysis. The GO annotation results were based on 84 genes identified by RNAseq (a). Gene ontology categories included molecular function (MF), cellular component (CC) and biological process (BP). GO categories for each function are sorted by increasing order of evidence, based on the GO enrichment test P value (<0.05) used by PANTHER pipeline 16.0.

References

    1. Gay NJ, Symmons MF, Gangloff M, Bryant CE. Assembly and localization of Toll-like receptor signalling complexes. Nat. Rev. Immunol. 2014;14:546–558. doi: 10.1038/nri3713. - DOI - PubMed
    1. Hoffmann, J. A. The immune response of Drosophila. Nature426, 33–38 (2003). - PubMed
    1. McIlroy G, et al. SI - Toll-6 and Toll-7 function as neurotrophin receptors in the Drosophila melanogaster CNS. Nat. Neurosci. 2013;16:1248–1256. doi: 10.1038/nn.3474. - DOI - PMC - PubMed
    1. Parker JS, Mizuguchi K, Gay NJ. A family of proteins related to Spatzle, the toll receptor ligand, are encoded in the Drosophila genome. Proteins. 2001;45:71–80. doi: 10.1002/prot.1125. - DOI - PubMed
    1. Hoffmann A, Neumann P, Schierhorn A, Stubbs MT. Crystallization of Spatzle, a cystine-knot protein involved in embryonic development and innate immunity in Drosophila melanogaster. Acta Crystallogr. Sect. F.-Struct. Biol. Cryst. Commun. 2008;64:707–710. doi: 10.1107/S1744309108018812. - DOI - PMC - PubMed

Publication types