. 2022 Sep;25(9):1225-1236.
doi: 10.1038/s41593-022-01151-0. Epub 2022 Aug 30.

Behaviorally relevant decision coding in primary somatosensory cortex neurons

Affiliations

Behaviorally relevant decision coding in primary somatosensory cortex neurons

Christina Buetfering et al. Nat Neurosci. 2022 Sep.

Erratum in

Abstract

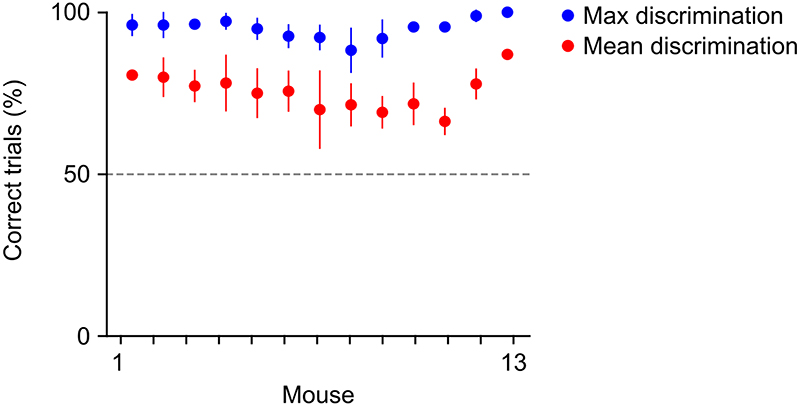
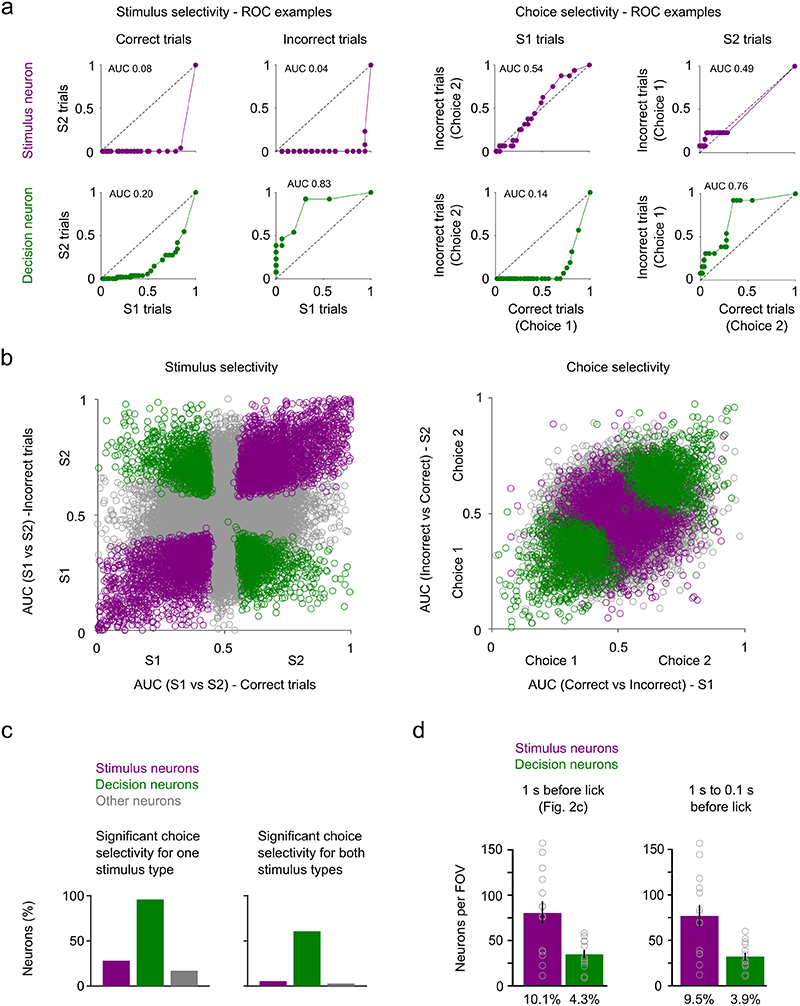
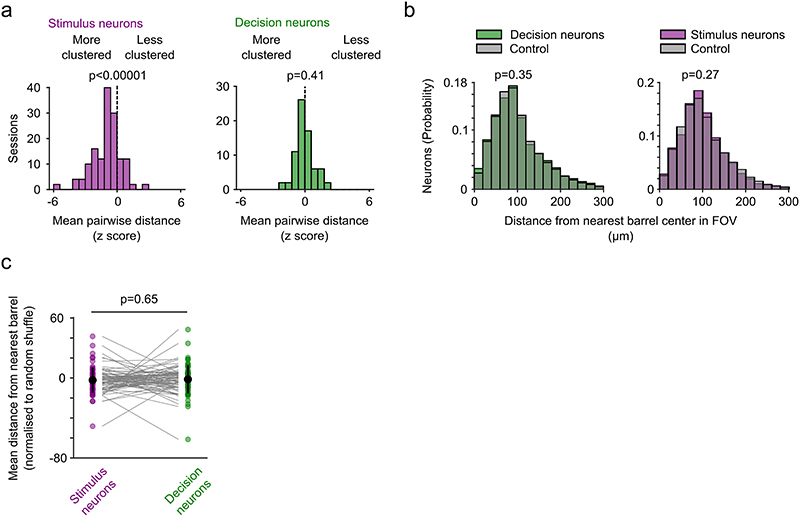
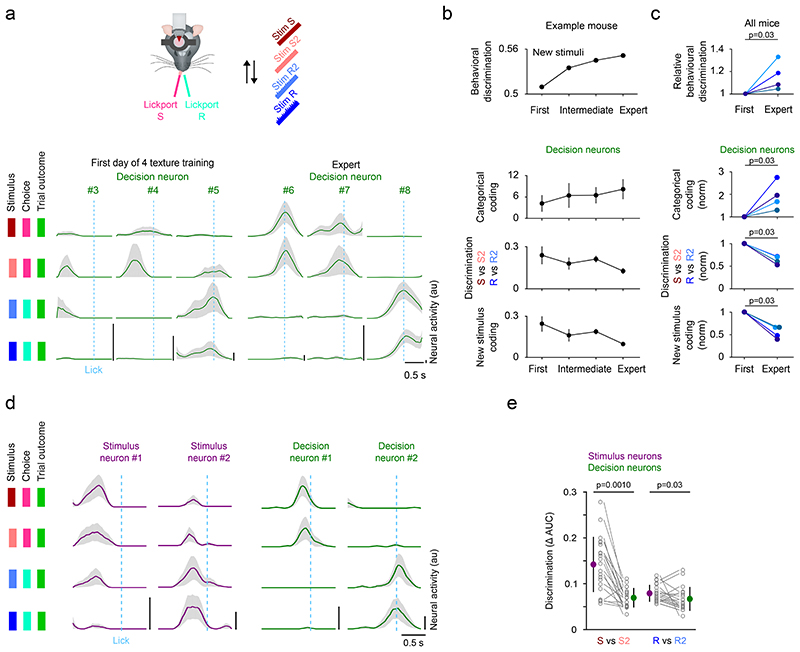
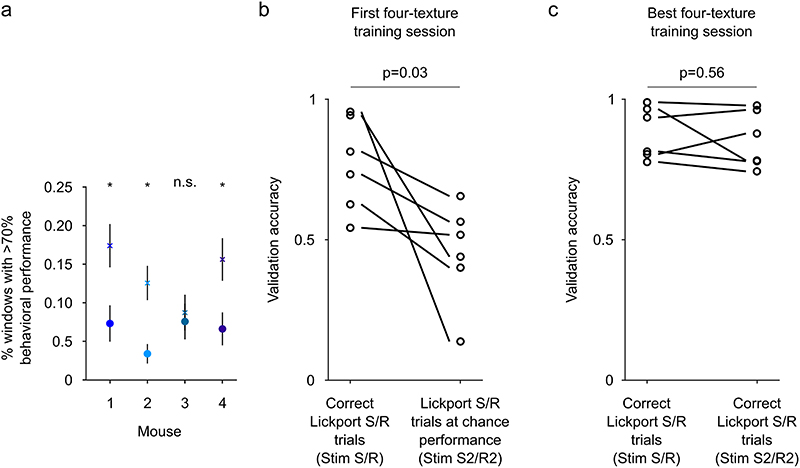
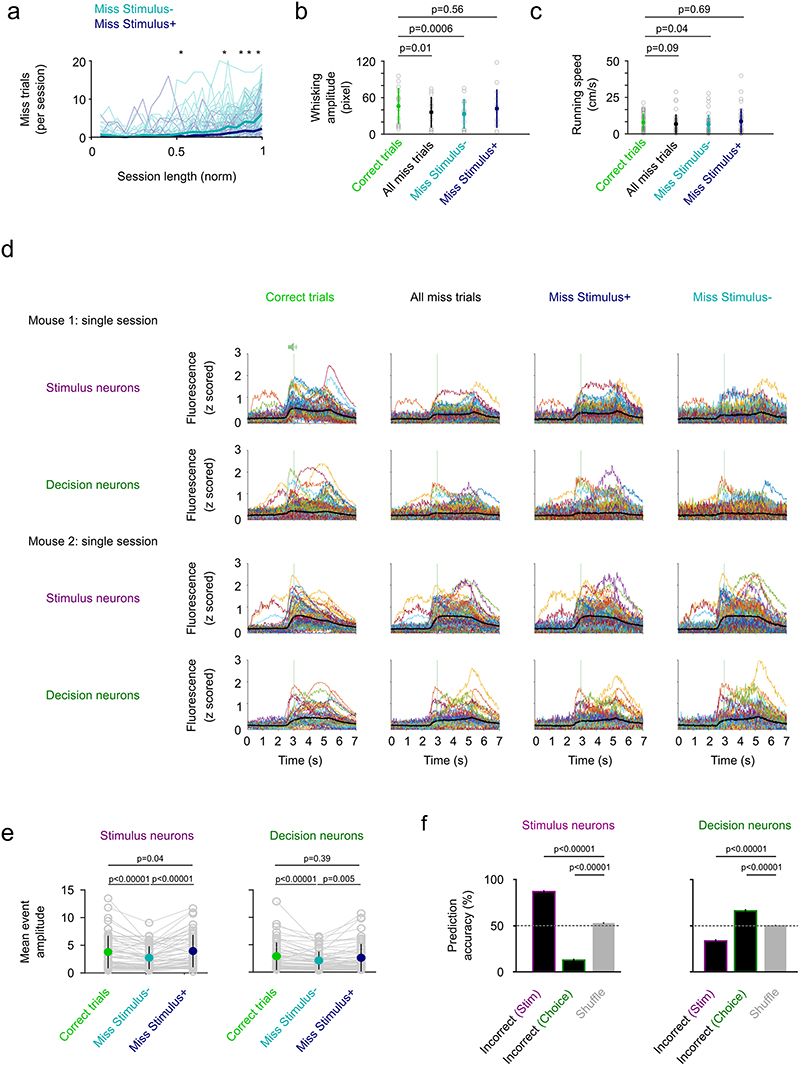
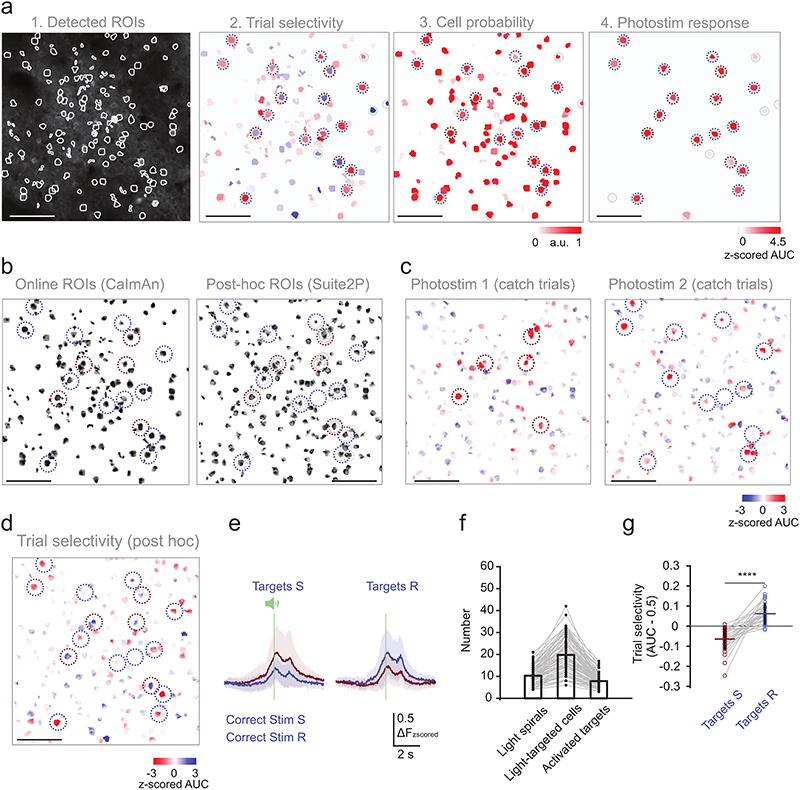
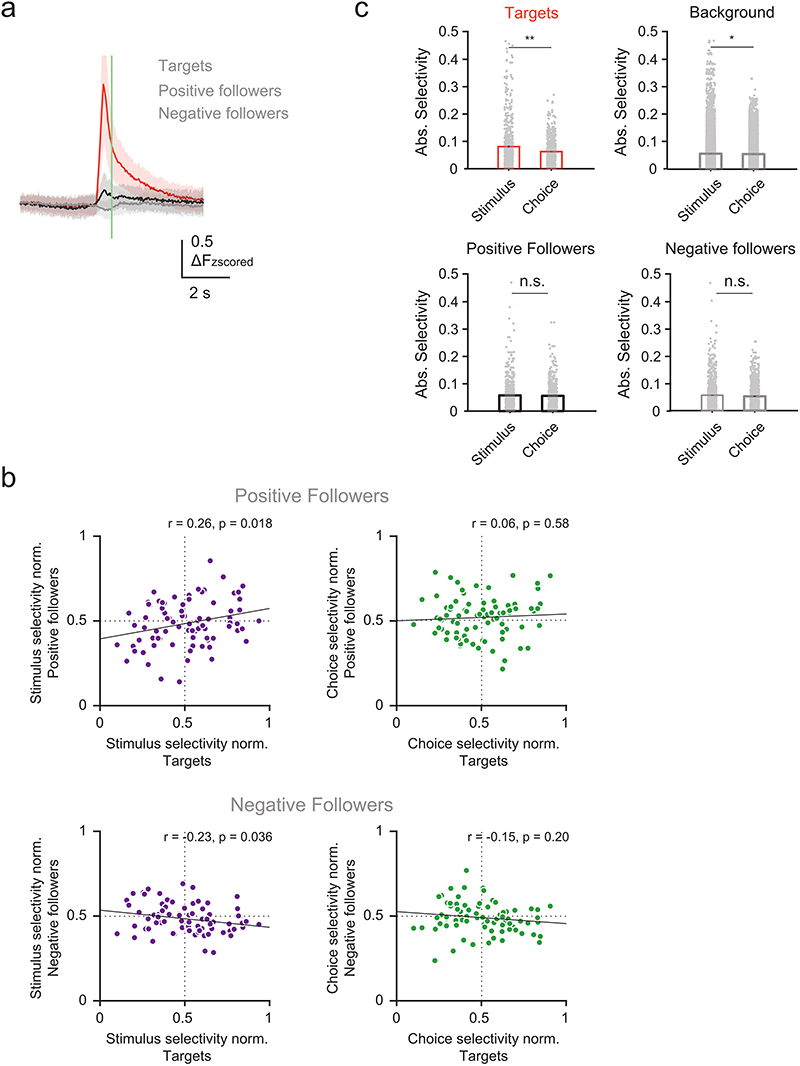
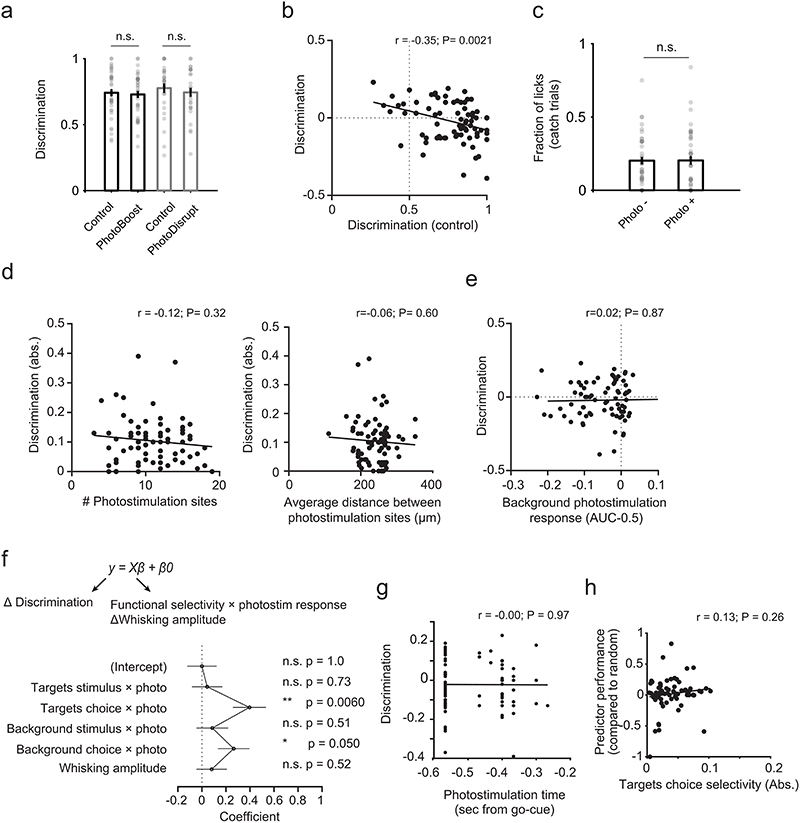
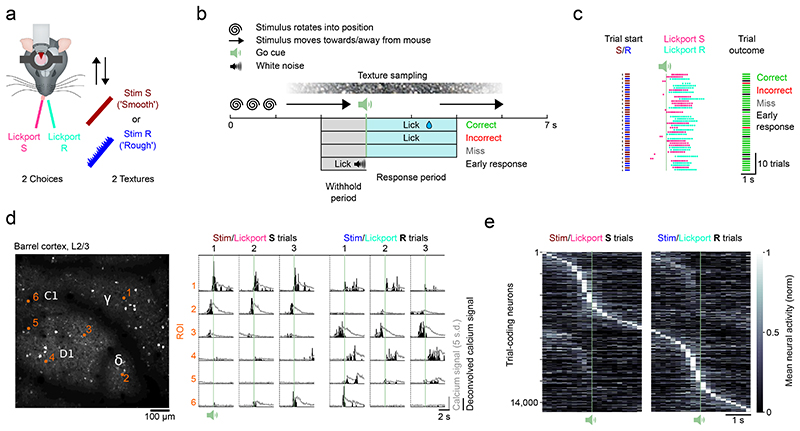
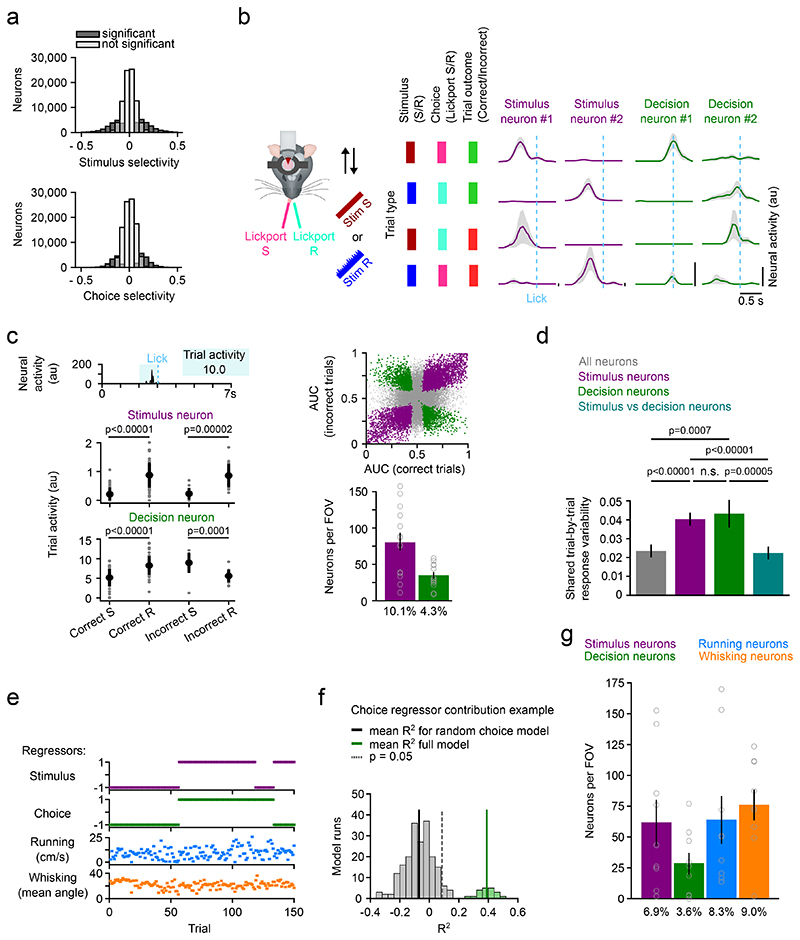
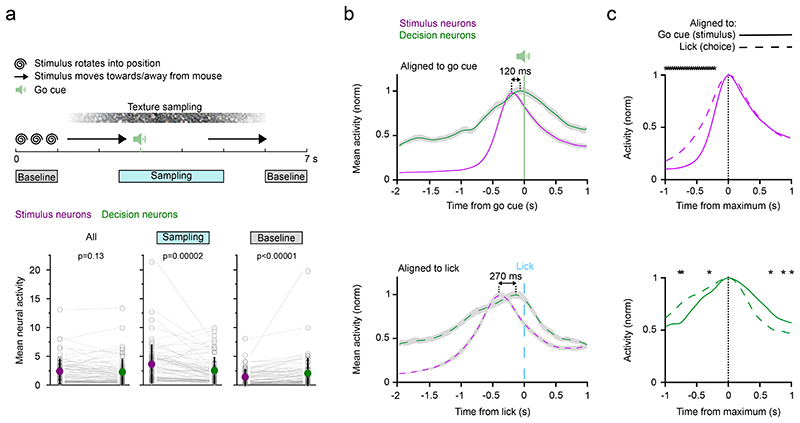
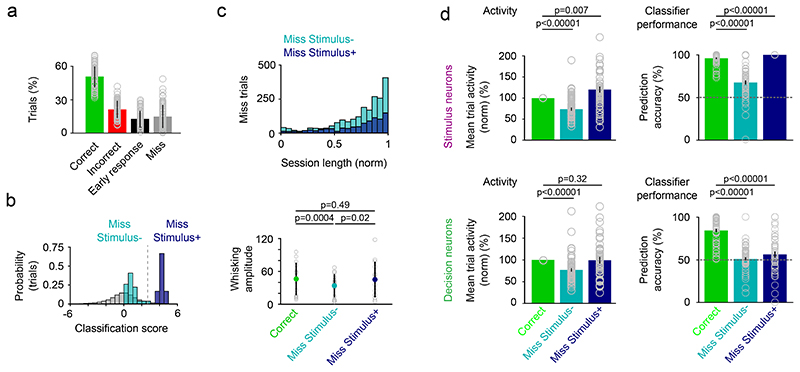
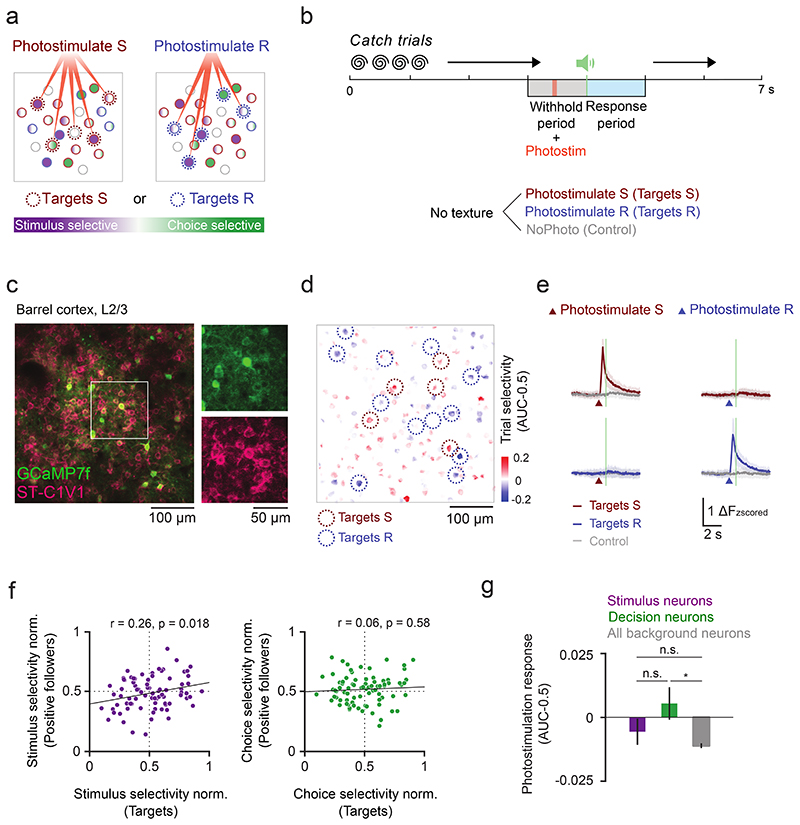
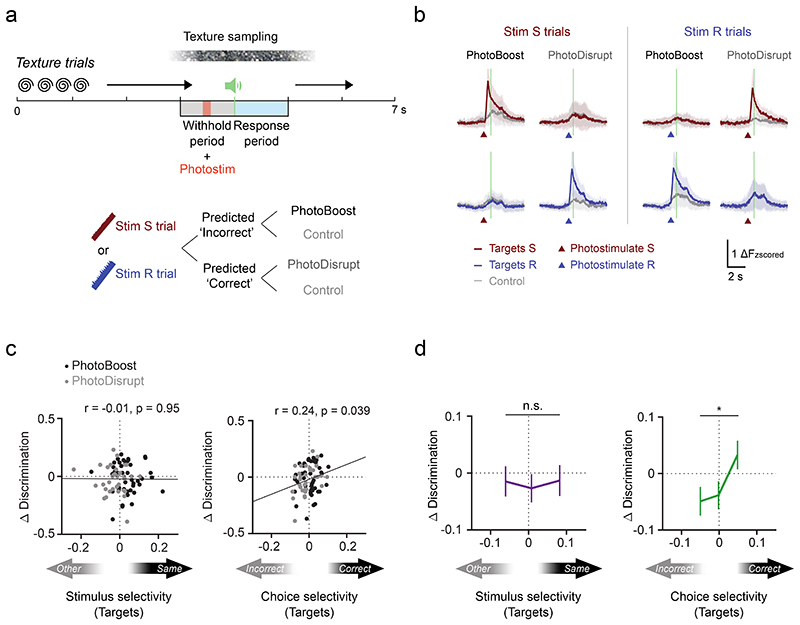
Primary sensory cortex is thought to process incoming sensory information, while decision variables important for driving behavior are assumed to arise downstream in the processing hierarchy. Here, we used population two-photon calcium imaging and targeted two-photon optogenetic stimulation of neurons in layer 2/3 of mouse primary somatosensory cortex (S1) during a texture discrimination task to test for the presence of decision signals and probe their behavioral relevance. Small but distinct populations of neurons carried information about the stimulus irrespective of the behavioral outcome (stimulus neurons), or about the choice irrespective of the presented stimulus (decision neurons). Decision neurons show categorical coding that develops during learning, and lack a conclusive decision signal in Miss trials. All-optical photostimulation of decision neurons during behavior improves behavioral performance, establishing a causal role in driving behavior. The fact that stimulus and decision neurons are intermingled challenges the idea of S1 as a purely sensory area, and causal perturbation suggests a direct involvement of S1 decision neurons in the decision-making process.


Conflict of interest statement

Competing Interests Statement

The authors declare no competing interests.

Figures

Extended Data Fig. 1
Extended Data Fig. 2
Extended Data Fig. 3
Extended Data Fig. 4
Extended Data Fig. 5
Extended Data Fig. 6
Extended Data Fig. 7
Extended Data Fig. 8
Extended Data Fig. 9
Extended Data Fig. 10
Figure 1
Figure 1. Imaging task-dependent activity in L2/3 barrel cortex during a two-choice texture discrimination task
a) Experimental set-up of the two-choice texture discrimination task with simultaneous two-photon imaging. Stim S = Smooth sandpaper, Stim R = Rough sandpaper. b) Trial structure and trial outcomes. c) Behavioral data from 44 consecutive trials of a single session with two textures. d) Left, Imaging field of view (depth = 140 μm) with located barrel centers (C1, D1, γ, δ) and selected neurons (orange numbers). Repeated for all mice (n = 13). Right, fluorescence (grey) and deconvolved fluorescence (black) traces from selected neurons. Traces are aligned to the trial start. Fluorescence traces have been corrected for neuropil contamination, baselined and z-scored. e) Normalized mean activity of all trial-coding neurons, i.e. neurons that distinguish between correct Stim/Lickport S and correct Stim/Lickport R trials. Neurons sorted by trial type preference and time of maximum activity. Single-plane recordings (30 Hz sampling rate) have been binned to match multi-plane recordings (5 Hz sampling rate).
Figure 2
Figure 2. Stimulus and decision coding in L2/3 barrel cortex neurons
a) Stimulus and choice selectivity for all neurons. Two conditions for each neuron (Stimulus selectivity: Correct and Incorrect trials; Choice selectivity: Stim S and Stim R trials). Neurons with significant selectivity in a condition are labelled in dark grey. b) Trial-averaged activity of four example neurons recorded during the two-choice two-texture task. Activity split by trial type. Activity was aligned to the lick of the mouse. Mean ± s.e.m. Neural activity is neuropil-corrected and deconvolved calcium signals. c) Top left, Trial activity is calculated by averaging neural activity 1 s before the lick. Bottom left, Trial activity of an example stimulus and an example decision neuron across trial types. Top right, ROC AUC values for all neurons. Neurons with significant stimulus coding in purple and neurons with significant decision coding in green. Bottom right, Number and percentage of stimulus and decision coding neurons per FOV (693 × 693 μm). N = 14 FOVs (13 mice), mean ± s.e.m.. Grey open circles denote individual FOVs. d) Pairwise correlation of the response to repeated presentations of identical stimuli for all neurons, stimulus neurons, decision neurons, and between stimulus and decision neuron pairs. N = 63 FOVs, two-sided Wilcoxon signed-rank test, mean ± s.e.m.. e) The four regressors, sorted by stimulus and choice across trials, used to train the gaussian GLM: Stimulus, choice, running, and whisking. f) Identification of variance uniquely explained by each of the regressors using semi-partial regression. The mean variance explained for each neuron using all regressors is compared to the performance of a model with one randomized regressor. In this example the choice regressor was randomized 400x to generate a distribution of random choice regressor models. Neurons whose activity is predicted better with the regressor of interest (p < 0.05, one-sided t-test) are considered to encode information about the regressor of interest. g) Number and percentage of neurons identified to contain information on each of the four regressors per FOV. Grey open circles denote indiviual mice. N = 9 mice, mean ± s.e.m.
Figure 3
Figure 3. Subset-specific activity patterns and timing in stimulus and decision neurons
a) Top, Trial structure to indicate “Baseline” and “Sampling” periods. Bottom, mean neural activity of stimulus and decision neurons throughout the trial and during the Sampling and Baseline period. Neural activity is neuropil-corrected and deconvolved calcium signals. N = 63 sessions, mean ± s.e.m., , two-sided Wilcoxon signed-rank test. Grey open circles denote indiviual sessions. b) Activity of stimulus and decision neurons averaged across sessions and aligned to the go cue/stimulus onset (top) or the lick/choice of the mouse (bottom). The go cue serves as a proxy for the stimulus onset which is perfectly correlated with the go cue but with a small jitter due to trial-specific whisker movements. Line and shaded area represent mean ± s.e.m.. c) The same activity traces but sorted by neuron type and aligned to the peak. Top, the sharp activity onset in stimulus neurons aligned to the stimulus differs from the rise in activity when aligned to the lick. Bottom, Decision neuron activity falls off faster when activity is aligned to the lick in comparison to activity aligned to the stimulus. But activity rises more sharply when aligned to the go cue in comparison to activity aligned to the lick. Bin-wise comparison, n = 35 sessions, stars indicate bins with p < 8.2 × 10⁻⁴ (Bonferroni corrected significance level), two-sided Wilcoxon signed-rank test.
Figure 4
Figure 4. Categorical coding in decision neurons develops with learning
a) Activity of decision neurons across trial types in 6 example neurons - 3 example neurons on the first day of four-texture training and 3 example neurons in expert mice. Mean activity sorted by trial type. Line and shaded area represent mean ± s.e.m.. b) Change in behavioral performance (n = 1 mouse) and coding of decision neurons (n = 5/6/43/16 decision neurons in first, 2 intermediate and expert session, mean ± s.e.m..) during learning in an example mouse. c) Change in behavioral performance and coding of decision neurons in all mice that improved in performance during learning (colors indicate different mice). The first session with four textures (‘First’) is compared to the session with the best performance (‘Expert’). N = 4 mice, two-sided Wilcoxon signed-rank test. The coding parameters are the strictly standardized mean difference (μ1-μ2 / √(s.d.12+ s.d.22)) for Stim S and Stim S2 vs Stim R and Stim R2 (Categorical coding), Stim S vs Stim S2 and Stim R vs Stim R2 (Discrimination), and Stim S and Stim R vs Stim S2 and Stim R2 (New stimulus coding). Behavioral discrimination = Number of Correct trials / (Number of Correct + Incorrect trials) for S2 and R2. d) Trial-averaged activity for four example neurons recorded during the four-texture discrimination task. Activity split by trial types. Activity was aligned to the lick of the mouse. Mean ± s.e.m.. e) Discrimination of textures associated to the same lickport in decision neurons and stimulus neurons. 21 FOVs, mean ± s.d., two-sided Wilcoxon ranksum test.
Figure 5
Figure 5. Miss trials lack a conclusive decision signal
a) Percentage of miss trials across all sessions (n = 66 sessions, 13 mice, see Figure 1 & 2, mean ± s.d.). Grey open circles denote indiviual sessions. b) Example session to show classification of miss trials into Miss Stimulus- (Linear classifier trained with stimulus neuron activity predicts stimulus type at chance level) and Miss Stimulus+ trials (Linear classifier trained with stimulus neuron activity predicts stimulus). Dotted line represents z-score = 1.64. Grey distribution are classification scores achieved by a linear classifier trained with shuffled trial labels (500x). c) Top, Distribution of Miss Stimulus+ and Miss Stimulus- trials across the normalized session length (n = 66 sessions). Miss Stimulus- trials without stimulus information ramp up towards the end of the session. Bottom, whisking before the go cue in Correct, Miss Stimulus- and Miss Stimulus+ trials in a subset of sessions with whisker kinematics. n = 14 sessions, mean ± s.d., two-sided Wilcoxon signed-rank test. d) Left, mean trial activity in stimulus neurons (top) and decision neurons (bottom) in Miss Stimulus- and Miss Stimulus+ trials relative to activity in Correct trials. Mean ± s.e.m., n = 51 sessions. Two-sided Wilcoxon signed-rank test. Right, Prediction accuracy of a classifier trained to predict stimulus type with stimulus neuron activity (top) or decision neuron activity (bottom) in Correct trials. Decision neurons carry no trial information in Miss Stimulus- and Miss Stimulus+ trials and the classifiers perform at chance level in Miss trials. Mean ± s.e.m., n = 57 sessions. Grey open circles denote indiviual sessions. Testing against chance: n = 57 sessions, Stimulus neurons: Miss Stimulus- trials vs chance, p = 1.1 × 10⁻⁸; Miss Stimulus+ trials vs chance, p = 2.3 × 10⁻¹⁰. Decision neurons: Miss Stimulus- trials vs chance, p = 0.37; Miss Stimulus+ trials vs chance, p = 0.08. Two-sided Wilcoxon signed-rank test.
Figure 6
Figure 6. Cell-type specific functional connectivity in stimulus and decision coding
a) Schematic of targeted photostimulation experiment. A subset of trial-coding neurons preferring correct Stim S/Lickport S trials or correct Stim R/Lickport R trials was selectively activated by two-photon optogenetic photostimulation. b) Task structure for catch trial experiments. Two-photon photostimulation (9 × 10 ms spirals) of either target ensemble was enabled in a subset of trials in the middle of the withhold period. c) An example FOV (depth = 200 μm) with neurons co-expressing calcium indicator (GCaMP7f) and soma-targeted opsin (ST-C1V1). Representative results of 31/60 surgeries. d) Trial selectivity of neurons in the FOV in c). Red and blue circles mark the two trial selective target ensembles. e) Calcium time courses of the two target ensembles during different trial types (mean ± s.d.). N = 80 target ensembles, 40 sessions, 7 mice. f) Left: The stimulus selectivity of the target ensemble is positively correlated with the stimulus selectivity of indirectly photo-activated neurons (positive followers). Right: There is no significant correlation between the choice selectivity of the followers and that of the targets (r and p are the Pearson correlation coefficient and the p-value, respectively). Selectivity was normalized to all other background cells in the same FOV. g) Photostimulation response of stimulus and decision neurons (excluding targets) compared with all background cells (boxes are mean, whiskers are s.e.m.). N = 363 stimulus, 248 decision and 10458 background neurons, 40 sessions, 7 mice. Kruskal-Wallis one-way ANOVA test with Tukey-Kramer critical values were used for multiple comparisons, n.s. stimulus vs. decision neurons p = 0.53; n.s. stimulus vs background neurons; p = 0.27; *p stimulus vs background neurons p = 0.022.
Figure 7
Figure 7. Activation of neurons with correct choice selectivity improves behavioral performance
a) Task structure for texture trial experiments. Two-photon photostimulation (9 × 10 ms spirals) of either target ensemble was enabled in a subset of trials in the middle of the withhold period. Before the photostimulation, activity of trial-coding neurons was readout online to generate a prediction on the trial outcome (Predicted Correct or Predicted Incorrect). Trials predicted Incorrect either received PhotoBoost or Control photostimulation. Trials predicted Correct received either PhotoDisrupt or Control photostimulation (see Methods). b) Calcium time courses of the two target ensembles during different trial types (mean ± s.d.). N = 67 target ensembles, 37 sessions, 7 mice. c) Photostimulation-induced change in task performance is positively correlated with the choice selectivity but not the stimulus selectivity of directly activated targets. N = 77 photostimulation conditions, 37 sessions, 7 mice. Discrimination = Correct trials / (Correct + Incorrect trials). R and p are the Pearson correlation coefficient and the p-value, respectively. d) Same data as in (c) but binned into three groups by ascending selectivity with equal number of samples per bin. Data are presented as mean ± s.e.m., Wilcoxon rank-sum test, *p = 0.038.

Similar articles

Cited by

References

    1. Hubel DH, Wiesel TN. Receptive fields, binocular interaction and functional architecture in the cat’s visual cortex. Journal of Physiology. 1962;160:106–154. - PMC - PubMed
    1. Hernandez A, Zainos A, Romo R. Neuronal correlates of sensory discrimination in the somatosensory cortex. PNAS. 2000;97:6191–6196. - PMC - PubMed
    1. Arabzadeh E, Zorzin E, Diamond ME. Neuronal encoding of texture in the whisker sensory pathway. PLoS Biol. 2005;3:e17. doi: 10.1371/journal.pbio.0030017. - DOI - PMC - PubMed
    1. Romo R, de Lafuente V. Conversion of sensory signals into perceptual decisions. Prog Neurobiol. 2013;103:41–75. doi: 10.1016/j.pneurobio.2012.03.007. - DOI - PubMed
    1. Brody CD, Hanks TD. Neural underpinnings of the evidence accumulator. Curr Opin Neurobiol. 2016;37:149–157. doi: 10.1016/j.conb.2016.01.003. - DOI - PMC - PubMed

Publication types