. 2022 Sep;25(9):1213-1224.
doi: 10.1038/s41593-022-01148-9. Epub 2022 Aug 30.

A molecularly integrated amygdalo-fronto-striatal network coordinates flexible learning and memory

Affiliations

A molecularly integrated amygdalo-fronto-striatal network coordinates flexible learning and memory

Dan C Li et al. Nat Neurosci. 2022 Sep.

Abstract

Behavioral flexibility-that is, the ability to deviate from established behavioral sequences-is critical for navigating dynamic environments and requires the durable encoding and retrieval of new memories to guide future choice. The orbitofrontal cortex (OFC) supports outcome-guided behaviors. However, the coordinated neural circuitry and cellular mechanisms by which OFC connections sustain flexible learning and memory remain elusive. Here we demonstrate in mice that basolateral amygdala (BLA)→OFC projections bidirectionally control memory formation when familiar behaviors are unexpectedly not rewarded, whereas OFC→dorsomedial striatum (DMS) projections facilitate memory retrieval. OFC neuronal ensembles store a memory trace for newly learned information, which appears to be facilitated by circuit-specific dendritic spine plasticity and neurotrophin signaling within defined BLA-OFC-DMS connections and obstructed by cocaine. Thus, we describe the directional transmission of information within an integrated amygdalo-fronto-striatal circuit across time, whereby novel memories are encoded by BLA→OFC inputs, represented within OFC ensembles and retrieved via OFC→DMS outputs during future choice.


Figures

Extended Data Fig. 1 ∣
Extended Data Fig. 1 ∣. Mice do not display preference for one nose-poke aperture during training.
Response side bias (responses on aperture to be non-reinforced / total responses) during training sessions. (a) BLA→OFC inactivation: memory encoding (session: F14,378 = 1.22, 0.256; session × CNO: F28,378 < 1), (b) delayed memory encoding (session: F10,80 = 3.18, p = 0.002; session × CNO: F10,80 < 1), or (c) memory retrieval (session: F8,128 = 4.86, p < 0.001; session × CNO: F8,128 < 1). (d) BLA→OFC stimulation (session: F14,392 < 1; session × cocaine: F14,392 < 1; session × CNO: F14,392 = 1.30, p = 0.205; session × cocaine × CNO: F14,392 < 1). (e) OFC→DMS inactivation (session: F8,144 = 1.05, p = 0.404; session× CNO: F8,144 = 1.21, p = 0.295). (f) OFC→BLA inactivation (session: F8,112 = 1.04, p = 0.205; session × CNO: F8,112 < 1). (g) OFC memory trace inactivation: novel (session: F6,96 = 1.03, p = 0.414; session × 4OHT: F6,96 = 1.73, p = 0.122) or (h) familiar reinforcement conditions (session: F6,108 < 1; session × 4OHT: F6,108 < 1). (i) BDNF-dependent circuit function: BLA-OFC (session: F6,204 = 1.10 p = 0.365; session × lateralization: F12,204 < 1) or (j) OFC-DMS disconnections (session: F6,138 = 1.44, p = 0.204; session × lateralization: F12,138 < 1). Data presented as individual points (semi-transparent) and group means (solid). Correspondence to main figures noted.
Extended Data Fig. 2 ∣
Extended Data Fig. 2 ∣. Nose-poking and lever-pressing actions are instrumental in nature.
(a,e) Behavioral procedure used to assess sensitivity to instrumental omission for nose-poking or lever-pressing. (b, c) Nose-poke responses across training (F6,42 = 10.1, p < 0.001) and during omission session (F5,35 = 16.9, p < 0.001). (d) Raster plot of nose-poking responses for each animal throughout the omission session. (f, g) Lever-pressing across training (F3,21 = 29.1, p < 0.001) and during omission session (F5,35 = 35.0, p < 0.001). (h) Raster plot of lever-pressing responses for each animal throughout the omission session. Data presented as individual points (semi-transparent) and group means (solid). Repeating measures ANOVA was applied, 2-sided, with no adjustment for multiple comparisons required.
Extended Data Fig. 3 ∣
Extended Data Fig. 3 ∣. Inactivation of posterolateral OFC does not disrupt flexible memory encoding.
(a) Left. Chemogenetic receptor expression in the anterior ventrolateral OFC from experiments described in Figs.1-3 of main text. Right. Extent of inhibitory chemogenetic receptor expression in the posterolateral OFC. Anterior-posterior (A-P) distance from bregma noted. (b) Timing of CNO administration for posterolateral OFC inactivation during memory encoding. (c) Responses across training (session: F6,84 = 73.9, p< 0.001; session × virus: F6,84 < 1). (d, e) Responses during first (reinforcement: F1,14 = 8.49, p = 0.011; reinforcement × virus: F1,14 = 1.59, p = 0.228) and second choice tests (reinforcement: F1,14 = 26.9, p < 0.001; reinforcement × virus: F1,14 < 1). Choice tests were performed on sequential days. Data presented as individual points or mean ± S.E.M. *p < 0.05 (main effect). n = 8 GFP, 8 hM4Di mice. Correspondence to main figures noted. Analyses were performed by ANOVA (2-sided) with repeating measures when appropriate; no adjustments for multiple comparisons required.
Extended Data Fig. 4 ∣
Extended Data Fig. 4 ∣. Responding during non-reinforced sessions did not differ between groups prior to choice tests.
All non-reinforced sessions were performed drug- and manipulation-free. (a) BLA→OFC inactivation (memory encoding): test 1 (time: F4,108 = 16.5, p < 0.001; time × CNO: F8,108 < 1), test 2 (time: F4,108 = 17.9, p < 0.001; time × CNO: F8,108 < 1), or test 3 (time: F4,108 = 16.2, p < 0.001; time × CNO: F8,108 < 1). (b) BLA→OFC inactivation (delayed memory encoding): test 1 (time: F4,56 = 29.9, p < 0.001; time × CNO: F4,56 < 1) or test 2 (time: F4,56 = 35.2, p < 0.001; time × CNO: F4,56 = 1.63, p = 0.179). (c) BLA→OFC inactivation (memory retrieval): test 1 (time: F4,64 = 12.2, p < 0.001; time × CNO: F4,64 < 1) or test 2 (time: F4,64 = 7.17, p < 0.001; time × CNO: F4,64 < 1). (d) BLA→OFC stimulation: test 1 (time: F4,112 = 16.3, p < 0.001; time × cocaine: F4,112 < 1; time × CNO: F4,112 = 1.18, p = 0.324; time × cocaine × CNO: F4,112 < 1), test 2 (time: F4,112 = 47.0, p < 0.001; time × cocaine: F4,112 = 2.61, p = 0.056; time × CNO: F4,112 = 2.19, p = 0.075; time × cocaine × CNO: F4,112 < 1), or test 3 (time: F4,112 = 55.2, p < 0.001; time × cocaine: F4,112 = 1.27, p = 0.284; time × CNO: F4,112 < 1; time × cocaine × CNO: F4,112 = 1.74, p = 0.147). (e) OFC→DMS inactivation: test 1 (time: F4,72 = 8.30, p < 0.001; time × CNO: F4, 72 < 1) or test 2 (time: F4,72 = 40.5, p < 0.001; time × CNO: F4,72 < 1). (f) OFC→BLA inactivation: test 1 (time: F4,56 = 20.8, p < 0.001; time × CNO: F4,56 < 1) or test 2 (time: F4,56 = 27.1, p < 0.001; time × CNO: F4,56 = 1.62, p = 0.183). (g-h) OFC memory trace inactivation: novel (time: F4,84 = 26.1, p < 0.001; time × 4OHT: F4,84 < 1) or familiar reinforcement conditions (time: F4,72 = 19.3, p < 0.001; time × 4OHT: F4,72 < 1). (i-j) BDNF-dependent circuit function: BLA-OFC (time: F4,136 = 61.6, p < 0.001; time × lateralization: F8,136 < 1) or OFC-DMS disconnections (time: F4,92 = 31.7, p < 0.001; time × lateralization: F8,92 < 1). Data presented as mean ± S.E.M. Correspondence to main figures noted.
Extended Data Fig. 5 ∣
Extended Data Fig. 5 ∣. Extended interval training prompts inflexible choice behavior.
(a) Responses across training (F14,196 = 16.9, p < 0.001). (b) Choice test responses (t14 < 1). Data presented as individual points or mean ± S.E.M. n = 15 mice. Analyses were performed by ANOVA with repeating measures, and paired t-test (2-sided).
Extended Data Fig. 6 ∣
Extended Data Fig. 6 ∣. Correlations between choice behavior and relative experience frequency of reinforced vs. non-reinforced nose pokes.
Correlation between individual choice test preference ratios (reinforced / non-reinforced) and the standard contingency measure (ΔP; see Methods) for each 25-minute non-reinforced session. (a) BLA→OFC inactivation: memory encoding (FR1: F1,28 < 1; RI30: F1,28 < 1; RI60: F1,28 = 2.40, p = 0.132), (b) delayed memory encoding (all F1,14 < 1), or (c) memory retrieval (all F1,16 < 1). (d) BLA→OFC stimulation (all F1,30 < 1). (e) OFC→DMS inactivation (all F1,18 < 1). (f) OFC→BLA inactivation (all F1,14 < 1). (g) Correlation coefficients (Pearson’s r) between session ΔP and choice test preference ratios for all experiments in panels a-f (in order). Data presented as individual points or group means. 95% confidence interval (grey shading). Correspondence to main figures noted.
Extended Data Fig. 7 ∣
Extended Data Fig. 7 ∣. Chemogenetic inactivation of OFC→DMS projections disrupts memory retrieval independent of repeated testing.
(a) Combinatorial viral targeting of OFC→DMS projections. (b) Timing of CNO administration for OFC→DMS projection inactivation during memory retrieval. (c) Responses across training (session: F6,48 = 33.3, p < 0.001; session × CNO: F6,48 < 1). (d) Choice test responses (reinforcement: F1,14 = 15.2, p = 0.002; reinforcement × CNO: F1,14 = 6.74, p = 0.021). Data resented as mean ± S.E.M. *p < 0.05 (post-hoc). n = 8 veh, 8 CNO mice. Experiments were replicated at least once, with concordant results.
Extended Data Fig. 8 ∣
Extended Data Fig. 8 ∣. Size of chemogenetically inactivated OFC neuronal ensembles does not predict choice behavior.
(a, b) Correlation between number of chemogenetically inactivated OFC neurons and choice test preference ratios (reinforced / non-reinforced) for OFC ensembles labelled following exposure to novel (F1,10 < 1) or familiar reinforcement conditions (F1,8 < 1). Data presented as individual points. 95% confidence interval (shading). Centre lines indicate regression.
Extended Data Fig. 9 ∣
Extended Data Fig. 9 ∣. Additional dendritic spine parameters among BLA→OFC→DMS relay neurons.
(a) Location of all sampled dendrites from trained (T; filled circles) and yoked (∅; open circles) mice by anterior-posterior (A-P) distance from bregma. (b, c) Dendritic spine density across A-P extent of the ventrolateral OFC for yoked (F1,70 < 1) and trained mice (F1,70 < 1). Centre lines indicate regression. (d–f) Left panels. Dendrite diameter (cocaine: F1,20 < 1; training: F1,20 < 1; cocaine × training: F1,20 < 1), dendritic spine length (cocaine: F1,20 = 3.80, p = 0.053; training: F1,20 = 1.47, p = 0.227; cocaine × training: F1,20 < 1) and dendritic spine diameter (cocaine: F1,20 < 1; training: F1,20 < 1; cocaine × training: F1,20 < 1). Right panels. Percent change (trained mouse vs. yoked cage mate) in dendrite diameter (t10 < 1), dendritic spine length (t10 < 1), and dendritic spine diameter (t10 < 1). Data presented as individual points (solid = per animal; transparent=per dendrite). #p = 0.053 (main effect). n = 6 sal ∅, 6 coc ∅, 6 sal T, 6 coc T mice.
Extended Data Fig. 10 ∣
Extended Data Fig. 10 ∣. Correlations between BLA→OFC→DMS circuit-defined dendritic spine plasticity and choice behavior.
Correlation between individual choice test preference ratios (reinforced / non-reinforced) and dendritic spine parameters from Fig.6. (a–d) Dendritic spine density for all spines (F1,10 = 5.12, p = 0.047), and by mushroom- (F1,10 = 5.71, p = 0.038), thin- (F1,10 = 1.14, p = 0.311), and stubby-type spines (F1,10 < 1). (e–h) Percent change (trained mouse vs. yoked [∅] cage mate) in dendritic spine density for all spines (F1,10 = 1.43, p = 0.259), and by mushroom- (F1,10 < 1), thin- (F1,10 = 8.79, p = 0.014), and stubby-type spines (F1,10 = 1.10, p = 0.319). (i-j) Mushroom-to-thin spine-type ratio (F1,10 = 4.88, p = 0.052). Percent change (F1,10 = 4.03, p = 0.073). (k, l) Head volume of mushroom-type spines (F1,10 < 1). Percent change (F1,10 = 8.82, p = 0.014). Data presented as individual points. 95% confidence interval (grey shading). *p < 0.05. p = 0.052. #p = 0.073. Panels g and l reproduced in Fig.6. Centre lines indicate regression.
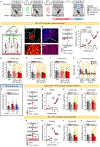
Fig. 1 ∣
Fig. 1 ∣. BLA→OFC projections are necessary for encoding, but not retrieving, new action memories for sustained response flexibility.
a, Mice were trained to generate two food-reinforced nose-poke responses (training/reinforced), and then the food associated with one response was delivered independent of nose-poking (non-reinforced), triggering new memory encoding necessary for adaptive choice the next day (choice test). b, Combinatorial viral targeting of BLA→OFC projections. c,d, Retrogradely transported eGFP-Cre driving hM4Di-mCherry expression in the BLA (c) with axon terminals detectable in the ventrolateral OFC (d). Scale bar, 25 μm. e, Timing of CNO administration for BLA→OFC projection inactivation during memory encoding. f, Responses across training (session: F14,378 = 123; P<0.001; session × CNO: F28,378 <1). gi, Choice test responses after ratio (choice test 1 (g); reinforcement: F1,27 = 31.2; P < 0.001; reinforcement × CNO: F2,27 = 4.07; P = 0.029), moderate interval training (choice test 2 (h); reinforcement: F1,27 = 18.2; P < 0.001; reinforcement × CNO: P2,27 = 4.40; P = 0.022) or extended interval training (choice test 3 (i); reinforcement: F1,27 = 3.54; P = 0.071; reinforcement × CNO: F2,27< 1). j, Choice test response preference ratios (training schedule: F2,54 = 8.43; P = 0.001, training schedule × CNO: F4,54 = 3.73; P = 0.009). k, CNO (1.0 mg kg−1) and clozapine (0.1 mg kg−1) administration during memory-encoding absent chemogenetic receptor expression (reinforcement: F1,35 = 32.3, P < 0.001; reinforcement × drug: F2,35 = 1.33, P = 0.278). l, Timing of CNO administration for BLA→OFC projection inactivation 6 hours after non-reinforced session. m, Responses across training (session: F10,80 = 51.9, P < 0.001; session × CNO: F10,80 < 1). n,o, Choice test responses after ratio (choice test 1 (n); reinforcement: F1,14 = 16.9, P = 0.001; reinforcement × CNO: F1,14 < 1) or moderate interval training (choice test 2 (o); reinforcement: F1,14 = 5.26, P = 0.038; reinforcement × CNO: F1,14 < 1). p, Timing of CNO administration for BLA→OFC projection inactivation during memory retrieval. q, Responses across training (session: F8,128 = 71.5, P < 0.001; session × CNO: F8,128 < 1). r,s, Choice test responses after ratio (choice test 1 (r); reinforcement: F1,16 = 34.5; P < 0.001; reinforcement × CNO: F1,16 = 1.44; P = 0.247) or moderate interval training (choice test 2 (s); reinforcement: F1,16 = 129; P < 0.001; reinforcement × CNO: F1,16 = 2.01; P = 0.176). Data are presented as individual points or mean ± s.e.m. *P < 0.05 (main effect or post hoc). P < 0.05 (one-sample test versus 1). Experiments were replicated at least once, with concordant results. See Supplementary Table 1 for complete statistics.
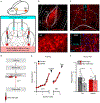
Fig. 2 ∣
Fig. 2 ∣. Selective inactivation of BLA→OFC axon terminals is sufficient to disrupt flexible memory encoding.
a, Intracranial targeting of BLA→OFC axon terminals. b,c, Cannula placement within the OFC (c) targeting axon terminals from hM4Di-mCherry-expressing BLA projection neurons (b). Scale bar, 25 μm. d, Timing of intracranial CNO infusions for BLA→OFC projection inactivation during memory encoding. e, Responses across training (session: F9,63 = 18.7, P < 0.001; session × virus: F9,63 < 1). f, Choice test responses (reinforcement: F1,17 = 7.30, P = 0.015; reinforcement × virus: F1,17 = 4.72, P = 0.034). Data are presented as individual points or mean ± s.e.m., with groups compared by two-factor ANOVA with repeating measures. *P < 0.05 (post hoc). n = 9 control and 10 hM4Di mice. Experiments were replicated at least once, with concordant results.
Fig. 3 ∣
Fig. 3 ∣. Stimulating BLA→OFC projections reinstates flexible action memory encoding after cocaine.
a, Combinatorial viral targeting of BLA→OFC projections. b,c, Retrogradely transported eGFP-Cre driving hM4Di-mCherry expression in the BLA (b) with axon terminals detectable in the ventrolateral OFC (c). Scale bar, 25 μm. d, Cocaine administration before behavioral testing and timing of CNO administration for BLA→OFC projection stimulation during memory encoding. e, Responses across training (session: F14,392 = 17.23; P < 0.001; session × cocaine × CNO: F14,392 < 1). fh, Choice test responses after ratio (choice test 1 (f); reinforcement: F1,28 = 31.3; P < 0.001; reinforcement × cocaine × CNO: F1,28 = 15.0; P < 0.001), moderate interval training (choice test 2 (g); reinforcement: F1,28 = 45.3; P <0.001; reinforcement × cocaine × CNO: F1,28 = 10.0; P = 0.004) or extended interval training (choice test 3 (h); reinforcement: F1,28 = 3.83; P = 0.061; reinforcement × cocaine × CNO: F1,28 < 1). i, Choice test response preference ratios (training schedule: F2,56 = 5.28; P = 0.008, training schedule × cocaine × CNO: F2,56 = 6.39; P = 0.003). Data are presented as individual points or mean ± s.e.m. *P < 0.05 (main effect or post hoc). P < 0.05 (one-sample test versus 1). Experiments were replicated at least once, with concordant results. See Supplementary Table 2 for complete statistics.
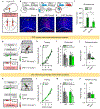
Fig. 4 ∣
Fig. 4 ∣. OFC→DMS, but not OFC→BLA, projections are necessary for the encoding and retrieval of new action memories for sustained response flexibility.
a, Combinatorial viral targeting of OFC→DMS or OFC→BLA projections. bd, Retrogradely transported eGFP-Cre driving hM4Di-mCherry expression in the ventrolateral OFC (b) with axon terminals detectable in the DMS (c) or BLA (d). Scale bar, 25 μm. e, Timing of CNO administration for OFC→DMS or OFC→BLA projection inactivation during memory encoding or retrieval. f, Responses across training (session: F8,144 = 29.2; P < 0.001; session × CNO: F8,144 < 1). g,h, Choice test responses for memory-encoding (g) (reinforcement: F1,18 = 6.92; P = 0.017; reinforcement × CNO F1,18 = 4.79; P = 0.042) and retrieval-targeted (h) OFC→DMS projection inactivation (reinforcement: F1,18 = 13.9; P = 0.002; reinforcement × CNO F1,18 = 5.17; P = 0.036). i, Responses across training (session: F8,112 = 37.5; P < 0.001; session × CNO: F8,112<1). j,k, Choice test responses for encoding-targeted (j) (reinforcement: F1,14 = 17.0; P < 0.001; reinforcement × CNO F1,148 < 1) or retrieval-targeted (k) OFC→BLA projection inactivation (reinforcement: F1,14 = 18.3; P = 0.001; reinforcement × CNO F1,14 < 1). Data are presented as individual points or mean ± s.e.m. *P < 0.05 (main effect or post hoc). Experiments were replicated at least once, with concordant results. See Supplementary Table 3 for complete statistics.
Fig. 5 ∣
Fig. 5 ∣. Encoding-activated neuronal ensembles in the OFC form a memory trace for later response flexibility.
a,b, Induction of hM4Di-mCherry expression among virally targeted OFC neurons (a). Activity-dependent Fos promotor and enhancer elements drive expression of Cre-ER, which is only trafficked to the nucleus to catalyze recombination after 4OHT binding (b). cf, Quantification of activity-dependent (c) and 4OHT-dependent hM4Di-mCherry expression in the ventrolateral OFC after exposure to novel (d) or familiar (e) reinforcement conditions (novelty: F1,39 = 34.3, P < 0.001; 4OHT: F1,39 = 393, P < 0.001; novelty × 4OHT: F1,39 = 37.7, P < 0.001) (f). g, Timing of 4OHT and CNO administration for inactivation of novelty-responsive OFC neurons during choice test. h, Responses across training (session: F6.96 = 50.3, P < 0.001; session × 4OHT: F6,96 = 1.04, P = 0.406). i, Choice test responses (reinforcement: F1,21 = 20.6, P < 0.001; reinforcement × 4OHT: F1,21 = 5.90, P = 0.024). j, Choice test response preference ratios (t21 = 2.81, P = 0.010). k, Timing of 4OHT and CNO administration for inactivation of OFC neurons responsive to familiar reinforcement conditions. l, Responses across training (session: F6.108 = 63.3, P < 0.001; session × 4OHT: F6,108 < 1). m, Choice test responses (reinforcement: F1,18 = 40.2, P < 0.001; reinforcement × 4OHT: F1,18 < 1). n, Choice test response preference ratios (t18 = 1.00, P = 0.330). Data are presented as individual points or mean ± s.e.m. *P < 0.05 (main effect or post hoc). **P < 0.05 (one-sample test versus 1). NS, not significant. Experiments were replicated at least once, with concordant results. See Supplementary Table 4 for complete statistics.
Fig. 6 ∣
Fig. 6 ∣. New action learning triggers dendritic spine plasticity within a di-synaptic BLA→OFC→DMS circuit.
a, Viral-mediated trans-synaptic ARM for labeling ‘relay’ neurons with a BLA→OFC→DMS circuit. b,c, Connectivity-defined ventrolateral OFC neurons (b) identified by ARM for imaging using transgenic Thy1-driven YFP fluorescence (c). Top right: scale bar, 50μm; bottom: scale bar, 10μm. d, Representative three-dimensional dendritic spine reconstructions. Scale bar, 2μm. e, Responses across training for trained (T) mice and their yoked (∅) cage mates (session: F5,100 = 12.6, P < 0.001; session × cocaine × training: F5,100 < 1). f, Choice test responses (reinforcement: F1,20 = 3.33, P = 0.083; reinforcement × cocaine × training: F1,20 = 3.68, P = 0.069). gj, Left panels: dendritic spine density for all spines (g) (cocaine: F1,20 = 9.89, P = 0.005; training: F1,20 = 6.46, P = 0.019; cocaine × training: F1,20 = 1.37, P = 0.255) and stratified by mushroom-type spines (h) (cocaine: F1,20 = 6.11, P = 0.023; training: F1,20 < 1; cocaine × training: F1,20 < 1), thin-type spines (i) (cocaine: F1,20 = 1.01, P = 0.316; training: F1,20 = 20.3, P < 0.001; cocaine × training: F1,20 = 4.23, P = 0.041) or stubby-type spines (j) (cocaine: F1,20 < 1; training: F1,20 < 1; cocaine × training: F1,20 < 1). Right panels: percent change (trained mouse versus yoked cage mate). k,l, Left panels: mushroom-to-thin spine-type ratio (k) (cocaine: F1,20 = 2.89, P = 0.105; training: F1,20 = 7.10, P = 0.015; cocaine × training: F1,20 = 2.40, P = 0.137) and head volume of mushroom-type spines (l) (cocaine: F1,20 < 1; training: F1,20 = 2.78, P = 0.098; cocaine × training: F1,20 = 1.07, P = 0.303). Right panels: percent change. m,n, Correlation between individual choice behavior and percent change in thin-type dendritic spine density (m) (F1,10 = 8.79, P = 0.014) and in head volume of mushroom-type spines (n) (F1,10 = 8.82, P = 0.014). 95% confidence interval (gray shading). Data are presented as individual points (solid, per animal; semi-transparent, per dendrite) or mean ± s.e.m. *P < 0.05 (main effect, post hoc or planned comparison in f). **P = 0.12. ***P < 0.05 (one-sample test versus 0). NS, not significant. Experiments were replicated at least once, with concordant results. See Supplementary Table 5 for complete statistics.
Fig. 7 ∣
Fig. 7 ∣. Circuit-specific neurotrophin tone in the OFC is required for new learning for sustained response flexibility.
a, Multiplexed viral-mediated method for assessing molecular–functional circuit interactions and circuit-specific BDNF function. b, Timing of CNO administration for unilateral BLA inactivation during memory encoding. c, Responses across training (session: F6,204 = 37.1, P <0.001; session × lateralization: F12,204 < 1). d, Choice test responses (reinforcement: F1,34 = 10.3, P = 0.003; reinforcement × lateralization: F2,34 = 3.43, P = 0.044). e, Timing of CNO administration for unilateral DMS inactivation during memory encoding. f, Responses across training (session: F6,138 = 22.2, P < 0.001; session × lateralization: F12,138 < 1). g, Choice test responses (reinforcement: F1,23 = 28.3, P < 0.001; reinforcement × lateralization: F2,23 = 5.46, P = 0.011). Data are presented as individual points or mean ± s.e.m. *P < 0.05 (post hoc). Experiments were replicated at least once, with concordant results. See Supplementary Table 6 for complete statistics.

Similar articles

Cited by

References

    1. Everitt BJ & Robbins TW Drug addiction: updating actions to habits to compulsions ten years on. Annu. Rev. Psychol 67, 23–50 (2016). - PubMed
    1. Izquierdo A. Functional heterogeneity within rat orbitofrontal cortex in reward learning and decision making. J. Neurosci 37, 10529–10540 (2017). - PMC - PubMed
    1. Stalnaker TA, Cooch NK & Schoenbaum G What the orbitofrontal cortex does not do. Nat. Neurosci 18, 620–627 (2015). - PMC - PubMed
    1. Gardner MPH, Conroy JC, Sanchez DC, Zhou J & Schoenbaum G Real-time value integration during economic choice is regulated by orbitofrontal cortex. Curr. Biol 29, 4315–4322 (2019). - PMC - PubMed
    1. Parkes SL et al. Insular and ventrolateral orbitofrontal cortices differentially contribute to goal-directed behavior in rodents. Cereb. Cortex 28, 2313–2325 (2018). - PubMed

Publication types

LinkOut - more resources