. 2022 Sep;25(9):1134-1148.
doi: 10.1038/s41593-022-01140-3. Epub 2022 Aug 30.

Pathological structural conversion of α-synuclein at the mitochondria induces neuronal toxicity

Affiliations

Pathological structural conversion of α-synuclein at the mitochondria induces neuronal toxicity

Minee L Choi et al. Nat Neurosci. 2022 Sep.

Erratum in

  • Author Correction: Pathological structural conversion of α-synuclein at the mitochondria induces neuronal toxicity.
    Choi ML, Chappard A, Singh BP, Maclachlan C, Rodrigues M, Fedotova EI, Berezhnov AV, De S, Peddie CJ, Athauda D, Virdi GS, Zhang W, Evans JR, Wernick AI, Zanjani ZS, Angelova PR, Esteras N, Vinokurov AY, Morris K, Jeacock K, Tosatto L, Little D, Gissen P, Clarke DJ, Kunath T, Collinson L, Klenerman D, Abramov AY, Horrocks MH, Gandhi S. Choi ML, et al. Nat Neurosci. 2022 Nov;25(11):1582. doi: 10.1038/s41593-022-01206-2. Nat Neurosci. 2022. PMID: 36261654 Free PMC article. No abstract available.

Abstract

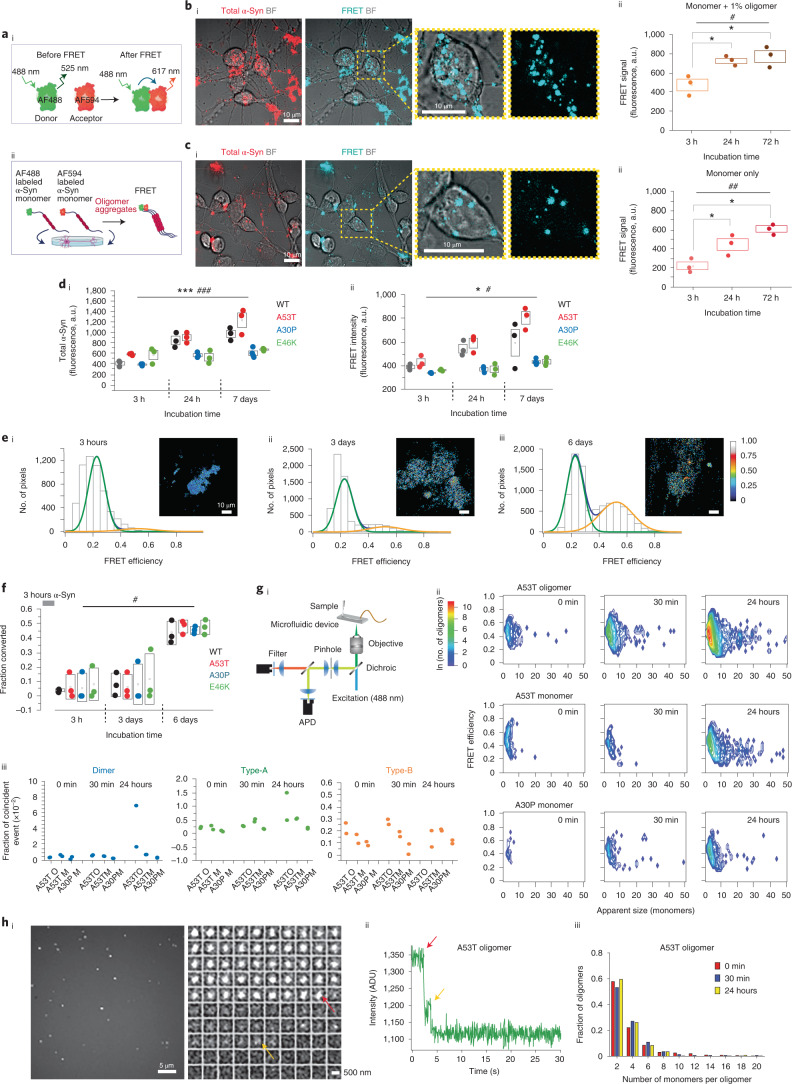
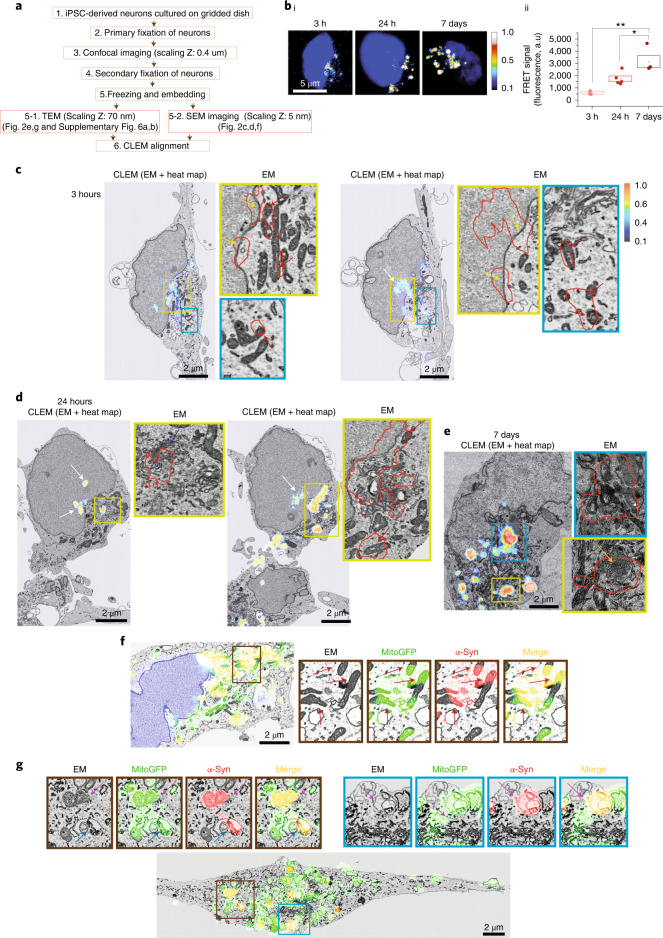
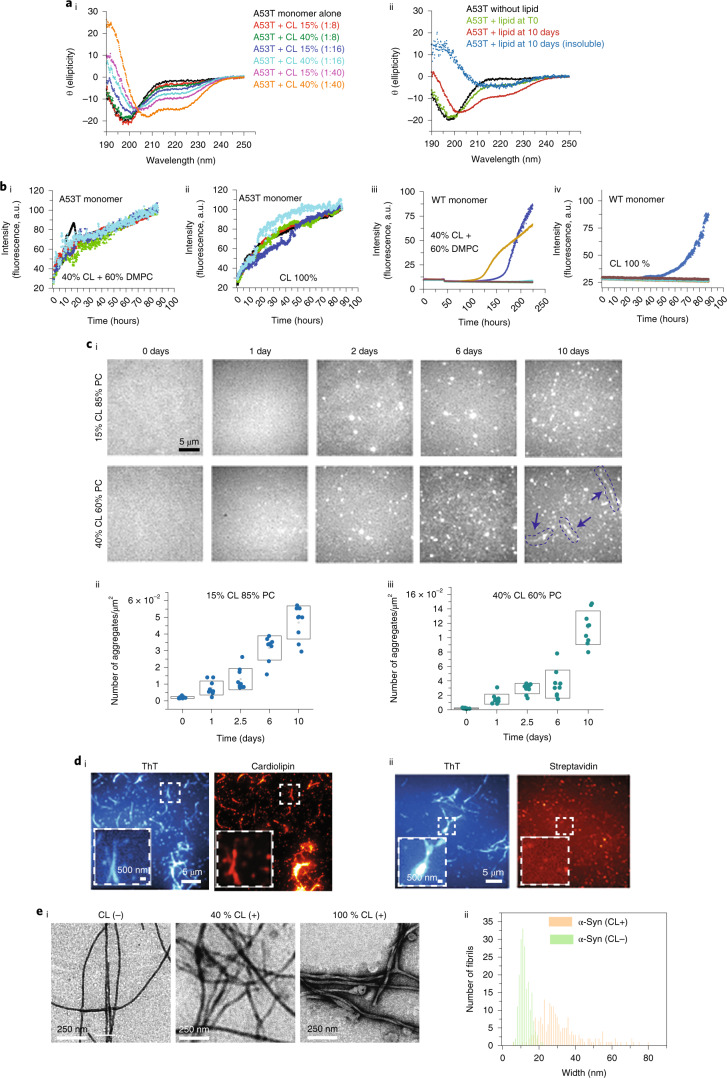
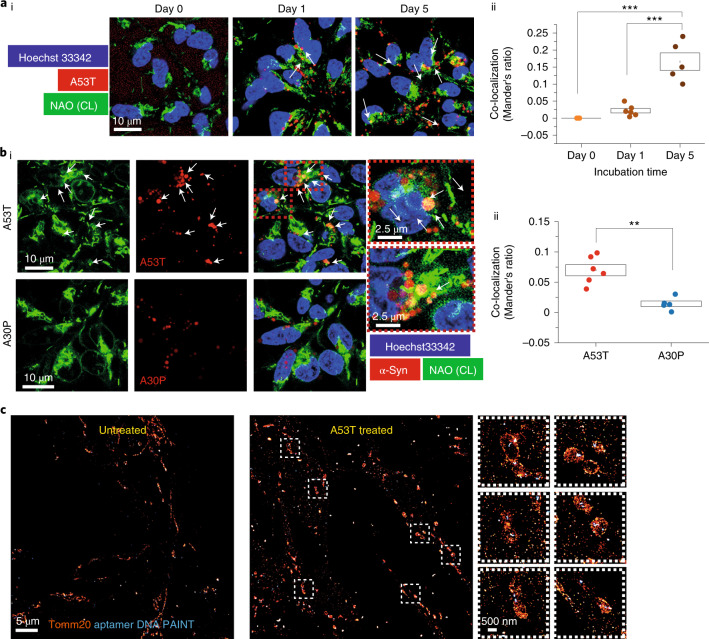
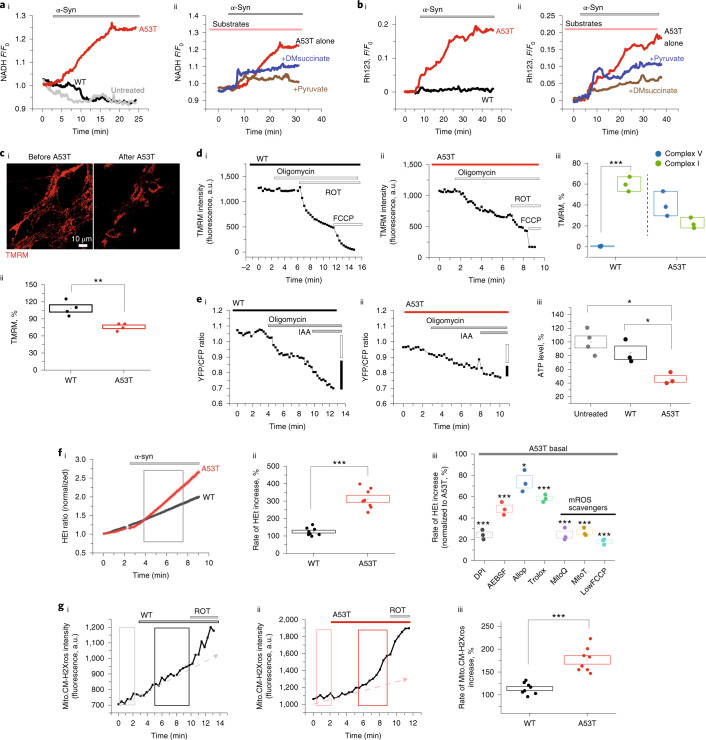
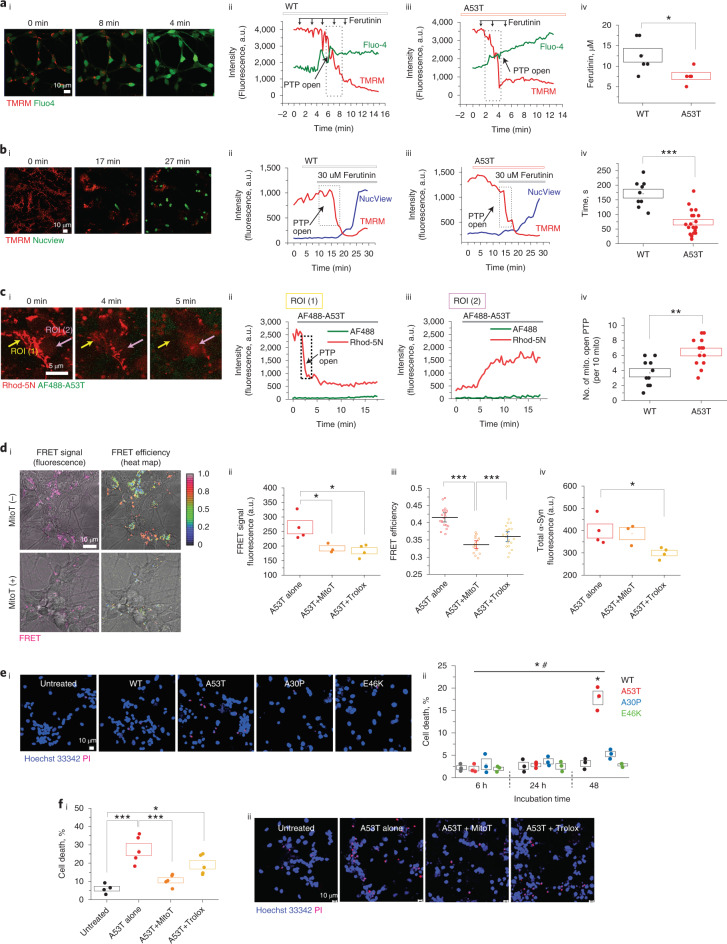
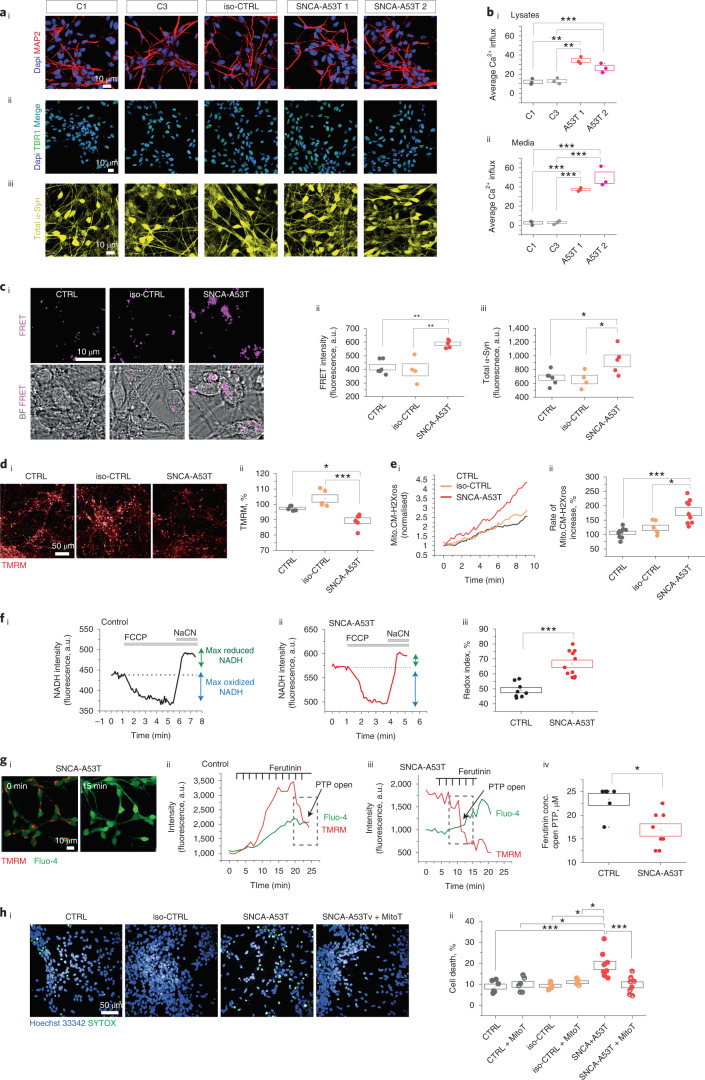
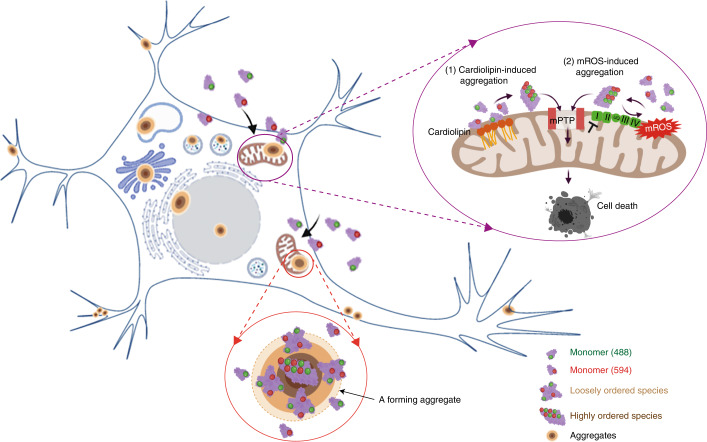
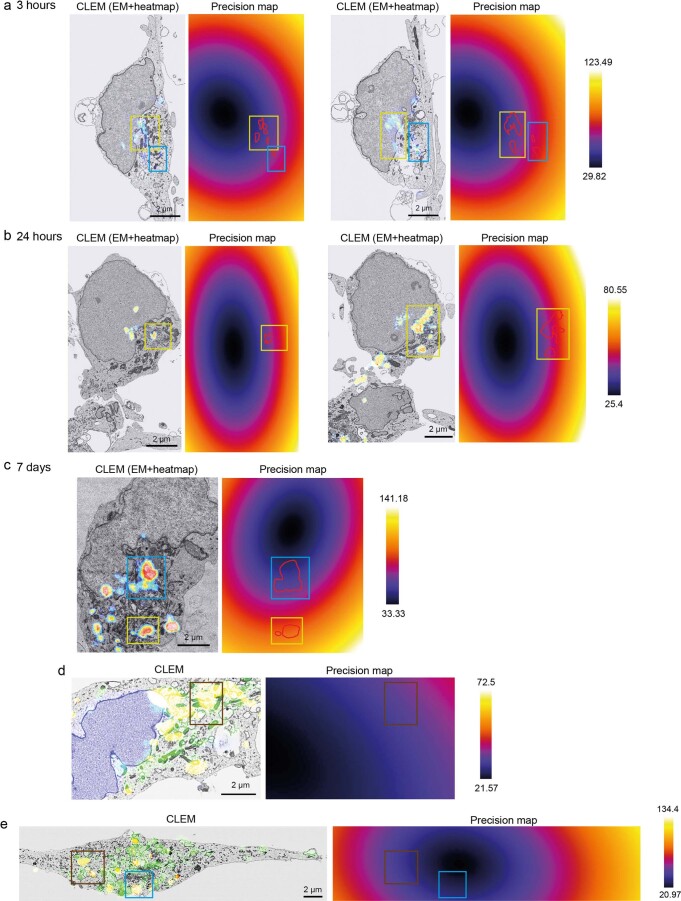
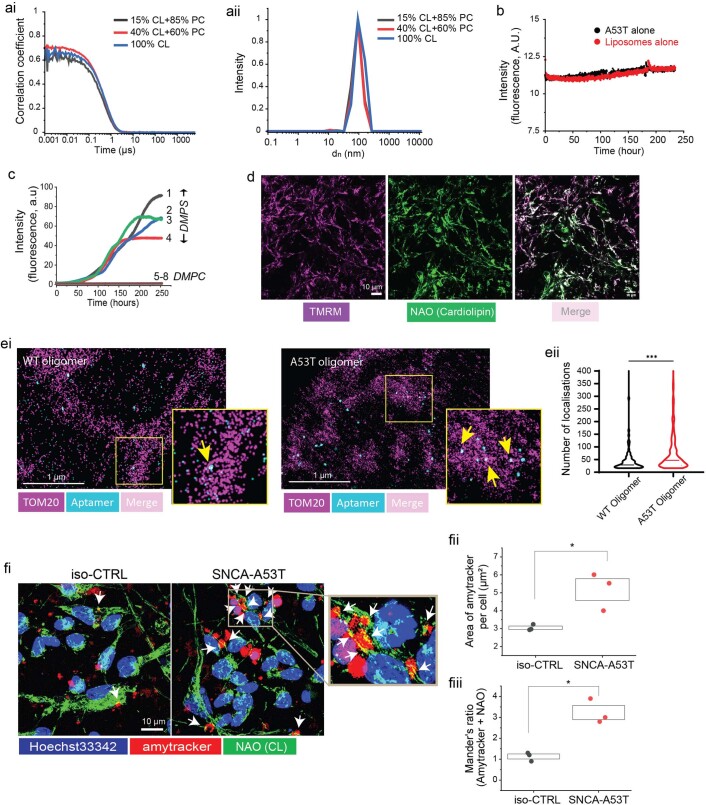
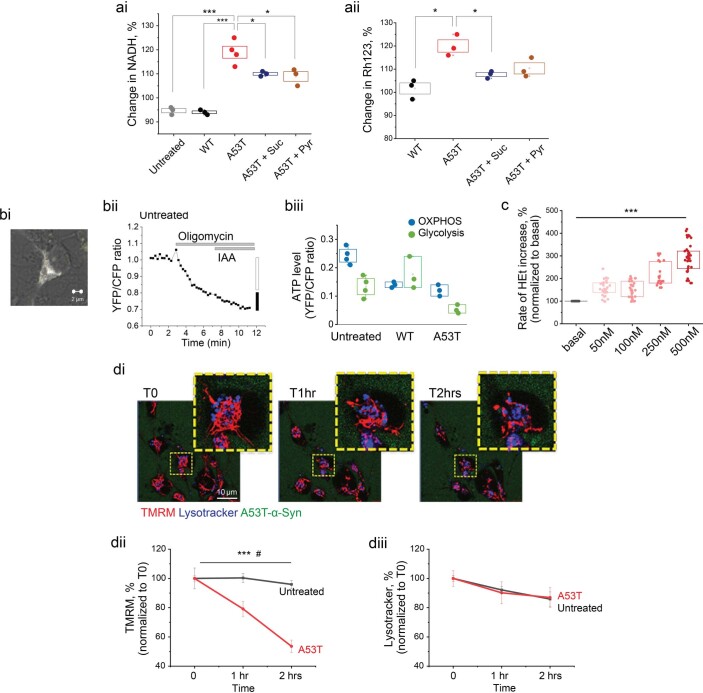
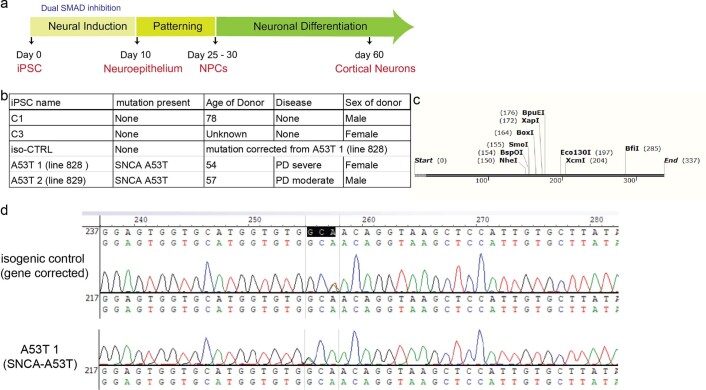
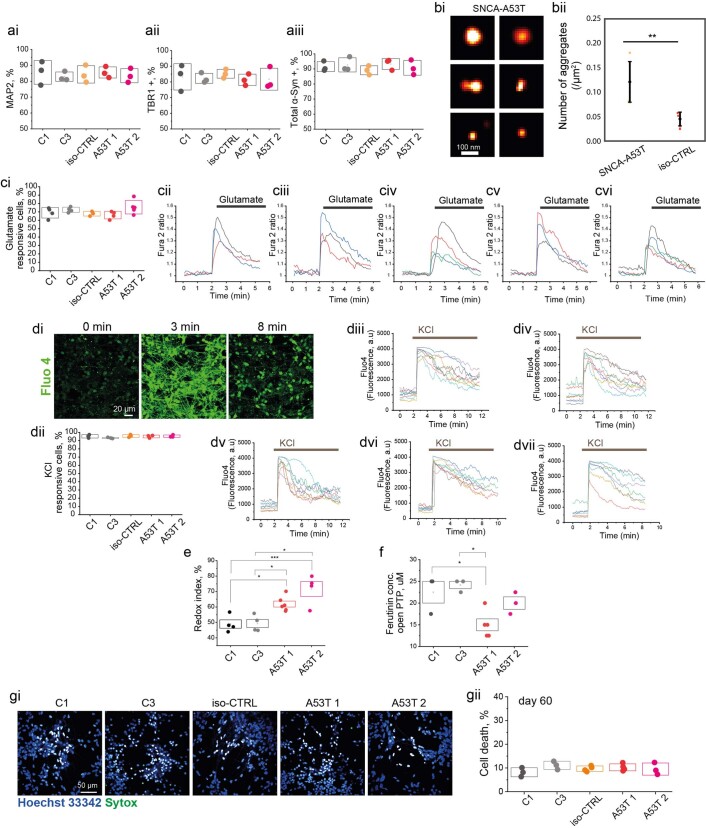
Aggregation of alpha-synuclein (α-Syn) drives Parkinson's disease (PD), although the initial stages of self-assembly and structural conversion have not been directly observed inside neurons. In this study, we tracked the intracellular conformational states of α-Syn using a single-molecule Förster resonance energy transfer (smFRET) biosensor, and we show here that α-Syn converts from a monomeric state into two distinct oligomeric states in neurons in a concentration-dependent and sequence-specific manner. Three-dimensional FRET-correlative light and electron microscopy (FRET-CLEM) revealed that intracellular seeding events occur preferentially on membrane surfaces, especially at mitochondrial membranes. The mitochondrial lipid cardiolipin triggers rapid oligomerization of A53T α-Syn, and cardiolipin is sequestered within aggregating lipid-protein complexes. Mitochondrial aggregates impair complex I activity and increase mitochondrial reactive oxygen species (ROS) generation, which accelerates the oligomerization of A53T α-Syn and causes permeabilization of mitochondrial membranes and cell death. These processes were also observed in induced pluripotent stem cell (iPSC)-derived neurons harboring A53T mutations from patients with PD. Our study highlights a mechanism of de novo α-Syn oligomerization at mitochondrial membranes and subsequent neuronal toxicity.


Conflict of interest statement

The authors declare no competing interests.

Figures

Fig. 1
Fig. 1. FRET sensor detects rapid intracellular oligomerization of A53T α-Syn.
ai, Schematic illustration showing how FRET sensor detects aggregation. aii, AF488-α-Syn and AF594-α-Syn monomers are applied to cells, and the FRET signal is detected. bi, Representative bright-field (BF) FRET images after 72-hour incubation with oligomers. bii, Application of 500 nM WT oligomeric α-Syn exhibits detectable FRET, which increases over time (n = 3 independent experiments). ci, Representative FRET images after 72-hour incubation with monomers. cii, Application of 500 nM monomeric α-Syn exhibits low FRET signal initially, followed by an increase in FRET over time (n = 3 independent experiments). di,dii, A53T monomer exhibits the highest intracellular accumulation of α-Syn and the highest intracellular FRET intensity over time (n = 3 or 4 independent experiments). eieiii, FRET efficiency was calculated and binned into histograms that were fit to two Gaussian distributions. After 3 hours, only a low-FRET-efficiency population (centered at E = 0.24) was present. After 3 days, a second higher-FRET-efficiency population appeared (E = 0.48), and the fraction of this increased over time. f, Fraction of the high-FRET-efficiency population (out of total FRET events) increases over time for the WT and all mutants. Fitting error is shown in Extended Data Fig. 2c (n = 3 or 4 independent experiments). gi, Single-molecule confocal microscopy under conditions of fast flow used to analyze cell lysates. gii, 2D contour plots of approximate oligomer size and FRET efficiency after application of the monomers and oligomers. Both the number of events and the size of the oligomers increase over time in all cases. giii, Number and type of oligomeric events in cell lysates from the monomer/oligomer-treated cells. Data are represented as data ± s.d., as fraction of coincident events (n = 2 independent samples). Fitting error is shown in Extended Data Fig. 3a. hi, Photobleaching step analysis for A53T-oligomer-treated cells. hii, Step-fit example of a single A53T oligomer (24 hours) intensity trace (intensity is plotted as analogue-to-digital units (ADU)). hiii, Each step indicates photobleaching of a single fluorophore, from which oligomer size can be estimated. Note: Data are represented as data ± s.e.m. (box) unless otherwise mentioned. Detailed statistical information is shown in Supplementary Table 1. See also Extended Data Figs. 1–4. a.u., arbitrary units. Source data
Fig. 2
Fig. 2. Oligomer formation occurs in multiple cell ‘hotspots’ at heterogeneous locations.
a, Schematic workflow of the experimental steps for 3D-CLEM. The light imaging was performed at 0.4-μm intervals; the radial point spread function (PSF) (as given by λ/2NA, where λ is the excitation wavelength and NA is the numerical aperture of the objective lens) is 212 nm, and the axial PSF is approximately 500 nm. The EM section thickness is 5 nm, and the CLEM precision errors are shown in Extended Data Fig. 6. bi, FRET intensity heat maps showing aggregate formation with high FRET signal intensity at the core and low FRET intensity in the surrounding rim. bii, Intracellular FRET intensity increases after application of 500 nM A53T monomers (n = 3 independent experiments). c,d, Application of equimolar concentration of AF488-A53T α-Syn and AF-594-A53T α-Syn (total 500 nM); images were obtained at three different timepoints: 3 hours (c), 24 hours (d) and 7 days (e). Each panel is composed of a confocal image of CLEM (EM + FRET heat map) and zoom of EM alone. Colored arrows indicate aggregates at mitochondria (red), nucleus (white), membrane (yellow), Golgi apparatus (blue) and vesicles (orange). f,g, CLEM alignment using genetically engineered construct mitoGFP to label mitochondria (f: SEM and g: TEM). The red arrows indicate α-Syn detection within mitochondria. Note: Error maps for all images used for this figure are presented in Extended Data Fig. 5. Data are represented as data ± s.e.m. (box). *P < 0.05 and **P < 0.005. Detailed statistical information is shown in Supplementary Table 1. See also Extended Data Figs. 5 and 6. a.u., arbitrary units; PSF, point spread function. Source data
Fig. 3
Fig. 3. CL triggers and accelerates the aggregation of A53T α-Syn.
a, Effect of CL on far-UV CD spectra of α-Syn. ai, A53T monomer (10 µM) in the presence of 15% and 40% CL at 1:8, 1:16 and 1:40 lipid:protein ratios. aii, A53T monomer in the absence of liposomes (black curve), in the presence of 40% CL before incubation (green curve), at plateau phase (red curve) and insoluble fraction (blue curve) after incubation at 37 °C in the presence of 40% CL and 60% PC liposomes with 1:8 ratio. The minima between 210 nm and 220 nm for the insoluble fraction shows the presence of amyloid structures in the sample. bibiv, 50 µM of the A53T monomer led to a substantially fast increase in ThT fluorescence in the presence of 40% or 100% CL compared to WT monomer. c, Time-dependent SAVE images of A53T monomers incubated with 15% or 40% CL over 0–10 days show an increase in the number of aggregates over time. ci, Representative images. Red arrows indicate amyloid fibrils. cii,ciii, Quantification of the TIRF microscopy images. di,dii, TIRF microscopy analysis shows co-localization between CL and α-Syn fibrils (ThT positive). ei, TEM images show that, in the presence of CL, fibrils of α-Syn have different morphology. eii, Quantitative histogram of fibril width shows the large distribution of width in the presence of CL (100% CL), which is expected for a hierarchical self-assembly model of amyloid formation. A total of 200 fibrils were analyzed for each group using an Image-J plugin. Note: Data are represented as mean ± s.d. Detailed statistical information is shown in Supplementary Table 1. See also Extended Data Fig. 7. a.u., arbitrary units; DMPC, dimyristoylphosphatidylcholine.
Fig. 4
Fig. 4. A53T α-Syn contacts CL as it aggregates.
ai,aii, Visualization of α-Syn contacts with CL in hiPSC-derived neurons using NAO. hiPSC-derived neurons were treated with 1 μM AF488-A53T α-Syn monomer, and contacts were measured at three timepoints: time 0, day 1 and day 5 (n = 5 fields imaged). bi,bii, Total α-Syn co-localisation with CL was higher in the cells treated with A53T monomers than with A30P monomers (n = 4 or 6 fields imaged). c, SMLM images show mitochondria labeled with Tomm20 (dSTORM) and aggregates labeled with a DNA-based aptamer (aptamer DNA PAINT). Panels on the right show a higher magnification. Note: Data are represented as data ± s.e.m. (box). **P < 0.005 and ***P < 0.0005. Detailed statistical information is shown in Supplementary Table 1. See also Extended Data Fig. 7. Source data
Fig. 5
Fig. 5. A53T α-Syn impairs mitochondrial bioenergetics and induces mitochondrial dysfunction.
ai, Increase in NADH autofluorescence after application of 500 nM A53T α-Syn (normalized to 1). aii, The increase in NADH is prevented by pre-incubation with pyruvate and succinate. bi, A53T monomer depolarizes Δψm as measured by an increase in rhodamine 123 (Rh123) fluorescence. bii, The decreased Δψm is also reversed by pre-application of pyruvate and succinate. ci,cii, Images showing reduction in Δψm after 30-minute incubation with A53T compared to WT and the quantitative histogram (n = 4 independent experiments). didiii, Response of Δψm to complex V inhibitor (oligomycin: 2.4 μg ml−1), complex I inhibitor (rotenone (ROT): 5 μM) and mitochondrial uncoupler (FCCP: 1 μM). The basal fluorescence intensity was reset at 1,500–2,500 a.u. (n = 3 independent experiments). eieiii, A53T reduces the total ATP production measured by FRET-ATP sensor compared to WT-treated or untreated cells (n = 3 or 4 independent experiments). fi,fii, Superoxide was increased after application of A53T but not WT α-Syn (n = 8 independent experiments). fiii, Inhibition of A53T-induced ROS by different inhibitors (n = 3 independent experiments). gigiii, mROS production was increased by A53T (n = 8 independent experiments). Note: 500 nM α-Syn monomer was applied for each experiment unless otherwise mentioned. Note: Data are represented as data ± s.e.m. (box). *P < 0.05, **P < 0.005 and ***P < 0.0005. Detailed statistical information is shown in Supplementary Table 1. See also Extended Data Fig. 8. a.u., arbitrary units. Source data
Fig. 6
Fig. 6. A53T α-Syn induces mPTP opening, and mROS accelerates oligomerization and cell death.
ai, Representative time course images showing that Δψm reduction (TMRM) is followed by an increase of cytoplasmic calcium level (Fluo-4) at the point of mPTP opening. aii,aiii, Representative traces from the cells treated with 500 nM of WT or A53T α-Syn, respectively. aiv, A53T-treated cells require lower concentrations of ferutinin to open the mPTP than WT-treated cells (n = 4 or 6 independent experiments). bi, Representative time course images showing that apoptosis (NucView) is induced after a substantial loss of Δψm after ferutinin-induced PTP opening. bii,biii, Representative traces and WT-treated or A53T-treated cells. biv, A53T α-Syn treatment induces earlier PTP opening than WT α-Syn (n = 9 or 19 cells over two independent experiments). c, mPTP opening in isolated mitochondria from permeabilized cells. ci, Representative time course images of mPTP opening after applying AF-488-A53T α-Syn. cii,ciii, The mitochondrial area (ROI 1 area) exhibited a rapid loss of Δψm, whereas the extra-mitochondrial area (ROI 2) exhibited increased intensity of Rhod-5N after mPTP opening. civ, Quantitative histogram showing that PTP opening occurs earlier in A53T-treated than WT-treated mitochondria (n = 10 or 13 cells over two independent experiments). d, FRET intensity and FRET efficiency of A53T are reduced by treatment with mito-TEMPO. di, The representative images. dii,diii, Mito-TEMPO-treated cells show reduced A53T FRET intensity (dii; n = 3 or 4 independent experiments) and efficiency (diii; n = 20 or 15 cells over three independent experiments, and error bars represent 95% CIs). div, Application of Trolox to cells reduced FRET intensity signal by reducing uptake of donor (diidiv; n = 3 or 4 independent experiments). ei,eii, Cell death was induced by 48-hour incubation of A53T but not by WT or A30P/E46K (n = 3 independent experiments). fi,fii, A53T-induced cell death was rescued by treatment with mito-TEMPO (n = 4 or 5 independent experiments). Note: 100 μM Trolox and 0.5 μM mito-TEMPO (MitoT) were pre-treated 30 minutes before α-Syn application. Note: Data are represented as data ± s.e.m. (box). *P < 0.05, **P < 0.005 and ***P < 0.0005. Detailed statistical information is shown in Supplementary Table 1. a.u., arbitrary units. Source data
Fig. 7
Fig. 7. SNCA-A53T hiPSC-derived neurons exhibit accelerated α-Syn seeding and mitochondrial dysfunction.
a, Characterization of cortical neurons using immunocytochemistry at day 70 of neural induction (C1: control; C2: control, iso-CTRL: isogenic control of SNCA-A53T mutant line 1; A53T 1: SNCA-A53T mutant line 1; A53T 2: SNCA_A53T mutant line 2). ai, Neuronal marker MAP2. aii, Cortical layer VI marker TBR1. aiii, Total α-Syn. Quantification is shown in Extended Data Fig. 10ai–aiii. bi,bii, Lysates from SNCA-A53T neurons contain oligomers that cause increased membrane permeability compared to control neurons (n = 3 independent experiments). ciciii, Application of AF-488 A53T and AF594-A53T α-Syn to cells results in higher intracellular FRET intensity (n = 4, 5 or 6 independent experiments). di,dii, There is lower Δψm in A53T-SNCA neurons than in control, measured by TMRM fluorescence (n = 5 or 6 independent experiments). ei,eii, Increased production of mROS measured by mitoTrackerCM-H2Xros in SNCA-A53T neurons (n = 7 or 9 independent experiments). fifiii, SNCA-A53T neurons exhibit a higher redox index than control neurons, indicating complex I inhibition (n = 8 or 11 independent experiments). Data from individual lines are present in Extended Data Fig. 10b. gigiv, SNCA-A53T require lower concentrations of ferutinin for mPTP opening. Data from individual lines are present in Extended Data Fig. 10c (n = 6 or 8 independent experiments). hi,hii, SNCA-A53T neurons exhibit higher cell death than control neurons at day 80 (there was no difference in basal cell death at day 60 as shown in Extended Data Fig. 10d), which can be rescued by 0.1 mM mito-TEMPO (n = 5 or 9 independent experiments). Note: Data are represented as data ± s.e.m. (box). *P < 0.05, **P < 0.005 and ***P < 0.0005. Detailed statistical information is shown in Supplementary Table 1. See also Extended Data Fig. 10. a.u., arbitrary units; BF, bright-field. Source data
Fig. 8
Fig. 8. Graphical illustration showing how α-Syn monomers form aggregates inside neurons and induce cell toxicity.
Graphical illustration showing how α-Syn monomers form aggregates inside neurons and induce cell toxicity. Monomeric α-Syn is taken up in neurons where it begins to self-assemble first into a population of amorphous, loosely ordered oligomeric species, which progress to form highly ordered oligomeric species. Aggregates form with a dense central core of highly ordered oligomers surrounded by a rim of loosely packed oligomers and occur in multiple hotspots throughout the cell body, including the nucleus, Golgi, vesicles and mitochondria. Mitochondria are a critical site of aggregation due to the functional consequences: CL triggers oligomerization of A53T α-Syn. A53T α-Syn induces over-production of mROS, promoting oligomerization of α-Syn. A53T α-Syn oligomerization impairs complex I function and ATP production and promotes early opening of mPTP, leading to cell death.
Extended Data Fig. 1
Extended Data Fig. 1. Related to main Fig. 1.
(ai) α-Syn-AF488-monomer or α-Syn-AF594-monomer alone did not induce a FRET signal. (aii) FRET was not induced by 594 nm excitation. (b) Time-lapse representative images of FRET showing intracellular localization of α-Syn assemblies after adding AF488-α-Syn and AF-594-α-Syn monomers to the media. (ci & ii) Intracellular FRET signal induced by WT α-Syn (ci; oligomer, cii; monomer) occurred in a concentration- and time-dependent manner (n = 3 independent experiments). The minimum concentration to induce FRET within 72 hours was 5 nM oligomer; the minimum monomer concentration to induce FRET at 72 hours was 50 nM, whilst 500 nM monomer induced a FRET signal within 3 hours (di & ii) FRET signal colocalized with an amyloid oligomer-specific aptamer and partially with an α-Syn filament antibody. (diii) Co-localization was quantified using Mander’s ratio (n = 3 independent experiments). Note. Data are represented as Data ± SEM (box). *#p < 0.05, **##p < 0.005, ***###p < 0.0005. Detailed statistical information is provided in Supplementary Table 1. Source data
Extended Data Fig. 2
Extended Data Fig. 2. Related to main Fig. 1.
(ai,aii) Representative brightfield (BF) and confocal images of FRET signal induced by application of WT or mutant α-Syn in main Fig. 1d. (b) Intracellular FRET signal induced by A53T α-Syn monomers occurred in a concentration- and time-dependent manner (n = 3, 6 or 10 fields imaged over 2 or 4 independent experiments; more experiments were performed with the concentrations that produced higher FRET signal). (c) Higher oligomer concentration was measured in A53T monomer-treated cells compared to WT-treated cells after 3 days of incubation. Concentration was measured using a Human Synuclein, alpha (non A4 component of amyloid precursor) oligomer (SNCA oligomer) ELISA kit (CSB-E18033h, Generon) (n = 3 independent experiments). (d) fitting error for main Fig. 1f. Data are represented as mean ± SD. (ei) FRET histograms of different ratios of duplexes analyzed using single-molecule confocal microscopy. (eii) Number and the fraction of detected species for different mixtures of Duplex-1 and Duplex-2. Note. Data are represented as Data ± SEM (box). *#p < 0.05, **##p < 0.005, ***###p < 0.0005. Detailed statistical information is provided in Supplementary Table 1. Source data
Extended Data Fig. 3
Extended Data Fig. 3. Related to main Fig. 1.
(a) smFRET efficiency histograms of cell lysate data from Fig. 1g. Oligomer populations were fit (using a custom script written in Igor Pro, Wavemetrics) for medium-sized oligomers (deemed to be between 3 and 20 subunits). Oligomers were determined to be either low FRET (green fit line) or high FRET (orange) based on their histogram population distributions. At 24 hours, the number of oligomers detected was highest for cells treated with A53T oligomers, followed by cells treated with A53T monomers, with the cells treated with A30P monomers being the lowest in oligomer number. (b) Fitting error for main Fig. 1giii. Data expressed as mean ± SD. (ci & ii) smFRET shows there is a minimal number of oligomers (as a fraction of total α-Syn protein) in the media formed (di) and that oligomer formation is within cells (lysates) (dii) after the 24 hours incubation. Data are represented as a box plot showing replicate values and SD (n = 2 independent experiments). (di & ii) Comparison of A53T monomeric and oligomeric α-Syn from the media collected 1 day or 3 days after A53T monomer treatment (0.5 μM) using ELISA kits (Monomer; LEGEND MAX™ Human α-Synuclein ELISA Kit (SIG-38974, BioLegend), Oligomer; Human Synuclein, alpha (non A4 component of amyloid precursor) oligomer (SNCA oligomer) ELISA kit (CSB-E18033h, Generon). Over time, the monomeric α-Syn concentration in the media drops due to the intracellular uptake, whilst the oligomer concentration in the media constantly remained low (n = 3 independent experiments). (ei) TIRF images demonstrate that oligomers, but not fibrils, are detected in the lysates following 7 days of labeled A53T monomer treatment. (eii & iii) Photobleaching data demonstrating number of monomers in each oligomer detected in the lysate of cells treated with A53T monomer and A30P monomer respectively, in parallel with data shown in Fig. 1hiii. (fi & ii) Sensitivity of oligomers to Proteinase-K degradation in vitro. (fi) Two-dimensional contour plots of approximate oligomer sizes and FRET efficiency following application of increasing concentrations of proteinase-K to A53T aggregates formed at different timepoints. (fii) Fraction of degradation relative to the concentration of proteinase-K varies according to oligomer type. High-FRET aggregates (Type B) are more resistant to proteinase-K digestion than low-FRET (Type A). Note. Data are represented as Data ± SEM (box). *p < 0.05. Detailed statistical information is provided in Supplementary Table 1. Source data
Extended Data Fig. 4
Extended Data Fig. 4. Related to main Fig. 1.
(a) Formation of aggregates detected by FRET is not affected by unlabeled α-Syn. (ai & ii) Representative TIRF images of labeled recombinant A53T oligomers (formed after 7 days aggregation) that were formed in the absence (ai) and presence (aii) of 7 μM unlabeled wildtype (WT) α-Syn show that the presence of unlabeled protein has no effect on aggregate formation (n = 2 independent experiments) (aiii) Size and FRET distributions of oligomers detected using single-molecule confocal microscopy when labeled α-Syn aggregates in the absence (left) or presence (right) of 7 μM unlabeled WT α-Syn. (b-d) Concentrations of endogenous α-Syn did not affect aggregation kinetics measured by single-molecule (sm) FRET. (bi & ii) Allelic series of iPSC lines display different levels of α-Syn using Human Synuclein monomer ELISA kit (bi; n = 3 independent experiments), and SNCA mRNA by qPCR (bii; average of three wells, n = 1 independent experiment). (c) A53T-AF488 and AF-594 monomers (total 1 μM) were added to the three iPSC derived neurons and smFRET was performed on the cell lysates. (ci) Analysis of total FRET (coincident) events for the iPSC lines demonstrate non-significant higher mean events for SNCA 4 alleles at 24 hours, data shown as mean ± SD. (cii & iii) 2D contour plots from smFRET measurements of cell lysates show no difference in FRET efficiencies across the three cell lines, indicating aggregates formed in cells with different levels of the endogenous α-Syn show negligibe difference in FRET efficiency. (cii) and (ciii) show two separate replicates. (di-iii) FRET measurements obtained 24 hours after A53T-AF488 and AF594 monomer treatment show there is no difference in total α-Syn uptake (dii) and FRET intensity (diii) across the cells with different endogenous SNCA expression levels (n = 3 or 4 independent experiments). Experiments were performed at an early timepoint post differentiation day 50. Note. Data are represented as Data ± SEM (box) unless mentioned. ***p < 0.0005. Detailed statistical information is provided in Supplementary Table 1. Source data
Extended Data Fig. 5
Extended Data Fig. 5. Related to main Fig. 2.
(a & b) FRET-CLEM images after addition of AF488 and AF594-labeled α-Syn at 24 hours (A53T monomer) and 5 hours (A53T oligomer), respectively. High (red) and low (blue) areas of heatmap representing FRET intensity were detected in human neurons. (c) Cell death following treatment with A53T monomer in iPSC derived control neurons (ci) 18.2 ± 1.22% cell death after 48 hours and 24.1 ± 2.87% cell death after 7 days of treatment with A53T monomers in iPSC derived neurons. (cii) An example of cell selection for CLEM (after fixation). After 7 days of treatment, cells were fixed, and morphologically confirmed intact neurons were selected to perform CLEM experiment (n = 3 or 4 independent experiments). Note. Data are represented as Data ± SEM (box). *p < 0.05, **p < 0.005. Detailed statistical information is provided in Supplementary Table 1. Source data
Extended Data Fig. 6
Extended Data Fig. 6. Related to main Fig. 2.
(a-e) Global prediction of registration error in nanometers (nm) from Fig. 2c-g respectively. The CLEM precision error is 20 nm to 150 nm in the x.y axis, and importantly around 20 nm at the point of the alignment organelle (nucleus or mitochondria). Organelles such as autophagosomes, lysosomes and mitochondria are small in size (< 1.5 μm), whilst the nucleus is larger (<10μm). If the size of the organelle is larger relative to the precision error (at the point of alignment), the fluorescent signals are likely to originate within the identified subcellular region, as is the case for larger organelles, while the fluorescent signal may originate partially outside the EM imaging area for smaller organelles.
Extended Data Fig. 7
Extended Data Fig. 7. Related to main Fig. 3 & 4.
(a) The hydrodynamic diameter (dh) of 150 mM lipid vesicles was determined by dynamic light scattering. (ai) Correlation function of the sample (aii) Size distribution of lipid vesicles determined by mass unweighted fitting which shows the distribution of lipid vesicles centered at 89, 92 and 104 nm for 15%, 40% and 100% cardiolipin in the vesicles, respectively. (b) No increase in ThT was observed in the control experiments with either A53T alone (black line) or liposomes alone (red line). (c) Kinetics of amyloid formation by α-Syn (50 µM) in the presence of DMPS (curve 1-4) and in the presence of DMPC (curve 5-8). Measurements were performed at 37 °C and pH 7.4. Protein concentration was 50 µM and lipid vesicle concentration was 400 µM. Thioflavin T (ThT) fluorescence was excited at 450 nm, and the emission wavelength was 482 nm. (d) NAO is co-localized mainly with a mitochondrial indicator, TMRM. (ei & ii) Single-molecule light microscopy (SMLM) images showing tom20-labeled mitochondria (dSTORM) and aggregates imaged with the aptamer (aptamer-DNA PAINT) in cyan, in WT and A53T oligomer treated iPSC-derived cortical neurons. Panel highlighted shows higher magnification. (eii) Quantification of the number of single-molecule localizations detected per aggregate in WT and A53T oligomer treated conditions (n = 70-310 aggregates per condition, *** p < 0.0005, Mann-Whitney t-test). (f) Contacts between α-Syn aggregates (labeled with amytracker) and cardiolipin (labelled with NAO) (fi) Representative images. (fii) Amytracker exhibits a higher fluorescent signal in SNCA-A53T than iso-CTRL neurons after the application of recombinant WT (99% monomer, 1% oligomer) (n = 3 fields imaged over 2 independent experiments). (fiii) Amytracker co-localization with NAO is higher in SNCA-A53T neurons than iso-CTRL (n = 3 fields imaged over 2 independent experiments). Note. Data are represented as Data ± SEM (box) unless mentioned. *p < 0.05, ***p < 0.0005. Detailed statistical information is provided in Supplementary Table 1. Source data
Extended Data Fig. 8
Extended Data Fig. 8. Related to main Fig. 5.
(ai & ii) Quantitative histograms referring to Fig. 4a and b respectively Suc; DMsuccinate, Pyr; Pyruvate, Rh123; Rhodamine 123. (ai) A53T vs untreated or WT or A53T + Suc or A53T + Pyr (n = 3 or 4 fields imaged over 2 independent experiments). (aii) A53T vs WT or A53T + Suc (n = 3 independent experiments) (bi) Representative image of transfected cells with ATP probe. (bii) Representative trace of ATP measurement in untreated cells. (biii) The proportional contribution of oxidative phosphorylation (OXPHOS) and glycolysis to ATP levels in untreated, WT or A53T treated cells, shown in main Fig. 5eiii. (c) Superoxide is produced in a concentration dependent manner from A53T-α-Syn monomer (n = 32, 34 or 37 cells over 2 independent experiments). (di) Time lapse single cell imaging of mitochondria after application of AF488-A53T α-Syn. (dii & iii) Δψm measured by TMRM fluorescent signal (intensity, a.u.) is significantly reduced after 2 hours whilst there is no change in the fluorescent signal (intensity, a.u.) of lysotracker after application of A53T α-Syn (n = 3 cells). Note. Data are represented as Data ± SEM (box) unless mentioned. *p < 0.05, ***p < 0.0005. Detailed statistical information is provided in Supplementary Table 1. Source data
Extended Data Fig. 9
Extended Data Fig. 9. Related to main Fig. 7.
(a) A summary of the neuronal differentiation protocol from hiPSCs into cortical neurons. Enrichment of hiPSC- derived cortical neurons is achieved after day 60. (b) Donor information of iPSCs used in this study. (c & d) Design for Sanger sequence to confirm A53T point mutation on SNCA and isogenic control line. Sanger sequencing confirmed that clone #2-68 and #5-26 are homozygous for Threonine at both alleles (GCA or GCT), while their isogenic clones and c1729 lines (iPSC derived from PD patient carrying A53T mutation) are heterozygous for Alanine (GCA) and T (ACA) at each allele.
Extended Data Fig. 10
Extended Data Fig. 10. Related to main Fig. 7.
(ai-iii) Quantification of neuronal markers and cells expressing total α-Syn for the main Fig. 7ai-iii (n = 3 independent experiments). (b) Aptamer PAINT on cell lysates from iso-CTRL and A53T show higher numbers of endogenous aggregates in A53T cells. (bi) Example AD-PAINT images of aggregates from SNCA-A53T. (bii) There is a two-fold increase in aggregates in cell lysates from SNCA-A53T compared to iso-CTRL (n = 2 independent experiments). Data expressed as mean ± SD. (ci) Assessment of glutamatergic signaling using [Ca2+] imaging. Both control and SNCA-A53T cells were responsive to 5 uM glutamate (n = 3, 4 or 5 independent experiments). (cii-vi) Representative traces of C1, C3, iso-CTRL, A53T 1 and A53T 2 lines respectively. (d) Assessment of calcium response to KCl using Fluo4 calcium indicator. (di) Representative images of Fluo4 changes (C1 line) in response to KCl. (dii) Both controls and SNCA-A53T lines have a high proportion of cells responding to KCl (n = 3 independent experiments). (dii-vii) Representative traces of C1, C3, iso-CTRL, A53T 1 and A53T 2 lines respectively. (e) Quantification of redox index for individual cell lines (n = 3 or 6 independent experiments) (f) Quantification of ferutinin concentrations to open PTP for individual lines (n = 3, 4 or 5 independent experiments). (gi-ii) Assessment of basal cell death at day 60 in vitro for individual cell lines. There is no significant difference across the lines (n = 3, 4 or 5 independent experiments). Note. Data are represented as Data ± SEM (box) unless mentioned. *p < 0.05, ***p < 0.0005. Detailed statistical information is provided in Supplementary Table 1. Source data

References

    1. Chartier-Harlin MC, et al. α-synuclein locus duplication as a cause of familial Parkinson’s disease. Lancet. 2004;364:1167–1169. - PubMed
    1. Conway KA, et al. Acceleration of oligomerization, not fibrillization, is a shared property of both α-synuclein mutations linked to early-onset Parkinson’s disease: implications for pathogenesis and therapy. Proc. Natl Acad. Sci. USA. 2000;97:571–576. - PMC - PubMed
    1. Eliezer D, et al. Conformational properties of α-synuclein in its free and lipid-associated states. J. Mol. Biol. 2001;307:1061–1073. - PubMed
    1. Spillantini MG, et al. α-Synuclein in Lewy bodies. Nature. 1997;388:839–840. - PubMed
    1. Weinreb PH, et al. NACP, a protein implicated in Alzheimer’s disease and learning, is natively unfolded. Biochemistry. 1996;35:13709–13715. - PubMed

Publication types