. 2022 Aug 30;12(1):14740.
doi: 10.1038/s41598-022-18696-6.

Machine learning-based automatic estimation of cortical atrophy using brain computed tomography images

Affiliations

Machine learning-based automatic estimation of cortical atrophy using brain computed tomography images

Jae-Won Jang et al. Sci Rep. .

Abstract

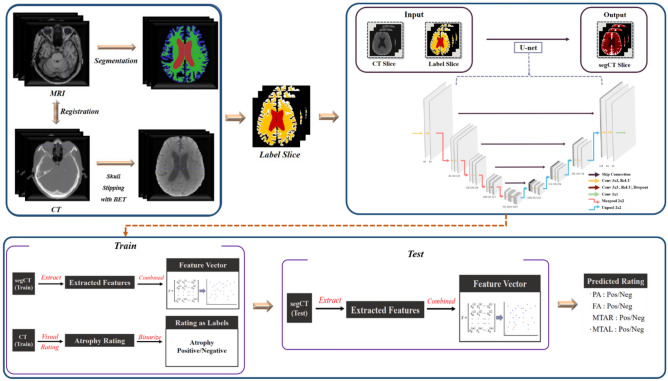
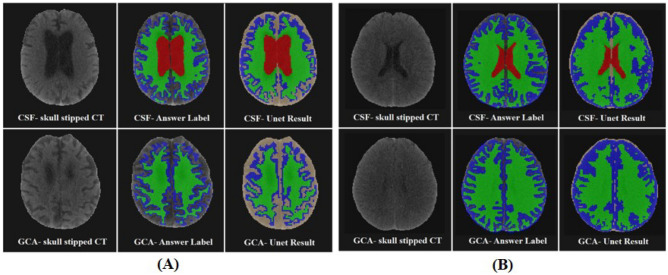
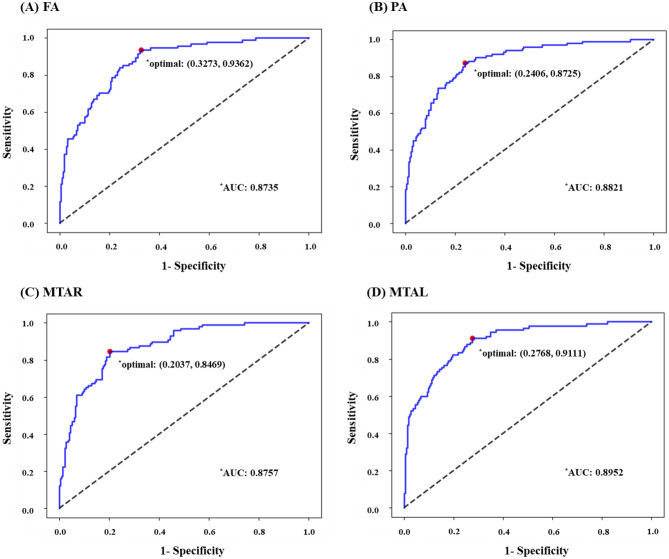
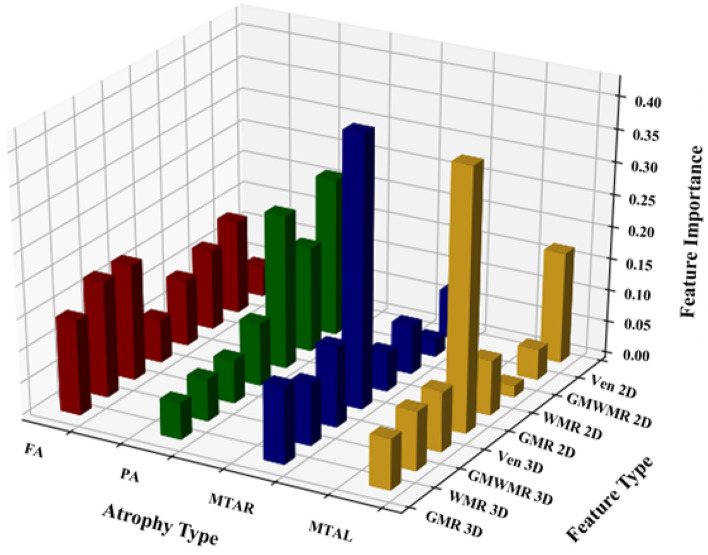
Cortical atrophy is measured clinically according to established visual rating scales based on magnetic resonance imaging (MRI). Although brain MRI is the primary imaging marker for neurodegeneration, computed tomography (CT) is also widely used for the early detection and diagnosis of dementia. However, they are seldom investigated. Therefore, we developed a machine learning algorithm for the automatic estimation of cortical atrophy on brain CT. Brain CT images (259 Alzheimer's dementia and 55 cognitively normal subjects) were visually rated by three neurologists and used for training. We constructed an algorithm by combining the convolutional neural network and regularized logistic regression (RLR). Model performance was then compared with that of neurologists, and feature importance was measured. RLR provided fast and reliable automatic estimations of frontal atrophy (75.2% accuracy, 93.6% sensitivity, 67.2% specificity, and 0.87 area under the curve [AUC]), posterior atrophy (79.6% accuracy, 87.2% sensitivity, 75.9% specificity, and 0.88 AUC), right medial temporal atrophy (81.2% accuracy, 84.7% sensitivity, 79.6% specificity, and 0.88 AUC), and left medial temporal atrophy (77.7% accuracy, 91.1% sensitivity, 72.3% specificity, and 0.90 AUC). We concluded that RLR-based automatic estimation of brain CT provided a comprehensive rating of atrophy that can potentially support physicians in real clinical settings.


Conflict of interest statement

The authors declare no competing interests.

Figures

Figure 1
Figure 1
A scheme of framework. Tensors are indicated as boxes while arrows denote computational operations. Number of channers is indicated beneath each box. Input and output of this network are CT slice with Label slice pairs and segmented CT images (segCT) slice. The classification conducted by threefold cross-validation was performed by randomly assigned the subject into three subgroups. BET Brain extraction, ReRU rectified linear unit activation, segCT Segmented CT, RLR regularized logistic regression, FA frontal atrophy, PA Parietal atrophy, MTAR medial temporal atrophy, right, MTAL medial temporal atrophy, left, Pos positive, Neg negative.
Figure 2
Figure 2
Sample of segmentation result (A) Alzheimer’s dementia (B) Normal control. GCA global cortical atrophy, CSF cerebrospinal fluid. Green = white matter, blue = gray matter, red = CSF.
Figure 3
Figure 3
ROC Curve for binary classification of atrophy. FA frontal atrophy, PA Parietal atrophy, MTAR medial temporal atrophy, right, MTAL medial temporal atrophy, left.
Figure 4
Figure 4
Feature importance of visual rating scale. FA frontal atrophy; PA parietal atrophy; MTAR medial temporal atrophy, right; MTAL medial temporal atrophy, left; Ven2D (the area ratio of ventricle); GMWMR2D (the area ratio of the sum of gray matter [GM] and white matter [WM]); WMR2D (the area ratio of WM); GMR2D (the area ratio of GM); Ven3D (the volume ratio of the ventricle); GMWMR3D (the volume ratio of the sum of GM and WM); WMR3D (the volume ratio of WM); GMR3D (the volume ratio of GM).

Similar articles

Cited by

References

    1. McKhann GM, et al. The diagnosis of dementia due to Alzheimer’s disease: Recommendations from the National Institute on Aging-Alzheimer’s Association workgroups on diagnostic guidelines for Alzheimer’s disease. Alzheimer’s Dementia. 2011 doi: 10.1016/j.jalz.2011.03.005. - DOI - PMC - PubMed
    1. Wardlaw JM, et al. Neuroimaging standards for research into small vessel disease and its contribution to ageing and neurodegeneration. Lancet Neurol. 2013 doi: 10.1016/S1474-4422(13)70124-8. - DOI - PMC - PubMed
    1. Jack CR, Shiung MM, Gunter JL, et al. Comparison of different MRI brain atrophy rate measures with clinical disease progression in AD. Neurology. 2004;62(4):591–600. doi: 10.1212/01.WNL.0000110315.26026.EF. - DOI - PMC - PubMed
    1. den Heijer T, van der Lijn F, Koudstaal PJ, et al. A 10-year follow-up of hippocampal volume on magnetic resonance imaging in early dementia and cognitive decline. Brain. 2010;133(4):1163–1172. doi: 10.1093/brain/awq048. - DOI - PubMed
    1. Scheltens P, et al. Atrophy of medial temporal lobes on MRI in ‘probable’ Alzheimer’s disease and normal ageing: diagnostic value and neuropsychological correlates. J. Neurol. Neurosurg. Psychiatry. 1992 doi: 10.1136/jnnp.55.10.967. - DOI - PMC - PubMed

Publication types