

The utility of texture analysis of kidney MRI for evaluating renal dysfunction with multiclass classification model
- PMID: 36042326
- PMCID: PMC9427930
- DOI: 10.1038/s41598-022-19009-7
The utility of texture analysis of kidney MRI for evaluating renal dysfunction with multiclass classification model
Abstract
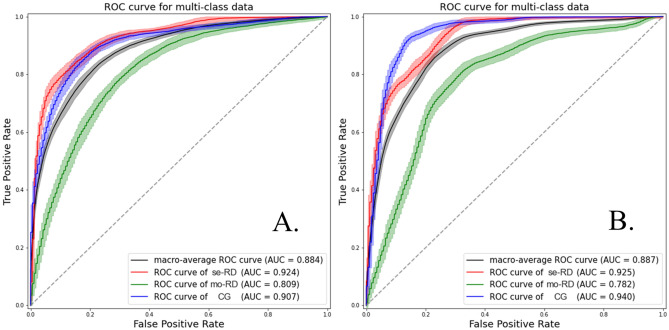
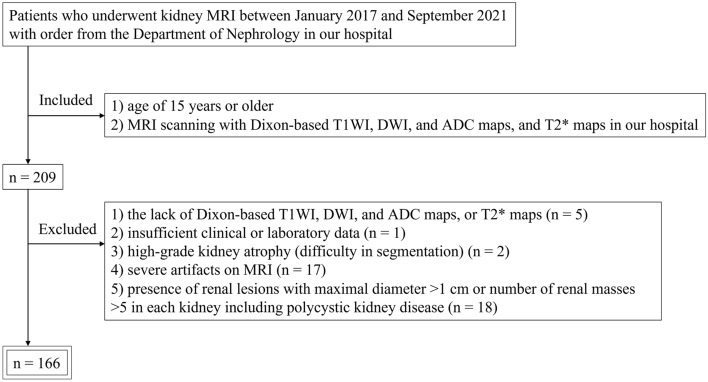
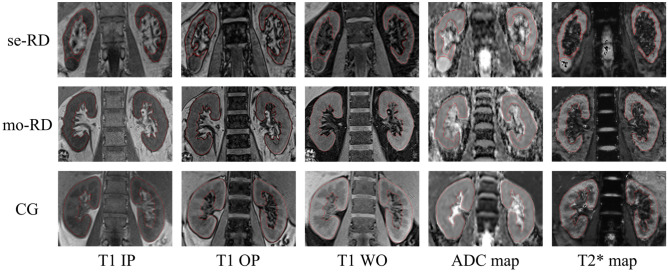
We evaluated a multiclass classification model to predict estimated glomerular filtration rate (eGFR) groups in chronic kidney disease (CKD) patients using magnetic resonance imaging (MRI) texture analysis (TA). We identified 166 CKD patients who underwent MRI comprising Dixon-based T1-weighted in-phase (IP)/opposed-phase (OP)/water-only (WO) images, apparent diffusion coefficient (ADC) maps, and T2* maps. The patients were divided into severe, moderate, and control groups based on eGFR borderlines of 30 and 60 mL/min/1.73 m2. After extracting 93 texture features (TFs), dimension reduction was performed using inter-observer reproducibility analysis and sequential feature selection (SFS) algorithm. Models were created using linear discriminant analysis (LDA); support vector machine (SVM) with linear, rbf, and sigmoid kernels; decision tree (DT); and random forest (RF) classifiers, with synthetic minority oversampling technique (SMOTE). Models underwent 100-time repeat nested cross-validation. Overall performances of our classification models were modest, and TA based on T1-weighted IP/OP/WO images provided better performance than those based on ADC and T2* maps. The most favorable result was observed in the T1-weighted WO image using RF classifier and the combination model was derived from all T1-weighted images using SVM classifier with rbf kernel. Among the selected TFs, total energy and energy had weak correlations with eGFR.
© 2022. The Author(s).
Conflict of interest statement
The authors declare no competing interests.
Figures


References
-
- Eknoyan G, et al. KDIGO 2012 clinical practice guideline for the evaluation and management of chronic kidney disease. Kidney Int. Suppl. 2013;3:1–150. - PubMed
-
- Go AS, Chertow GM, Fan D, McCulloch CE, Hsu C. Chronic kidney disease and the risks of death, cardiovascular events, and hospitalization. N. Engl. J. Med. 2004;351:1296–1305. - PubMed
-
- ESUR Guidelines on Contrast Media version 10.0. http://www.esur.org/esur-guidelines/ - PubMed
-
- Berchtold L, et al. Validation of the corticomedullary difference in magnetic resonance imaging-derived apparent diffusion coefficient for kidney fibrosis detection: A cross-sectional study. Nephrol. Dial. Transplant. 2020;35:937–945. - PubMed
MeSH terms
LinkOut - more resources
Full Text Sources
Medical
Research Materials
Miscellaneous
