. 2023 May;93(6):1539-1545.
doi: 10.1038/s41390-022-02278-3. Epub 2022 Aug 30.

Venous waveform analysis detects acute right ventricular failure in a rat respiratory arrest model

Affiliations

Venous waveform analysis detects acute right ventricular failure in a rat respiratory arrest model

Ryan J Lefevre et al. Pediatr Res. 2023 May.

Abstract

Background: Peripheral intravenous analysis (PIVA) has been shown to be more sensitive than central venous pressure (CVP) for detecting hemorrhage and volume overload. We hypothesized that PIVA is superior to CVP for detecting right ventricular (RV) failure in a rat model of respiratory arrest.

Methods: Eight Wistar rats were studied in accordance with the ARRIVE guidelines. CVP, mean arterial pressure (MAP), and PIVA were recorded. Respiratory arrest was achieved with IV Rocuronium. PIVA utilizes Fourier transform to quantify the amplitude of the peripheral venous waveform, expressed as the "f1 amplitude". RV diameter was measured with transthoracic echocardiography.

Results: RV diameter increased from 0.34 to 0.54 cm during arrest, p = 0.001, and returned to 0.33 cm post arrest, p = 0.97. There was an increase in f1 amplitude from 0.07 to 0.38 mmHg, p = 0.01 and returned to 0.08 mmHg, p = 1.0. MAP decreased from 119 to 67 mmHg, p = 0.004 and returned to 136 mmHg, p = 0.50. There was no significant increase in CVP from 9.3 mmHg at baseline to 10.5 mmHg during respiratory arrest, p = 0.91, and recovery to 8.6 mmHg, p = 0.81.

Conclusions: This study highlights the utility of PIVA to detect RV failure in small-caliber vessels, comparable to peripheral veins in the human pediatric population.

Impact: Right ventricular failure remains a diagnostic challenge, particularly in pediatric patients with small vessel sizes limiting invasive intravascular monitor use. Intravenous analysis has shown promise in detecting hypovolemia and volume overload. Intravenous analysis successfully detects right ventricular failure in a rat respiratory arrest model. Intravenous analysis showed utility despite utilizing small peripheral venous access and therefore may be applicable to a pediatric population. Intravenous analysis may be helpful in differentiating various types of shock.


Conflict of interest statement

Conflict of interest: The authors certify that there is no conflict of interest with any financial organization regarding the material discussed in the manuscript.

Figures

Figure 1:
Figure 1:. Echocardiography confirms right ventricular dilation.
Representative apical 4-chamber image of end diastolic RV base diameter (red bar) shown at a normal diameter at baseline (A) and acute RV base dilation during respiratory arrest (B). Superimposed color flow doppler was used during systole shows no tricuspid regurgitation at baseline (C) and the presence of tricuspid regurgitation during respiratory arrest (D). Abbreviations: RV, right ventricle; RA, right atrium; LV, left ventricle; LA, left atrium.
Figure 2:
Figure 2:. Echocardiography confirms right ventricular dilation and ventricular septal shift.
Representative parasternal short axis images at end-diastole. Baseline (A) shows normal RV and LV size with normal ventricular septum. During respiratory arrest (B), RV dilation can be seen with a D-shaped LV with flattening of the ventricular septum (arrows). Abbreviations: RV, right ventricle; LV, left ventricle.
Figure 3:
Figure 3:. RV diameter changes with respiratory arrest.
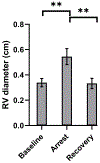
End-diastolic RV base diameter increased from a mean of 0.34 cm (SD=0.03) at baseline to 0.54 cm (SD=0.06) during respiratory arrest, p=0.001. Post arrest, RV diameter returned to near baseline values, 0.33 cm (SD=0.04), p=0.97 (vs baseline). ** indicates p<0.01. Abbreviation: RV, right ventricle.
Figure 4:
Figure 4:. Venous waveform changes during respiratory arrest.
Representative venous waveform shown at baseline (A) and during respiratory arrest (B). Corresponding changes in spectral analysis shown at baseline (HR 405 bpm=6.75Hz) (C) and during respiratory arrest (HR 120 bpm=2Hz) resulting in (D) a significant increase in f1 amplitude. This f1 peak represents a quantitative measure of the pulsatility in the venous waveform signal (red bars). The f0 peak on the baseline spectral analysis occurs at a frequency corresponding to the respiratory rate and is therefore not present on the respiratory arrest spectral analysis. Abbreviations: HR, heart rate; bpm, beats per minute.
Figure 5:
Figure 5:. Hemodynamic changes with respiratory arrest.
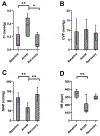
(A) PIVA f1 amplitude from a saphenous venous waveform increased from 0.07 mmHg (IQR=0.06 to 0.23) to 0.38 mmHg (IQR=0.21 to 0.49), p=0.01, during respiratory arrest. After recovery from respiratory arrest, the f1 amplitude returned to near baseline levels 0.08 mmHg (IQR=0.04 to 0.23), p= 1.0 (vs baseline). * indicates p<0.05, ** indicates p<0.01. (B) CVP did not change significantly from baseline 9.3 mmHg (SD=6.0) during arrest 10.5 mmHg (SD=4.8) nor after recovery from arrest 8.6 mmHg (SD=3.6), p=0.91 and 0.81, respectively. (C) MAP significantly decreased during respiratory arrest from 119 mmHg (SD=23) to 67 mmHg (SD=22), p=0.004, then recovered to near baseline values at 136 mmHg (SD=33), p=0.5 (vs baseline). ** indicates p<0.01. (D) HR decreased during respiratory arrest from 341 bpm (IQR=297 to 379) at baseline to 129 bpm (IQR=114 to 220), p=0.0004. Recovery HR at 285 bpm (IQR=275 to 318) was statistically indistinguishable from baseline, p=0.18. ** indicates p<0.01. Abbreviations: PIVA, peripheral intravenous waveform analysis; CVP, central venous pressure; MAP, mean arterial pressure; HR, heart rate; bpm, beats per minute.
Figure 6:
Figure 6:. Receiver Operator Characteristic Curve for detection of RV failure.
f1 and CVP ROC curves are displayed on the left, and MAP and HR ROC curves are displayed on the right, both compared to echo-assessed standard of RV diameter. f1 AUC 0.91 (SD=0.08) was significantly higher than that of CVP 0.57 (SD=0.15), p=0.04 but did not differ from MAP 0.95 (SD=0.05) or HR 0.92 (SD=0.08), p=0.57 and p=0.85, respectively. Both MAP and HR AUC were significantly higher than CVP, p=0.01 and p=0.02, respectively, but did not differ from each other, p=0.68. Abbreviations: AUC, area under the curve; CVP, central venous pressure; MAP, mean arterial pressure; HR, heart rate; RVd, right ventricular diameter; ROC, receiver operator characteristic.

Similar articles

Cited by

References

    1. Morray JP et al. Anesthesia-Related Cardiac Arrest in Children: Initial Findings of the Pediatric Perioperative Cardiac Arrest (Poca) Registry. Anesthesiology 93, 6–14 (2000). - PubMed
    1. McMahon CJ et al. Preterm Infants with Congenital Heart Disease and Bronchopulmonary Dysplasia: Postoperative Course and Outcome after Cardiac Surgery. Pediatrics 116, 423–430 (2005). - PubMed
    1. Cheung PY et al. Outcomes of Preterm Infants with Congenital Heart Defects after Early Surgery: Defining Risk Factors at Different Time Points During Hospitalization. Front Pediatr 8, 616659 (2020). - PMC - PubMed
    1. Altit G, Bhombal S, Feinstein J, Hopper RK & Tacy TA Diminished Right Ventricular Function at Diagnosis of Pulmonary Hypertension Is Associated with Mortality in Bronchopulmonary Dysplasia. Pulm Circ 9, 2045894019878598 (2019). - PMC - PubMed
    1. de Boer JM, Kuipers IM, Klitsie LM, Blom NA & Ten Harkel AD Decreased Biventricular Longitudinal Strain Shortly after Congenital Heart Defect Surgery. Echocardiography 34, 446–452 (2017). - PubMed

Publication types