. 2022 Aug 30;12(1):14725.
doi: 10.1038/s41598-022-19091-x.

Decreased NHE3 expression in colon cancer is associated with DNA damage, increased inflammation and tumor growth

Affiliations

Decreased NHE3 expression in colon cancer is associated with DNA damage, increased inflammation and tumor growth

Daniel Laubitz et al. Sci Rep. .

Abstract

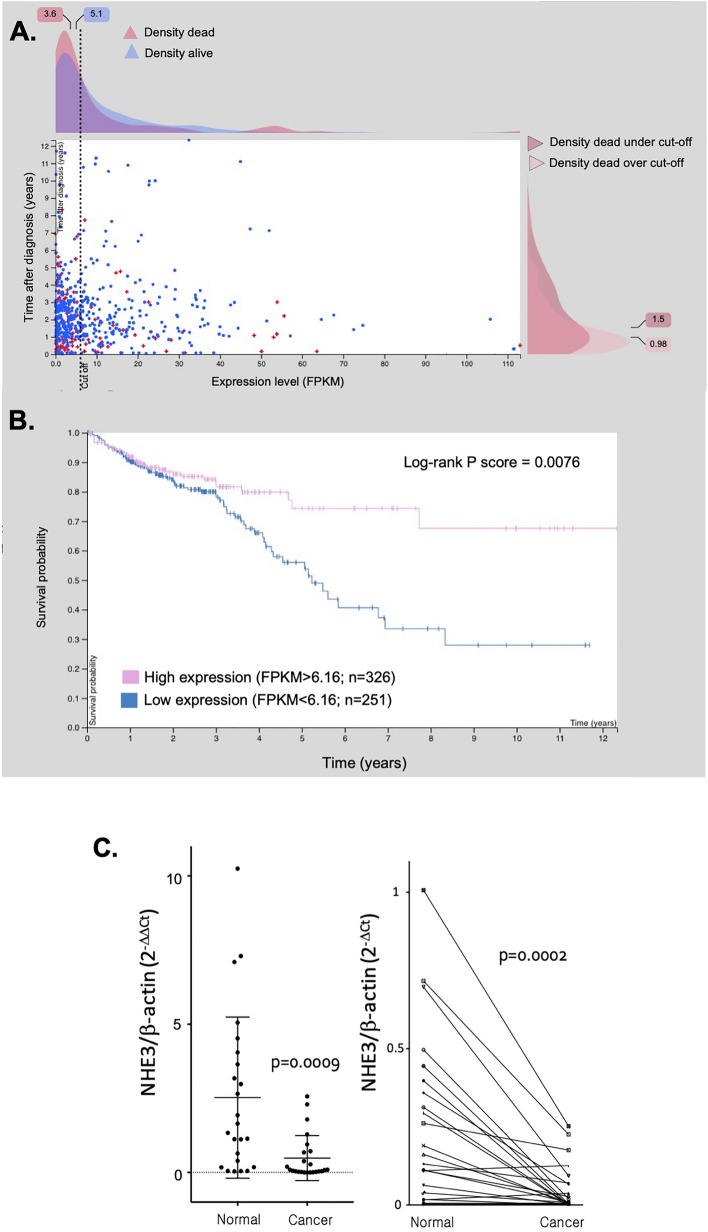
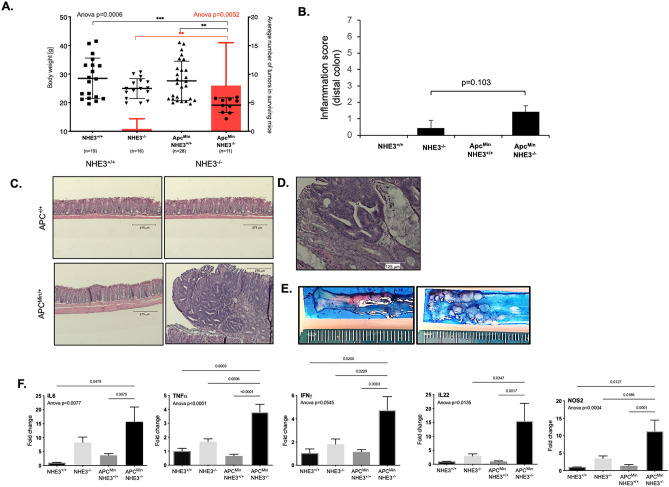
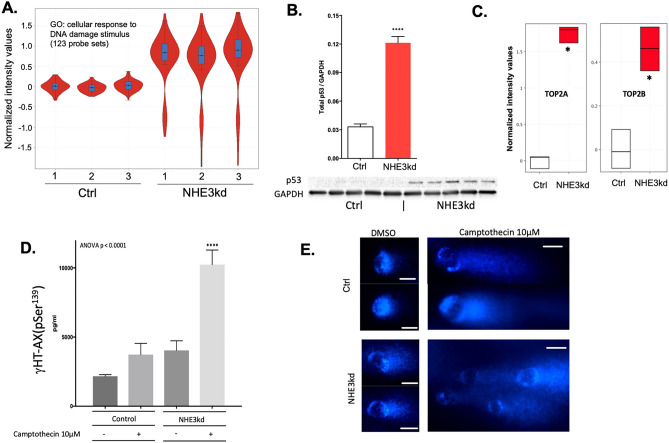
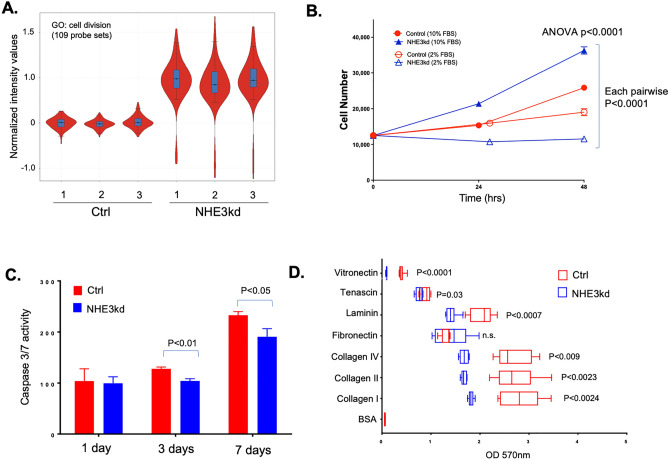
Dysregulation of intra- and extracellular pH in cancer contributes to extracellular matrix remodeling, favors cell migration, proliferation, and metastasis. Although the primary attention has been focused on the role of the ubiquitous Na+/H+ exchanger isoform NHE1, the role of NHE3, the predominant apical isoform in colonic surface epithelium in the pathogenesis of colon cancer has not been investigated. Here, we show that NHE3 mRNA expression is significantly reduced in colorectal cancer patients and that low NHE3 expression is associated with poorer survival. Deletion of NHE3 in ApcMin mice evaluated at 15 weeks of age (significant mortality was observed beyond this time) led to lower body weights, increased mucosal inflammation, increased colonic tumor numbers, evidence of enhanced DNA damage in tumor surface epithelium, and to significant alteration in the gut microbiota. In the absence of the inflammatory and microbial pressors, ca. 70% knockdown of NHE3 expression in SK-CO15 cells led to reduced intracellular pH, elevated apical pH, dramatic differences in their transcriptomic profile, increased susceptibility to DNA damage, increased proliferation, decreased apoptosis and reduced adhesion to extracellular matrix proteins. Our findings suggest that loss of NHE3 in the surface epithelium of colonic tumors has profound consequences for cancer progression and behavior.


Conflict of interest statement

The authors declare no competing interests.

Figures

Figure 1
Figure 1
NHE3 mRNA expression in human colorectal cancer patients. (A) The Survival Scatter plot shows the clinical status (i.e., dead or alive) for all individuals in the patient cohort, based on the same data that underlies the corresponding Kaplan–Meier plot in (B). Patients that are alive at last time for follow-up are shown in blue and patients who have died during the study are shown in red. The X-axis shows the expression levels (FPKM; Fragments Per Kilobase of transcript per Million mapped reads) of the SLC9A3/NHE3 gene in the tumor tissue at the time of diagnosis. The Y-axis shows the follow-up time after diagnosis (years). Both axes are complimented with kernel density curves demonstrating the data density over the axes. The top density plot shows the expression levels (FPKM) distribution among dead (red) and alive patients (blue). The right density plot shows the data density of the survived years of dead patients with high and low expression levels respectively, stratified using the cutoff indicated by the vertical dashed line. (B) Kaplan–Meier plot of survival of CRC patients stratified by SLC9A3/NHE3 mRNA expression into "low expressors" (under cut off) or "high expressors" (over cut off). X-axis shows time for survival (years) and Y-axis shows the probability of survival, where 1.0 corresponds to 100%. Cut-off value for (A) and (B) were automatically defined as 6.16 to minimize the p-score. Data in (A,B) from https://www.proteinatlas.org/ENSG00000066230-SLC9A3/pathology/colorectal+cancer. (C) Validation of SLC9A3/NHE3 mRNA expression in an independent cohort of CRC patients. qRT-PCR was used to analyze NHE3 and β-actin mRNA expression using RNA isolated from 24 matched colonic biopsy pairs (tumor and unaffected tissue margin; 48 samples). The results of unpaired (left panel) and paired (right panel) analysis of NHE3 mRNA expression is shown. (Student t-test, n = 24; p value indicated in graph; GraphPad Prism 9, https://www.graphpad.com/).
Figure 2
Figure 2
NHE3 expression decreases in human colorectal cancer and increased number of tumors in ApcMin/+NHE3−/− mice is associated with lower body weight and increased colonic expression of proinflammatory cytokines. (A) Body weights (left Y axis, black symbols) and average number of polyps in surviving mice (right Y axis, red bars). Black symbols represent individual mice with median value marked with bold line; whiskers depict standard deviation. Red boxplots represent the mean values and standard deviations for the number of tumors per mouse. Statistical significance (in black for body weight and in red for the average number of tumors) was calculated using one-way ANOVA followed by Holm-Sidak’s multiple comparison test. (B) Bar graph summary of histological colitis scoring (reported p-value from Mann–Whitney test). (C) Representative H&E images of the distal colonic mucosa in the four genotypes. (D). High magnification representative image of tumor histology in ApcMin/+NHE3−/− mice. (E) Representative image of methylene blue-stained distal colon with healthy mucosa in ApcMin/+NHE3+/+ mice and multiple adenomas in ApcMin/+NHE3−/− mice. (F) Cytokine expression profile in the distal colon measured by qRT-PCR relative to GAPDH as a housekeeping gene. Statistical differences analyzed with one-way ANOVA followed by Tukey multiple comparison test.
Figure 3
Figure 3
Tumor surface epithelia in ApcMin/+NHE3−/− mice show increased level of NOS2, activation of STAT3, and DNA damage. (A) Representative immunofluorescence (IF) staining for NOS2 and pSTAT3 (both in red), with blue DAPI nuclear counterstaining in all four genotypes. The white scale bars represent 200 μm. High magnification images of NOS2 and pSTAT3 IF from ApcMin/+NHE3−/− mice are in the rightmost two panels. (B) DNA damage (double stranded DNA breaks) was evaluated by immunofluorescent staining for phosphorylated histone H2AX (γ-H2AX). Tissue specimens were stained for γ-H2AX (red), E-cadherin (green), and nuclei were counterstained with DAPI (blue). The scale bars represent 100 mm or 20 mm for the higher magnification insert.
Figure 4
Figure 4
NHE3 deficiency leads to microbial dysbiosis and correlates with severity of inflammation and tumor number. Non-metric Multidimensional Scaling (NMDS) analysis based on Bray–Curtis distances (A,B), and richness (a-diversity measure; C,D) were used to analyze the groups in the context of genotype, inflammation score, and tumor number. In all panels, dots represent samples from individual mice. The size of the dots corresponds to the inflammation score (A) or to the tumor multiplicity (BD). Polygons connect points within the same cluster representing individual genotypes (A,B). In the bar plots (C,D) the lower and upper hinges represent the first and third quartiles respectively. The whiskers extend to the largest and lowest values. The middle line represents the median value. Permutational Multivariate Analysis of Variance Using Distance Matrices (Adonis test, A,B) or Kruskal–Wallis H test followed by Wilcoxon rank sum test with continuity correction (panels C,D) were used. Bonferroni p value adjustment method was used. (E) The impact of APC status on fecal microbial composition in NHE3−/− mice was analyzed using DESeq2, differential abundance analysis tool. Each dot represents an individual ASV. The color of the dots represents a specific phylum (yellow—Bacteroidetes, dark green—Firmicutes, bright green Tenericutes). For this presentation, only significantly different taxa (Wald significance test < 0.05) with at least twofold change (absolute value of log2FoldChange > 1) were selected. (F). Relative abundance of Faecalibaculum spp. in fecal samples in all analyzed genotypes. Dots represent individual samples/mice, lower and upper hinges of the bars represent the first and third quartiles respectively. The whiskers extend to the largest and lowest values. The middle line represents the median value. Statistical differences were analyzed using Kruskal–Wallis H test followed by Wilcoxon rank sum test with continuity correction. (G) Heatmap of Spearman’s correlation between relative abundances of fecal microbial general (for the core gut genera, which summarized relative abundance across all samples for individual genus as higher than 50%). The circle size reflects the absolute value of corresponding correlation coefficient. Red and blue color represent positive and negative correlation respectively. Darker color represents stronger correlations. The green triangle highlights potentially beneficial bacteria negatively correlated with proinflammatory cytokines and potential pathobionts. The red triangle highlights genera positively correlated with inflammation indices. The heatmap was generated with corplot R package (ver 0.92; https://github.com/taiyun/corrplot).
Figure 5
Figure 5
The effects of NHE3 knockdown in SK-CO15 colonic adenocarcinoma cells on cellular pH and gene expression profile. (A) Representative Western blot of NHE3 protein expression in control (Ctrl) or NHE3-knockdown cells (NHE3kd) stably transduced with lentivirus with scrambled or NHE3-specific shRNA. Full blot shown in Supplementary Fig. S7. (B) Decreased resting intracellular pH (pHi) in NHE3kd cells (Student t-test, ****p < 0.0001). (C) Increased extracellular apical pH (pHe) in NHE3kd cells grown as monolayers in Transwells (Student t-test, **p < 0.01). Differences in global gene expression profile of Ctrl and NHE3kd cells determined by microarray analysis: (D) Principal component analysis of samples without filtering; (E) heat map of differentially expressed 48,144 transcripts; (F) Volcano plot of differentially expressed genes in Ctrl vs. NHE3kd cells. (DF) generated by GeneSpring GX software (https://www.agilent.com/en/product/software-informatics/genomics-software-informatics/gene-expression/genespring-gx).
Figure 6
Figure 6
NHE3 knockdown in SK-CO15 colonic adenocarcinoma cells leads to enhanced susceptibility to DNA damage. (A) Gene set enrichment analysis (GSEA) of transcripts encoding genes from gene ontology category of cellular response to DNA damage stimulus. (B) Increased expression of wild-type p53 protein in NHE3kd SK-CO15 cells (Student t-test, ****p < 0.0001). (C) Increased expression of topoisomerase 2 isoforms in NHE3kd SK-CO15 cells (moderated T-test, *adj. p < 0.05). (D) ELISA analysis if γHT-AX histone in the lysates of Ctrl and NHE3kd SK-CO15 cells treated with and without 10 mM camptothecin. The results of ANOVA (p < 0.0001) are indicated. Asterisks depict a statistical difference between camptothecin-treated NHE3kd cells as compared to all other cells/treatments (Post hoc Fisher PLSD test; ****p < 0.0001). (E) High magnification of comet assay for cells and treatment as in (D). Lower magnification provided in Supplementary Fig. S5. White scale bars indicate 10 µm.
Figure 7
Figure 7
NHE3 knockdown in SK-CO15 colonic adenocarcinoma cells leads to increased proliferation, decreased apoptosis and decreased extracellular matrix (ECM) adhesion. (A) Gene set enrichment analysis (GSEA) of transcripts encoding genes from gene ontology category of cell division. (B) proliferation of Ctrl (red) and NHE3kd (blue) cells cultured with 2% (open symbols) or 10% (filled symbols) fetal bovine serum (FBS) in the media over 48-h period. The result of ANOVA test is indicated. In pairwise Fisher PLSD post-hoc analysis, all pairs of were significantly different at 48 h (p < 0.0001). (C) Caspase 3/7 activity assay as a measure of baseline apoptosis rate in Ctrl (red) and NHE3kd (blue) cells. (D) Differences in adhesion of Ctrl (red) and NHE3kd (blue) cells to an array of extracellular matrix proteins. P values indicate the result of unpaired T-test for each ECM protein, respectively.

Similar articles

Cited by

References

    1. Webb BA, Chimenti M, Jacobson MP, Barber DL. Dysregulated pH: A perfect storm for cancer progression. Nat. Rev. Cancer. 2011;11:671–677. doi: 10.1038/nrc3110. - DOI - PubMed
    1. Hu Y, et al. Advances in research on the regulatory mechanism of NHE1 in tumors. Oncol. Lett. 2021;21:273. doi: 10.3892/ol.2021.12534. - DOI - PMC - PubMed
    1. Stock C, Pedersen SF. Roles of pH and the Na(+)/H(+) exchanger NHE1 in cancer: From cell biology and animal models to an emerging translational perspective? Semin. Cancer Biol. 2017;43:5–16. doi: 10.1016/j.semcancer.2016.12.001. - DOI - PubMed
    1. Reshkin SJ, et al. Paclitaxel induces apoptosis via protein kinase A- and p38 mitogen-activated protein-dependent inhibition of the Na+/H+ exchanger (NHE) NHE isoform 1 in human breast cancer cells. Clin. Cancer Res. 2003;9:2366–2373. - PubMed
    1. Lauritzen G, et al. NBCn1 and NHE1 expression and activity in DeltaNErbB2 receptor-expressing MCF-7 breast cancer cells: Contributions to pHi regulation and chemotherapy resistance. Exp. Cell Res. 2010;316:2538–2553. doi: 10.1016/j.yexcr.2010.06.005. - DOI - PubMed

Publication types