TTYH family members form tetrameric complexes at the cell membrane
- PMID: 36042377
- PMCID: PMC9427776
- DOI: 10.1038/s42003-022-03862-3
TTYH family members form tetrameric complexes at the cell membrane
Abstract
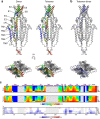
The conserved Tweety homolog (TTYH) family consists of three paralogs in vertebrates, displaying a ubiquitous expression pattern. Although considered as ion channels for almost two decades, recent structural and functional analyses refuted this role. Intriguingly, while all paralogs shared a dimeric stoichiometry following detergent solubilization, their structures revealed divergence in their relative subunit orientation. Here, we determined the stoichiometry of intact mouse TTYH (mTTYH) complexes in cells. Using cross-linking and single-molecule fluorescence microscopy, we demonstrate that mTTYH1 and mTTYH3 form tetramers at the plasma membrane, stabilized by interactions between their extracellular domains. Using blue-native PAGE, fluorescence-detection size-exclusion chromatography, and hydrogen/deuterium exchange mass spectrometry (HDX-MS), we reveal that detergent solubilization results in tetramers destabilization, leading to their dissolution into dimers. Moreover, HDX-MS demonstrates that the extracellular domains are stabilized in the context of the tetrameric mTTYH complex. Together, our results expose the innate tetrameric organization of TTYH complexes at the cell membrane. Future structural analyses of these assemblies in native membranes are required to illuminate their long-sought cellular function.
© 2022. The Author(s).
Conflict of interest statement
The authors declare no competing interests.
Figures


Similar articles
-
Hydrogen/Deuterium Exchange Mass Spectrometry for the Structural Analysis of Detergent-Solubilized Membrane Proteins.Methods Mol Biol. 2020;2127:339-358. doi: 10.1007/978-1-0716-0373-4_22. Methods Mol Biol. 2020. PMID: 32112332
-
Probing the conformational impact of detergents on the integral membrane protein LeuT by global HDX-MS.J Proteomics. 2020 Aug 15;225:103845. doi: 10.1016/j.jprot.2020.103845. Epub 2020 May 30. J Proteomics. 2020. PMID: 32480080
-
Hydrogen-Deuterium Exchange Mass Spectrometry with Integrated Size-Exclusion Chromatography for Analysis of Complex Protein Samples.Anal Chem. 2021 Aug 24;93(33):11406-11414. doi: 10.1021/acs.analchem.1c01171. Epub 2021 Aug 13. Anal Chem. 2021. PMID: 34387074
-
Advances in Hydrogen/Deuterium Exchange Mass Spectrometry and the Pursuit of Challenging Biological Systems.Chem Rev. 2022 Apr 27;122(8):7562-7623. doi: 10.1021/acs.chemrev.1c00279. Epub 2021 Sep 7. Chem Rev. 2022. PMID: 34493042 Free PMC article. Review.
-
Structural predictions of the functions of membrane proteins from HDX-MS.Biochem Soc Trans. 2020 Jun 30;48(3):971-979. doi: 10.1042/BST20190880. Biochem Soc Trans. 2020. PMID: 32597490 Free PMC article. Review.
Cited by
-
Interactions between TTYH2 and APOE facilitate endosomal lipid transfer.Nature. 2025 Aug;644(8075):273-279. doi: 10.1038/s41586-025-09200-x. Epub 2025 Jun 25. Nature. 2025. PMID: 40562935 Free PMC article.
-
To Be or Not to Be an Ion Channel: Cryo-EM Structures Have a Say.Cells. 2023 Jul 17;12(14):1870. doi: 10.3390/cells12141870. Cells. 2023. PMID: 37508534 Free PMC article. Review.
-
Prominin 1 and Tweety Homology 1 both induce extracellular vesicle formation.Elife. 2024 Aug 13;13:e100061. doi: 10.7554/eLife.100061. Elife. 2024. PMID: 39136554 Free PMC article.
-
Emerging roles of prominin-1 (CD133) in the dynamics of plasma membrane architecture and cell signaling pathways in health and disease.Cell Mol Biol Lett. 2024 Mar 26;29(1):41. doi: 10.1186/s11658-024-00554-0. Cell Mol Biol Lett. 2024. PMID: 38532366 Free PMC article. Review.
-
Prominin 1 and Tweety Homology 1 both induce extracellular vesicle formation.bioRxiv [Preprint]. 2024 May 23:2023.11.08.566258. doi: 10.1101/2023.11.08.566258. bioRxiv. 2024. Update in: Elife. 2024 Aug 13;13:e100061. doi: 10.7554/eLife.100061. PMID: 37986829 Free PMC article. Updated. Preprint.
References
-
- Campbell HD, et al. The Drosophila melanogaster flightless-I gene involved in gastrulation and muscle degeneration encodes gelsolin-like and leucine-rich repeat domains and is conserved in Caenorhabditis elegans and humans. Proc. Natl Acad. Sci. USA. 1993;90:11386–11390. doi: 10.1073/pnas.90.23.11386. - DOI - PMC - PubMed
Publication types
MeSH terms
Substances
LinkOut - more resources
Full Text Sources
Molecular Biology Databases

