. 2022 Aug 30;23(1):624.
doi: 10.1186/s12864-022-08803-2.

Crowdsourced benchmarking of taxonomic metagenome profilers: lessons learned from the sbv IMPROVER Microbiomics challenge

Affiliations

Crowdsourced benchmarking of taxonomic metagenome profilers: lessons learned from the sbv IMPROVER Microbiomics challenge

Carine Poussin et al. BMC Genomics. .

Abstract

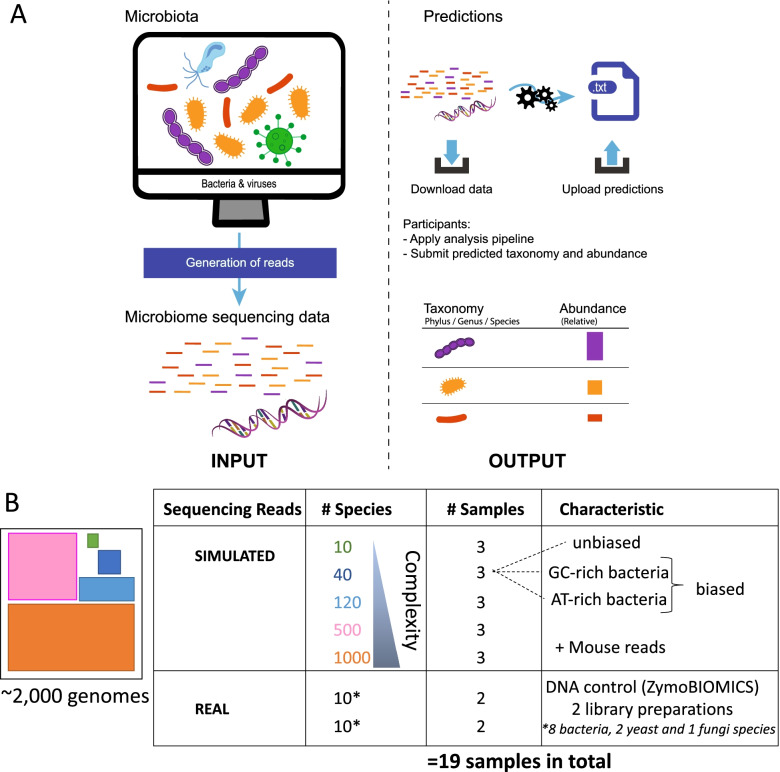
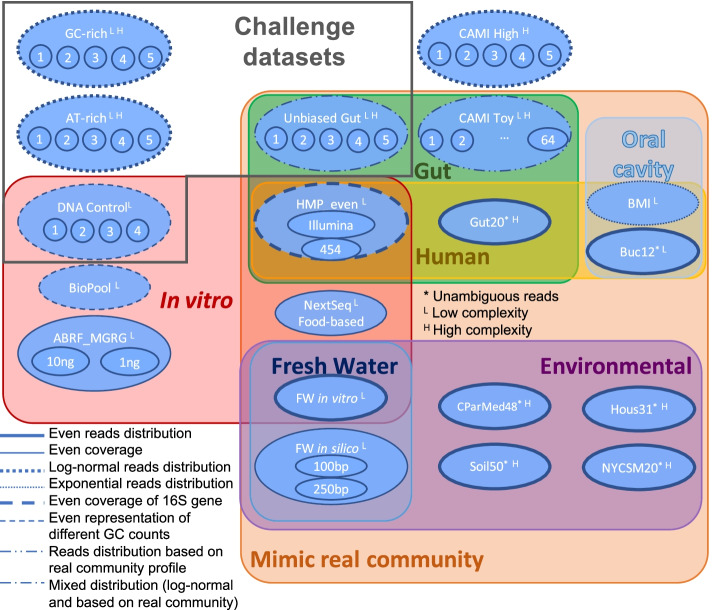
Background: Selection of optimal computational strategies for analyzing metagenomics data is a decisive step in determining the microbial composition of a sample, and this procedure is complex because of the numerous tools currently available. The aim of this research was to summarize the results of crowdsourced sbv IMPROVER Microbiomics Challenge designed to evaluate the performance of off-the-shelf metagenomics software as well as to investigate the robustness of these results by the extended post-challenge analysis. In total 21 off-the-shelf taxonomic metagenome profiling pipelines were benchmarked for their capacity to identify the microbiome composition at various taxon levels across 104 shotgun metagenomics datasets of bacterial genomes (representative of various microbiome samples) from public databases. Performance was determined by comparing predicted taxonomy profiles with the gold standard.

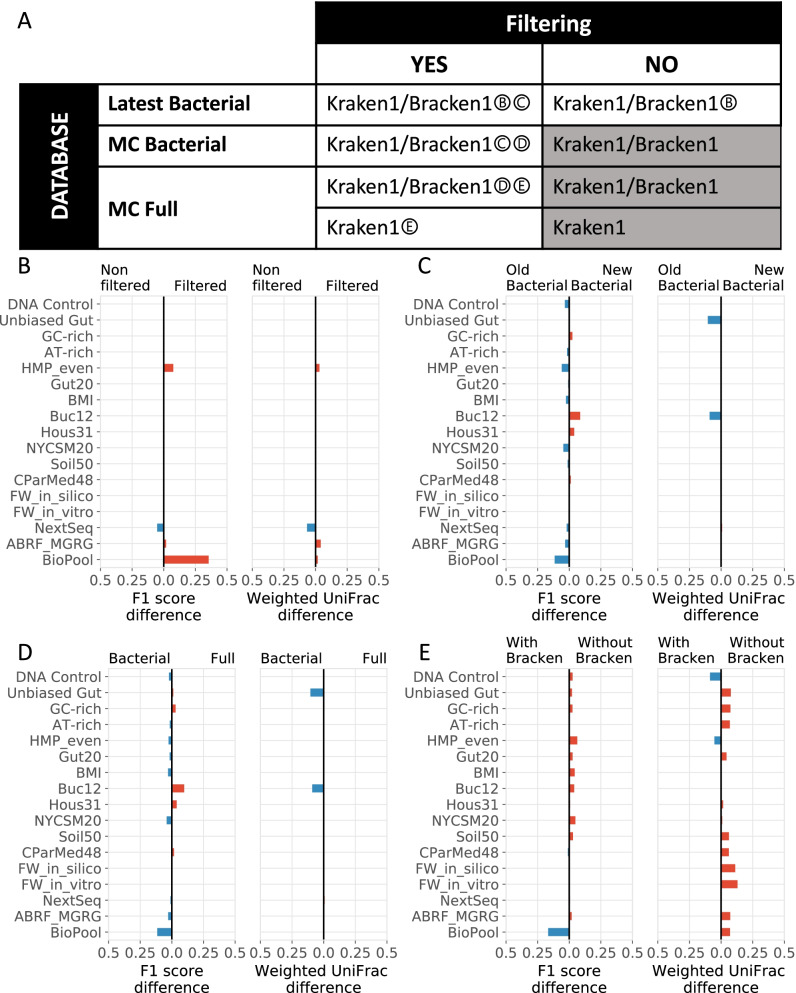
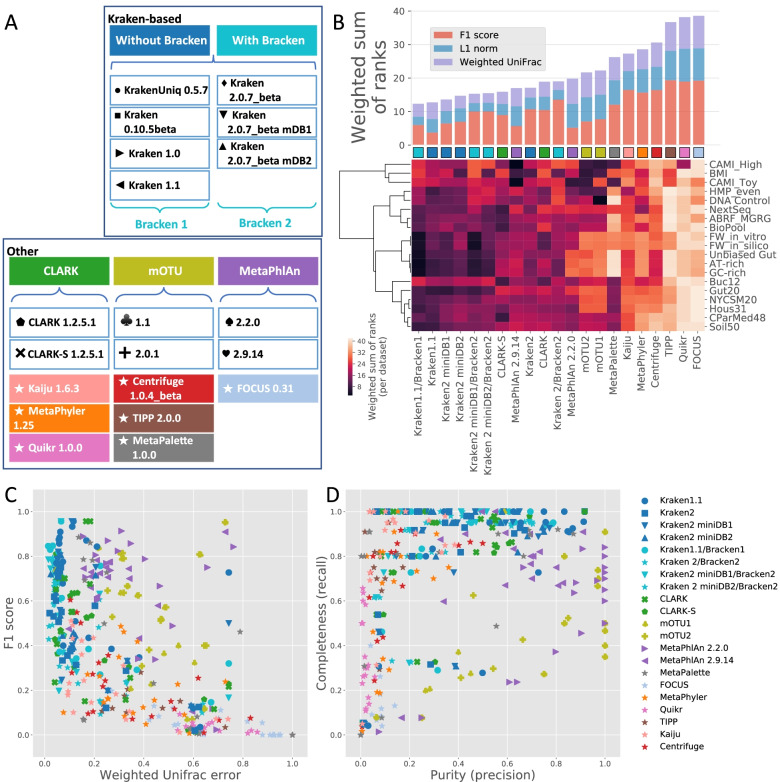
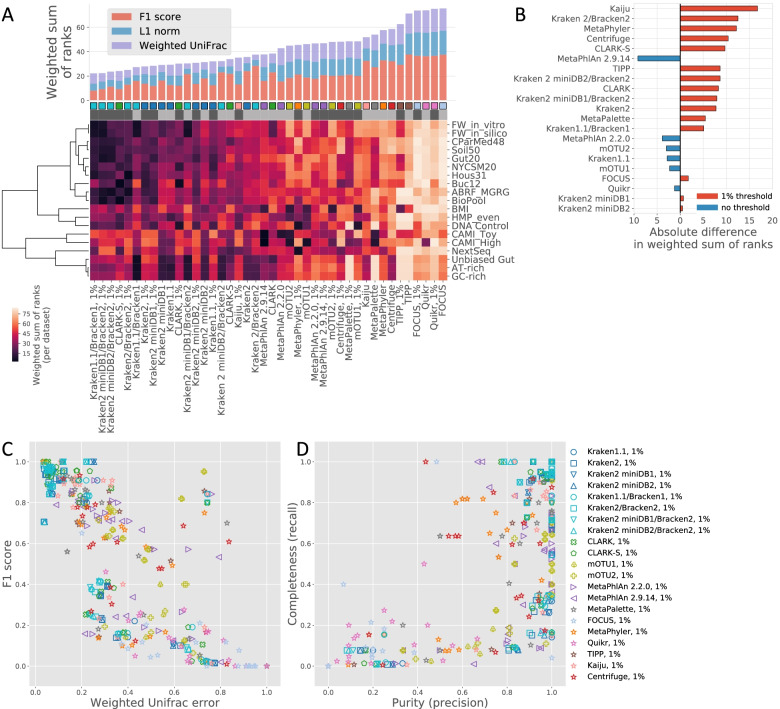
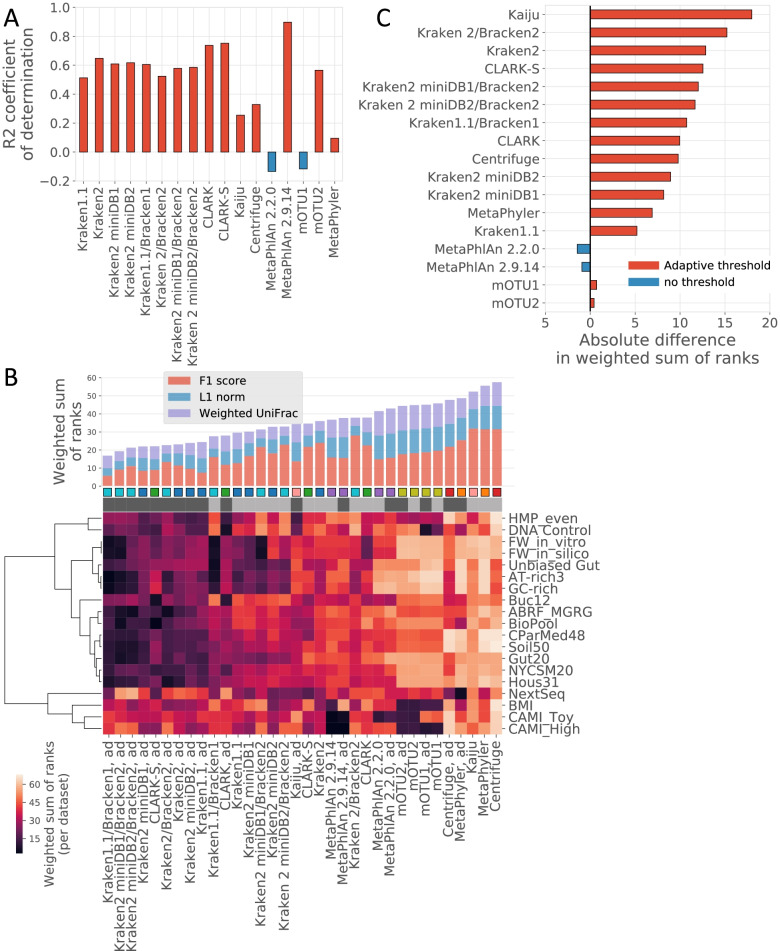
Results: Most taxonomic profilers performed homogeneously well at the phylum level but generated intermediate and heterogeneous scores at the genus and species levels, respectively. kmer-based pipelines using Kraken with and without Bracken or using CLARK-S performed best overall, but they exhibited lower precision than the two marker-gene-based methods MetaPhlAn and mOTU. Filtering out the 1% least abundance species-which were not reliably predicted-helped increase the performance of most profilers by increasing precision but at the cost of recall. However, the use of adaptive filtering thresholds determined from the sample's Shannon index increased the performance of most kmer-based profilers while mitigating the tradeoff between precision and recall.

Conclusions: kmer-based metagenomic pipelines using Kraken/Bracken or CLARK-S performed most robustly across a large variety of microbiome datasets. Removing non-reliably predicted low-abundance species by using diversity-dependent adaptive filtering thresholds further enhanced the performance of these tools. This work demonstrates the applicability of computational pipelines for accurately determining taxonomic profiles in clinical and environmental contexts and exemplifies the power of crowdsourcing for unbiased evaluation.

Keywords: Bacterial communities; Computational method benchmarking; Crowdsourcing; Metagenomics; Microbiome; Sbv IMPROVER; Taxonomic profiling.


Conflict of interest statement

All authors except V.K.N., F.M., V.K., V.C., U.M., S.K., and A.C.M. are employees of Philip Morris International. S. B and V.B. were employees of Philip Morris International at the time the work was performed. V.K.N., V.K., V.C., U.M., and S.K. are employees of Corteva Agrisciences.

Figures

Fig. 1
Fig. 1
Overview of the objective and dataset of the Microbiomics Challenge. Schematic description of the challenge (A). Participants were provided simulated metagenomics datasets representative of samples with increasing bacterial composition complexities and biases and including mouse host-read contamination. Real metagenomics datasets were generated from the sequencing of two independent libraries prepared from the commercially available ZymoBIOMICS DNA standard extracted from a known mixture of microorganisms, including eight bacterial species and two yeasts (B)
Fig. 2
Fig. 2
Final team ranking in the sbv IMPROVER Microbiomics Challenge. Bar plot of the weighted sum of ranks (wsr) sorted from the lowest (best) to the highest (worst) wsr. A heatmap shows the wsr stratified by metrics (wU, weighted UniFrac; F1, F1 score; L1, L1 norm), taxonomic levels (Ph, phylum; Ge, genus; Sp, species), complexity (C; Standard corresponds to the real ZymoBIOMICS DNA standard), and sequence bias status (Un, unbiased sample; AT or GC, AT/GC-rich biased samples)
Fig. 3
Fig. 3
Overview of the shotgun metagenomics datasets used for the challenge and extended benchmarking analysis. A total of 104 real and simulated metagenomics shotgun datasets grouped into 19 categories (surrounded by ovals) representative of microbiome samples from various environmental settings and mammalian organs were generated for the challenge or selected from previous studies for the extended benchmarking analysis. The characteristics of the simulated datasets are indicated in the legend. The line of the oval represents the mixing model used for creating each benchmarking dataset in the group. Dataset properties are shown by the background color shading. Datasets with Shannon index values below and above a threshold value of 3 were considered as having low (L) and high (H) complexity, respectively
Fig. 4
Fig. 4
Impact of various parameters on the performance of Kraken. Schematic representation of the sets of factor combinations for investigating their impact on the performance of the Kraken tool, which was used in the three best-performing pipelines. Combinations shaded in grey were not investigated (A). The impact of quality control read filtering (B), database version (C), database completeness (D), and count estimate by using Bracken (E) were evaluated. The absolute difference in F1 scores or weighted UniFrac scores between two options (option 1 on the left and option 2 on the right side for each diverging bar chart) were calculated for each dataset for the factors investigated. The color of the bars illustrates whether the option 1 (blue) or option 2 (red) had a larger score
Fig. 5
Fig. 5
Extended benchmarking analysis of metagenomics taxonomy profiler pipelines across various datasets. Collection of benchmarked taxonomic profilers (A). Bar plot showing the weighted sum of ranks (wsr) of scores calculated by using three metrics: F1 score, L1 norm, and weighted UniFrac. Colors in the bars highlight the contribution of each metric to the final wsr. Taxonomic profiling pipelines are sorted from the lowest (best) to the highest (worst) wsr. The heatmap represents the wsr obtained for each taxonomic profiler per group of benchmarking datasets (B). Scatter plots of weighted UniFrac scores versus F1 scores (C) or purity (precision) versus completeness (recall) (D) for each benchmarked taxonomic profiler and dataset group. Each dot corresponds to the mean of scores obtained for a group of sample datasets. The color and shape of each dot are associated with a taxonomic profiler pipeline
Fig. 6
Fig. 6
Impact of 1% filtering threshold for predicted lowest-abundance species on the performance of benchmarked profilers. Bar plot showing weighted sum of ranks (wsr) of scores without and with filtering out of the 1% least abundant species. Colors in the bars highlight the contribution of each metric to the final wsr. Taxonomic profiling pipelines are sorted from the lowest (best) to the highest (worst) wsr. The heatmap represents the wsr obtained with and without filtering out of the 1% least abundant species for each taxonomic profiler per group of benchmarking datasets (A). Bar plot showing the difference in wsr obtained with and without filtering out of the 1% least abundant species. The color and orientation of the bars illustrate the directionality of the difference (B). Scatter plots of weighted UniFrac scores versus F1 scores (C) or purity (precision) versus completeness (recall) (D) for each benchmarked taxonomic profiler and dataset group. Each dot corresponds to the mean of scores obtained for a group of sample datasets. The color and shape of each dot are associated with a taxonomic profiler pipeline
Fig. 7
Fig. 7
Impact of filtering out predicted low-abundance taxa using context-dependent adaptive thresholds on taxonomic profilers’ performance. The correlation between Shannon indices calculated from benchmarking datasets, gold standards, and the outputs of each tool (A). Bar plot showing the wsr of scores calculated by using three metrics (F1 score, L1 norm, and weighted UniFrac) without and with filtering out of low-abundance species by using context-dependent adaptive thresholds. Colors in the bars highlight the contribution of each metric to the final wsr. Taxonomic profiling pipelines are sorted from the lowest (best) to the highest (worst) wsr. The heatmap represents the wsr obtained without and with filtering out of low-abundance species by using context-dependent adaptive thresholds for each taxonomic profiler per group of benchmarking datasets (B). Bar plot showing the difference in wsr obtained without and with filtering out of low-abundance species by using context-dependent adaptive thresholds. The color and orientation of the bar illustrate the directionality of the difference (C)

Similar articles

Cited by

References

    1. Scotti E, Boué S, Lo Sasso G, Zanetti F, Belcastro V, Poussin C, et al. Exploring the microbiome in health and disease: implications for toxicology. Toxicol Res Appl. 2017;1:2397847317741884.
    1. Koppel N, Maini Rekdal V, Balskus EP. Chemical transformation of xenobiotics by the human gut microbiota. Science. 2017;356(6344):eaag2770. doi: 10.1126/science.aag2770. - DOI - PMC - PubMed
    1. Lloyd-Price J, Abu-Ali G, Huttenhower C. The healthy human microbiome. Genome Med. 2016;8(1):51. doi: 10.1186/s13073-016-0307-y. - DOI - PMC - PubMed
    1. Mimee M, Citorik RJ, Lu TK. Microbiome therapeutics - advances and challenges. Adv Drug Deliv Rev. 2016;105(Pt A):44–54. doi: 10.1016/j.addr.2016.04.032. - DOI - PMC - PubMed
    1. Young VB. The role of the microbiome in human health and disease: an introduction for clinicians. BMJ. 2017;356:j831. doi: 10.1136/bmj.j831. - DOI - PubMed

LinkOut - more resources