

Bedside Lung Ultrasound as an Independent Tool to Diagnose Pneumonia in Comparison to Chest X-ray: An Observational Prospective Study from Intensive Care Units
- PMID: 36042763
- PMCID: PMC9363808
- DOI: 10.5005/jp-journals-10071-24283
Bedside Lung Ultrasound as an Independent Tool to Diagnose Pneumonia in Comparison to Chest X-ray: An Observational Prospective Study from Intensive Care Units
Abstract
Background: Diagnosing pneumonia is challenging because of multiple differential diagnosis. Bedside lung ultrasound (BLUS) is a safe, portable, rapid and inexpensive new modality to diagnose pneumonia. This study was aimed to evaluate the sensitivity of BLUS vs chest X-ray (CXR) to diagnose community-acquired pneumonia (CAP) using computed tomography (CT) scans as the gold standard.
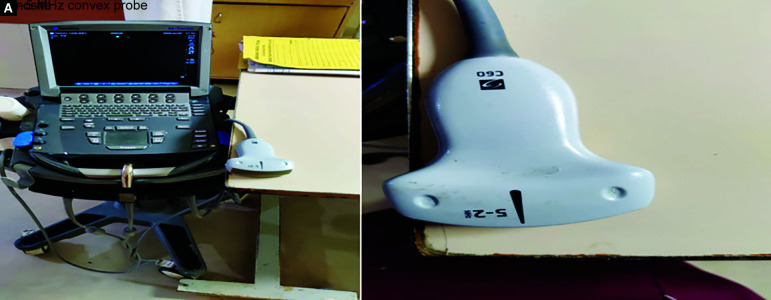
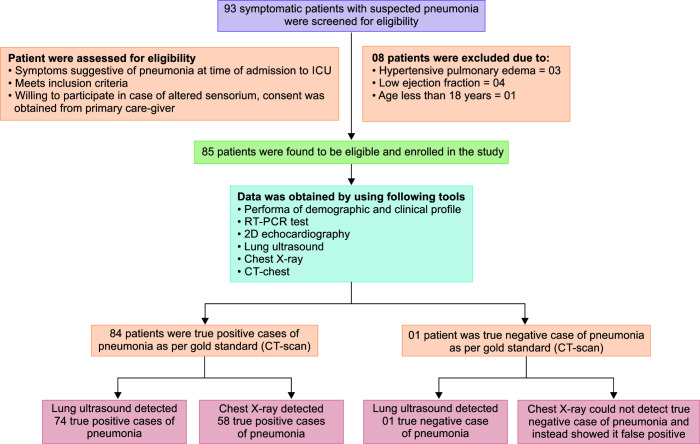
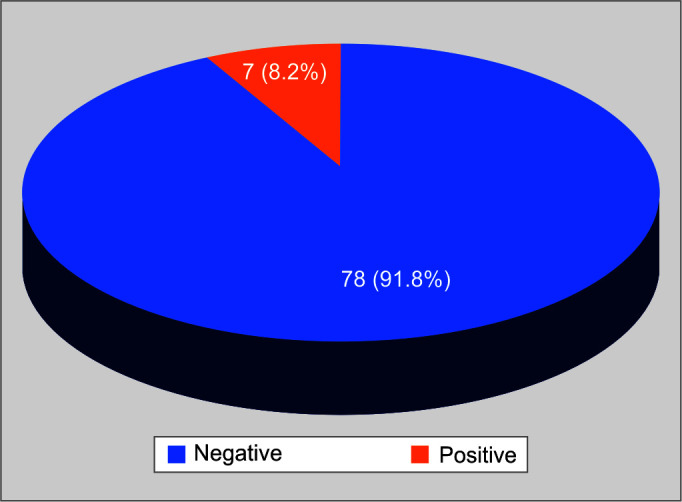
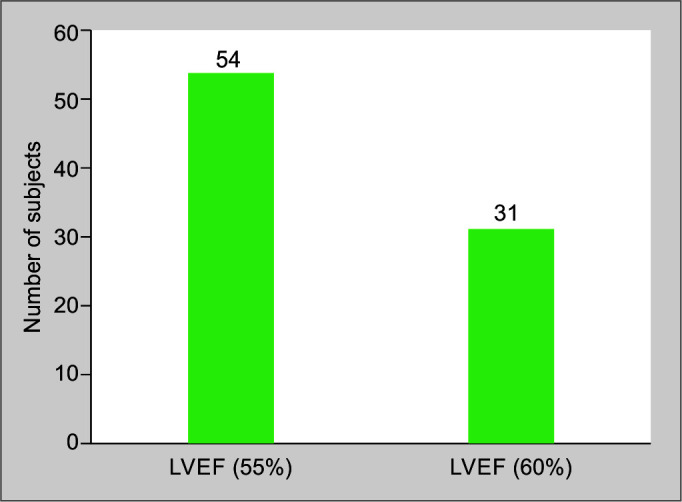
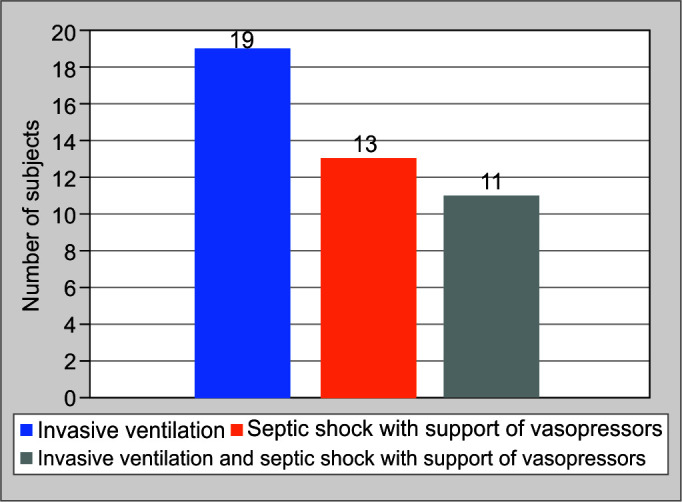
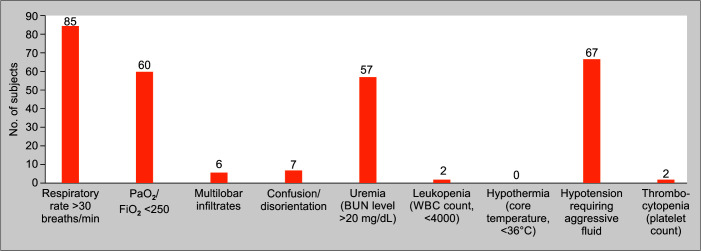
Patients and methods: An observational cross-sectional study was conducted in selected intensive care units (ICUs). Eligible 85 adult patients with symptoms suggestive of pneumonia as per 2007 Infectious Disease Society of America (IDSA), American Thoracic Society (ATS) criteria, and 2D echocardiography were enrolled consecutively by using convenient sampling technique. Real-time reverse transcription-polymerase chain reaction (RT-PCR) assay for SARS-associated coronavirus was sent with in 1 hour followed by BLUS and CXR within 24 hours of ICU admission. The final confirmation of CAP was done by a thoracic CT scan.
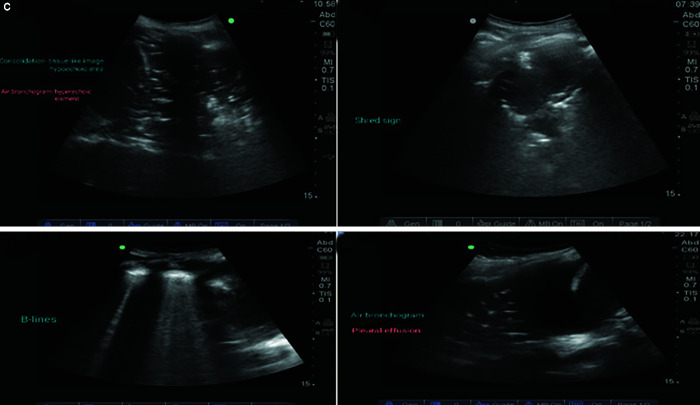
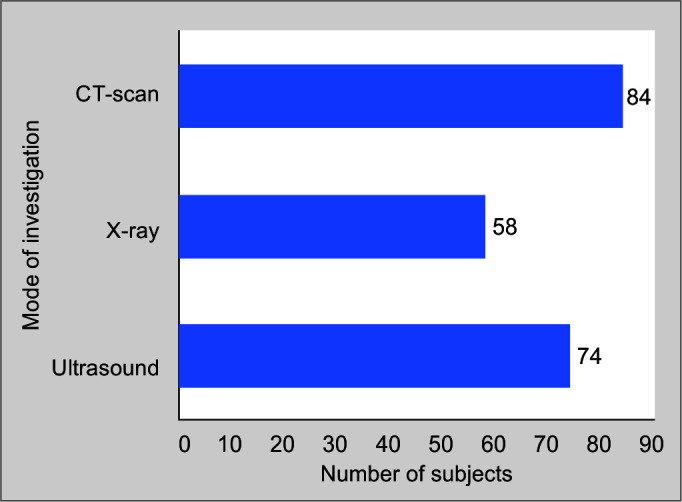
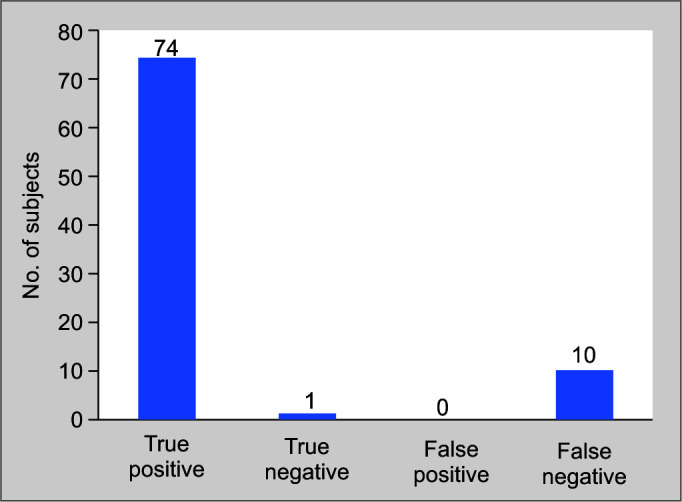
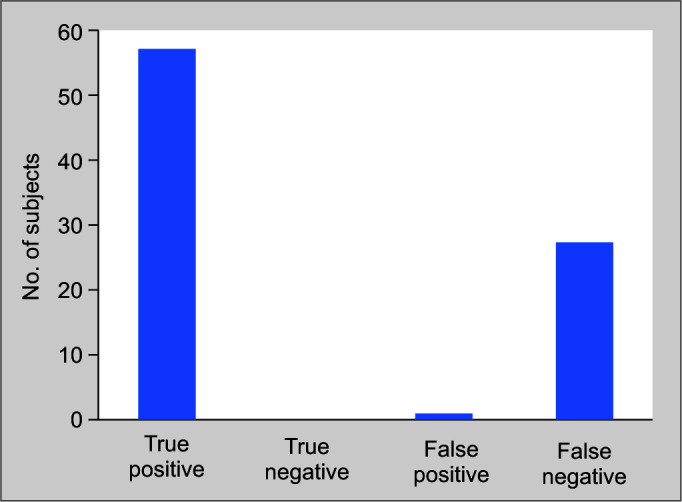
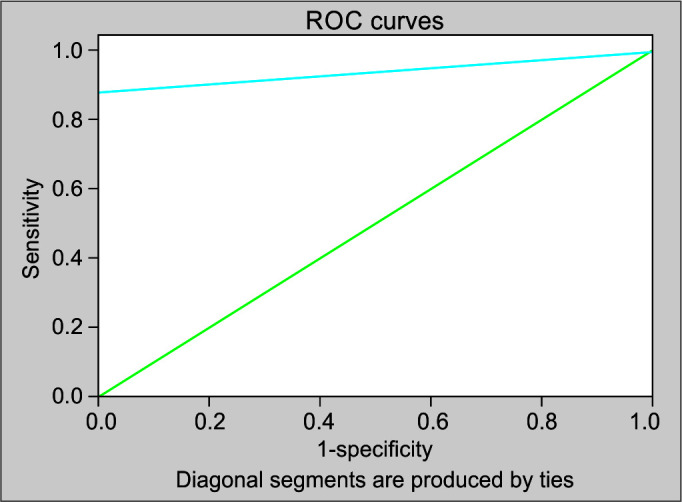
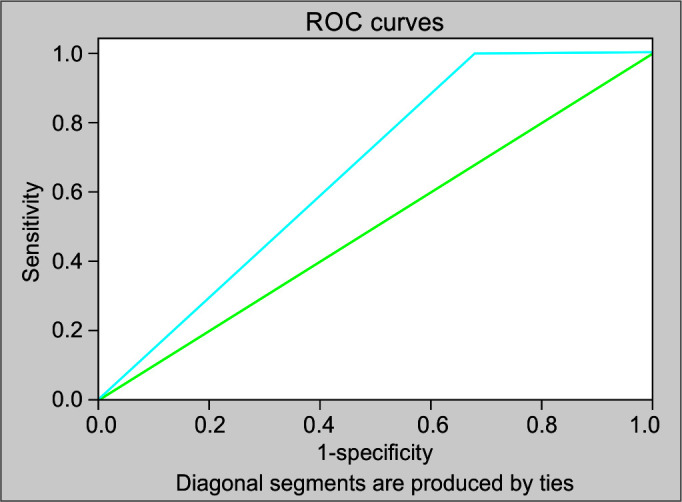
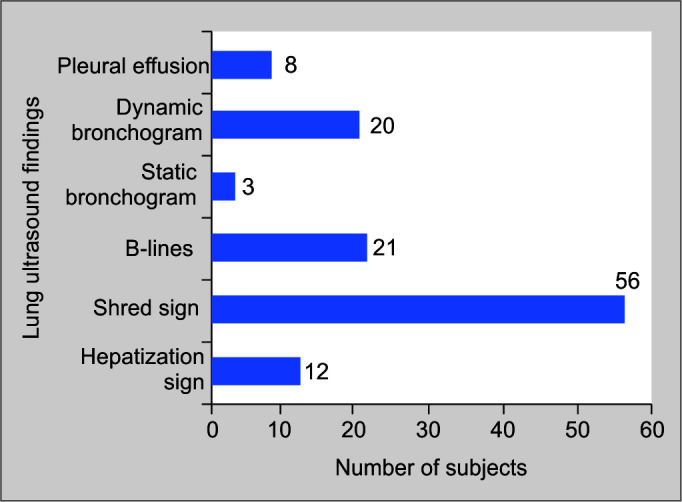
Results: Bedside lung ultrasound vs CXR could detect 74 vs 58 cases out of 84 confirmed cases. Sensitivity and specificity of BLUS vs CXR was 88.1% vs 67.8% and 100% vs 0%, respectively. Moreover, LR+ and LR- for BLUS was found to be 0 and 0.12 in comparison to 0.68 and 0 for CXR. The area under receiver operator characteristics (ROC) curve for BLUS vs CXR was 0.94 (95% CI 0.0-1.0) with p = 0.13 and 0.66 (95% CI 0.12-1.0) with p = 0.58. There was a significant agreement between diagnostic accuracy of BLUS and CT scan [kappa value (κ) = 0.14, p = 0.009], whereas CXR could not establish its diagnostic efficiency (κ = -0.023, p = 0.493). Sonographic features of pneumonia were B-lines, shred, and hepatization signs.
Conclusion: It is observed that BLUS showed higher sensitivity, specificity, and diagnostic accuracy as compared to CXR to diagnose pneumonia.
How to cite this article: Dhawan J, Singh G. Bedside Lung Ultrasound as an Independent Tool to Diagnose Pneumonia in Comparison to Chest X-ray: An Observational Prospective Study from Intensive Care Units. Indian J Crit Care Med 2022;26(8):920-929.
Keywords: Bedside lung ultrasound; Chest X-ray; Computed tomography scan; Diagnosis; Pneumonia.
Copyright © 2022; Jaypee Brothers Medical Publishers (P) Ltd.
Conflict of interest statement
Source of support: Nil Conflict of interest: None
Figures
Similar articles
-
Correspondence to the Article by Dhawan et al. "Bedside Lung Ultrasound as an Independent Tool to Diagnose Pneumonia in Comparison to Chest X-ray: An Observational Prospective Study from Intensive Care Units".Indian J Crit Care Med. 2023 May;27(5):371. doi: 10.5005/jp-journals-10071-24460. Indian J Crit Care Med. 2023. PMID: 37214120 Free PMC article.
-
Diagnostic accuracy of chest ultrasound in patients with pneumonia in the intensive care unit: A single-hospital study.Health Sci Rep. 2018 Nov 26;2(1):e102. doi: 10.1002/hsr2.102. eCollection 2019 Jan. Health Sci Rep. 2018. PMID: 30697596 Free PMC article.
-
Lung Ultrasound vs. Chest X-Ray Study for the Radiographic Diagnosis of COVID-19 Pneumonia in a High-Prevalence Population.J Emerg Med. 2021 May;60(5):615-625. doi: 10.1016/j.jemermed.2021.01.041. Epub 2021 Feb 4. J Emerg Med. 2021. PMID: 33722414 Free PMC article.
-
Thoracic imaging tests for the diagnosis of COVID-19.Cochrane Database Syst Rev. 2020 Sep 30;9:CD013639. doi: 10.1002/14651858.CD013639.pub2. Cochrane Database Syst Rev. 2020. Update in: Cochrane Database Syst Rev. 2020 Nov 26;11:CD013639. doi: 10.1002/14651858.CD013639.pub3. PMID: 32997361 Updated.
-
Advancement in pleura effusion diagnosis: a systematic review and meta-analysis of point-of-care ultrasound versus radiographic thoracic imaging.Ultrasound J. 2024 Jan 23;16(1):3. doi: 10.1186/s13089-023-00356-z. Ultrasound J. 2024. PMID: 38261109 Free PMC article. Review.
Cited by
-
Seeing is Believing: The Import of Lung Ultrasound!Indian J Crit Care Med. 2022 Aug;26(8):894-895. doi: 10.5005/jp-journals-10071-24291. Indian J Crit Care Med. 2022. PMID: 36042775 Free PMC article.
-
Correspondence to the Article by Dhawan et al. "Bedside Lung Ultrasound as an Independent Tool to Diagnose Pneumonia in Comparison to Chest X-ray: An Observational Prospective Study from Intensive Care Units".Indian J Crit Care Med. 2023 May;27(5):371. doi: 10.5005/jp-journals-10071-24460. Indian J Crit Care Med. 2023. PMID: 37214120 Free PMC article.
References
LinkOut - more resources
Full Text Sources
Miscellaneous