. 2022 Aug 22;4(4):fcac207.
doi: 10.1093/braincomms/fcac207. eCollection 2022.

Apolipoprotein B-100-mediated motor neuron degeneration in sporadic amyotrophic lateral sclerosis

Affiliations

Apolipoprotein B-100-mediated motor neuron degeneration in sporadic amyotrophic lateral sclerosis

Jamie K Wong et al. Brain Commun. .

Abstract

Amyotrophic lateral sclerosis is a fatal neurodegenerative disease characterized by motor neuron degeneration. Approximately 90% of cases occur sporadically with no known cause while 10% are familial cases arising from known inherited genetic mutations. In vivo studies have predominantly utilized transgenic models harbouring amyotrophic lateral sclerosis-associated gene mutations, which have not hitherto elucidated mechanisms underlying motor neuron death or identified therapeutic targets specific to sporadic amyotrophic lateral sclerosis. Here we provide evidence demonstrating pathogenic differences in CSF from patients with sporadic amyotrophic lateral sclerosis and familial amyotrophic lateral sclerosis patients with mutations in SOD1, C9orf72 and TARDBP. Using a novel CSF-mediated animal model, we show that intrathecal delivery of sporadic amyotrophic lateral sclerosis patient-derived CSF into the cervical subarachnoid space in adult wild-type mice induces permanent motor disability which is associated with hallmark pathological features of amyotrophic lateral sclerosis including motor neuron loss, cytoplasmic TDP-43 translocation, reactive astrogliosis and microglial activation. Motor impairments are not induced by SOD1, C9orf72 or TARDBP CSF, although a moderate degree of histopathological change occurs in C9orf72 and TARDBP CSF-injected mice. By conducting a series of CSF filtration studies and global proteomic analysis of CSF, we identified apolipoprotein B-100 in sporadic amyotrophic lateral sclerosis CSF as the putative agent responsible for inducing motor disability, motor neuron degeneration and pathological translocation of TDP-43. Apolipoprotein B-100 alone is sufficient to recapitulate clinical and pathological outcomes in vivo and induce death of human induced pluripotent stem cell-derived motor neurons in vitro. Targeted removal of apolipoprotein B-100 from sporadic amyotrophic lateral sclerosis CSF via filtration or immunodepletion successfully attenuated the neurotoxic capacity of sporadic amyotrophic lateral sclerosis CSF to induce motor disability, motor neuron death, and TDP-43 translocation. This study presents apolipoprotein B-100 as a novel therapeutic target specific for the predominant sporadic form of amyotrophic lateral sclerosis and establishes proof-of-concept to support CSF pheresis as a therapeutic strategy for mitigating neurotoxicity in sporadic amyotrophic lateral sclerosis.

Keywords: CSF; apolipoprotein B-100; neurodegeneration; neurotoxicity; sporadic amyotrophic lateral sclerosis.


Figures

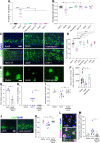
Graphical abstract
Graphical abstract
Figure 1
Figure 1
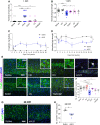
Motor deficits and motor neuron degeneration are induced by CSF from sALS but not fALS patients. (A) Motor deficit scores and (B) normalized forelimb grip strength at 1 day post-intrathecal delivery of saline, CSF from HC (n = 3), patients with sALS (n = 11), SOD1 ALS (n = 3), C9orf72 (C9) ALS (n = 3), or TARDBP ALS (n = 1). Each CSF sample was injected into a minimum of 3 mice. Saline (n = 29 mice), HC (n = 9 mice), sALS (n = 40 mice), SOD1 (n = 9 mice), C9 (n = 9 mice), TARDBP (n = 3 mice). (C) 28-day time course of motor deficit scores and (D) normalized forelimb grip strength following intrathecal injections of saline or sALS CSF (n = 2). Saline (n = 3 mice), sALS (n = 6 mice). (E) Representative images of cervical spinal cords immunostained for ChAT and activated caspase-3 at 1 DPI of saline, HC CSF (n = 4), CSF from multiple sclerosis patients as DCs (n = 5), patients with sALS (n = 11), SOD1 ALS (n = 3), C9 ALS (n = 3), or TARDBP ALS (n = 1). Scale bar, 100 µm, inset: 50 µm. (F) Quantification of the number of ChAT+ motor neurons in cervical ventral horns at 1 DPI. Saline (n = 22 mice), HC (n = 10 mice), DC (n = 15 mice), sALS (n = 37 mice), SOD1 (n = 8 mice), C9 (n = 9 mice), TARDBP (n = 3 mice). (G) Representative images of ChAT immunostaining in cervical spinal cords at 28 DPI of saline or sALS CSF (n = 2). Scale bar, 100 µm. (H) Quantification of the number of ChAT+ motor neurons in cervical ventral horns at 28 DPI. Saline (n = 3 mice), sALS (n = 6 mice). Data plotted as mean ± SEM. Each point represents an individual mouse (A, B, F and H). One-way ANOVA (A, B, and F) or repeated measures two-way ANOVA (C and D) with Bonferroni’s test. Unpaired t-test (H). ****P < 0.0001, ***P < 0.001, **P < 0.01, *P < 0.05.
Figure 2
Figure 2
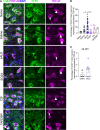
Pathological translocation of TDP-43 to the cytoplasm is induced by sALS CSF. (A) Representative images of TDP-43 immunostaining in ChAT+ motor neurons in naïve mice, and at 1 day following intrathecal delivery of saline, or CSF from sALS (n = 11), SOD1 (n = 3), C9 (n = 3), or TARDBP (n = 1) ALS patients. White arrowheads indicate nuclear TDP-43 expression and white arrows indicate cytoplasmic TDP-43 expression. Scale bar, 25 µm. (B and C) Quantification of the number of ChAT+ motor neurons displaying TDP-43 exclusively in the cytoplasm at 1 DPI (B) and 28 DPI (C). 1 DPI: Naïve (n = 3 mice), saline (n = 18 mice), sALS (n = 33 mice), SOD1 (n = 9 mice), C9 (n = 8 mice), TARDBP (n = 3 mice). 28 DPI: Saline (n = 3 mice), sALS (n = 6 mice). Data plotted as mean ± SEM. One-way ANOVA with Bonferroni’s test (B). Unpaired t-test (C). **P < 0.01, *P < 0.05.
Figure 3
Figure 3
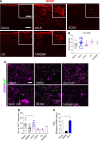
NF-H and glutamate transporter-1 upregulation occurs in cervical ventral horns at 1 day post-sALS CSF administration. (A and C) Representative images of cervical spinal cords immunostained for nonphosphorylated NF-H (SMI-32) and glutamate transporter-1 (GLT-1) at 1 DPI of saline, sALS CSF (n = 11), SOD1 CSF (n = 3), C9 CSF (n = 3), or TARDBP CSF (n = 1). Scale bar, 100 µm, inset: 50 µm. (B and D) Quantification of SMI-32 (B) or GLT-1 (D) immunostaining intensities at 1 DPI in areas surrounding motor neurons or ventral grey matter, respectively. Saline (n = 17 mice), sALS (n = 32 mice), SOD1 (n = 9 mice), C9 (n = 9 mice), TARDBP (n = 3 mice). Data plotted as mean ± SEM. Each point represents an individual mouse (B and D). One-way ANOVA with Bonferroni’s test. **P < 0.01, *P < 0.05.
Figure 4
Figure 4
sALS CSF induces GFAP upregulation in mice and proliferation of primary human astrocyte cultures. (A) Representative images of cervical spinal cords immunostained for GFAP at 1 DPI of saline, sALS CSF (n = 11), SOD1 CSF (n = 3), C9orf72 (C9) CSF (n = 3), or TARDBP CSF (n = 1). Scale bar, 100 µm, inset: 50 µm. (B) Quantification of GFAP immunostaining intensity in dorsal white matter at 1 DPI. Saline (n = 20 mice), sALS (n = 38 mice), SOD1 (n = 9 mice), C9 (n = 8 mice), TARDBP (n = 3 mice). Data plotted as means ± SEM. Each point represents an individual mouse. (C) Representative images of human primary astrocytes cultured in media for 5 days and then incubated for 24 h with DMEM or 50% sALS CSF, SOD1 CSF, C9 CSF, or TARDBP CSF diluted in DMEM. Scale bar, 100 µm. (D) Quantification of the number of Ki67+ proliferating human astrocytes following 24 h 50% CSF treatment. (E) Ki67 mRNA levels in human astrocytes following 24 h exposure to 50% CSF, as determined by qPCR. One-way ANOVA with Bonferroni’s test. *P < 0.05.
Figure 5
Figure 5
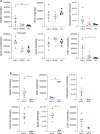
sALS CSF triggers microglial activation but not demyelination at 1 DPI. (A) Representative images of Iba1 immunostaining in cervical spinal cords at 1 DPI of saline, sALS CSF (n = 11), SOD1 CSF (n = 3), C9 CSF (n = 3), or TARDBP CSF (n = 1). Scale bar, 100 µm, inset: 50 µm. (B) Quantification of Iba1 immunostaining intensity in dorsal white matter at 1 DPI. Saline (n = 20 mice), sALS (n = 30 mice), SOD1 (n = 9 mice), C9 (n = 8 mice), TARDBP (n = 3 mice). Data plotted as mean ± SEM. Each point represents an individual mouse. One-way ANOVA with Bonferroni’s test. *P < 0.05. (C) Luxol fast blue staining in dorsal white matter of cervical spinal cords. Arrows indicate demyelinated areas. Scale bar, 100 µm.
Figure 6
Figure 6
Neurotoxic components responsible for inducing motor deficits and death of motor neurons are between 300 and 750 kDa. (A and B) Motor deficit scores and normalized forelimb grip strength at 1 DPI of saline (n = 20 mice), sALS CSF (n = 3 samples; n = 26 mice), or 5 kDa (n = 3 samples; n = 9 mice), 100 kDa (n = 2 samples; n = 6 mice), 300 kDa (n = 1 sample; n = 3 mice), or 750 kDa-filtered sALS CSF (n = 2 samples; n = 6 mice). (C) Representative images of cervical spinal cords immunostained for ChAT at 1 DPI of saline, sALS CSF, or 5, 100, 300, or 750 kDa-filtered sALS CSF. Scale bar, 100 µm. (D) Quantification of the number of ChAT+ motor neurons in cervical ventral horns at 1 DPI of unfiltered or filtered sALS CSF. Saline (n = 20 mice), sALS (n = 22 mice), 5 kDa (n = 9 mice), 100 kDa (n = 6 mice), 300 kDa (n = 3 mice), 750 kDa (n = 6 mice). (E) Quantification of the number of ChAT+ motor neurons displaying TDP-43 exclusively in the cytoplasm at 1 DPI of saline (n = 7 mice), sALS CSF (n = 9 mice) or 5 kDa-filtered sALS CSF (n = 8 mice). (F and G) CSF protein concentration (F) and Coomassie blue staining (G) of unfiltered sALS CSF and sALS CSF filtered through 5 kDa, 100 kDa, 300 kDa, or 750 kDa MWCO tangential flow hollow-fibre filters. Data plotted as mean ± SEM. Each point represents an individual mouse (A, B, D and E) or CSF sample (F). One-way ANOVA with Bonferroni’s test. ****P < 0.0001, ***P < 0.001, **P < 0.01, *P < 0.05.
Figure 7
Figure 7
Global proteome profiling of sALS CSF pre- and post-filtration. (A) Volcano plots showing 1618 proteins quantified in CSF using HRM™ MS, with 490 differentially abundant proteins between sALS CSF (n = 5) and HC CSF (n = 5). (B) 1181 differentially abundant proteins between 5 kDa-filtered sALS CSF (n = 2), and sALS CSF (n = 5). Red dots represent protein candidates and grey dots represent non-candidates. Differentially regulated proteins were identified using the following criteria: q-value < 0.05 and average fold change > 1.5. (C) Top 20 enriched biological process terms from GO enrichment analysis of 490 proteins significantly changed between sALS and HC CSF (P < 0.05). Red line represents enrichment P-value, green line represents enrichment P-value (Benjamini-Hochberg corrected), and blue line represents enrichment P-value (Bonferroni corrected).
Figure 8
Figure 8
Apolipoprotein B-100 is upregulated in sALS CSF and downregulated post-filtration. (A) CSF protein intensities of apolipoprotein B-100 (ApoB), myelin oligodendrocyte glycoprotein (MOG), haptoglobin, apolipoprotein C-III (ApoC-III), apolipoprotein E (ApoE), and chitotriosidase1 (CHIT1) in patients with sALS (n = 5) or primary progressive multiple sclerosis (PPMS) (n = 5), and healthy individuals (HC) (n = 5), as determined by global proteome profiling using HRM™ MS. (B) CSF protein levels in sALS CSF pre- and post-filtration with a 5 kDa MWCO tangential flow hollow-fibre filter. Data plotted as mean ± SEM. Each point represents an individual subject (A and B). **P < 0.01, *P < 0.05.
Figure 9
Figure 9
Apolipoprotein B-100 induces motor neuron disability and motor neuron death. (A and B) Motor deficit scores and normalized forelimb grip strength at 1 DPI of saline (n = 16 mice) or 1.5 µg/µL and 0.75 µg/uL: ApoB (n = 12 mice), MOG (n = 3 mice), haptoglobin (n = 4 mice), ApoC-III (n = 7 mice), ApoE (n = 6 mice), and CHIT1 (n = 3 mice). (C) Representative images of ChAT immunostaining in cervical spinal cords at 1 DPI of saline or 0.75 µg/µL ApoB, MOG, haptoglobin, ApoC-III, ApoE, and CHIT1. Scale bar, 100 µm. (D) Quantification of the number of ChAT+ motor neurons in cervical ventral horns at 1 DPI of saline (n = 13 mice) or 1.5 µg/µL and 0.75 µg/µL: ApoB (n = 11 mice), MOG (n = 3 mice), haptoglobin (n = 4 mice), ApoC-III (n = 5 mice), ApoE (n = 6 mice), and CHIT1 (n = 3 mice). (E) ChAT immunostaining of human iPSC-derived motor neurons cultured in motor neuron maintenance medium for 8 days, then treated for 24 h with 0.05 µg/µL ApoB or haptoglobin. Scale bar, 100 µm. (F) Quantification of the area of ChAT+ human motor neuron clusters 24 h following treatment with 0.05 µg/µL ApoB or haptoglobin. (G) ELISA measurements of ApoB levels in sALS CSF before and after ApoB immunodepletion. (H and I) Motor deficit scores and normalized forelimb grip strength at 1 DPI of saline (n = 3 mice), sALS CSF (n = 2; n = 9 mice), ApoB-depleted sALS CSF (n = 2; n = 9 mice). (J) Representative images of ChAT immunostaining in cervical spinal cords at 1 DPI of sALS CSF or ApoB-depleted sALS CSF. Scale bar, 100 µm. (K) Quantification of the number of ChAT+ motor neurons in cervical ventral horns at 1 DPI. Saline (n = 3 mice), sALS CSF (n = 9 mice), ApoB-depleted sALS CSF (n = 9 mice). (L) Representative images of TDP-43 immunostaining in ChAT+ motor neurons at 1 DPI of sALS CSF or ApoB-depleted sALS CSF. Scale bar, 25 µm. (M) Quantification of the number of ChAT+ motor neurons displaying TDP-43 exclusively in the cytoplasm at 1 DPI of saline (n = 3 mice), sALS CSF (n = 9 mice) or ApoB-depleted sALS CSF (n = 9 mice). Data plotted as mean ± SEM. Each point represents an individual mouse (A, B, D, H, I, K, and M), individual well (F), or CSF sample (G). One-way ANOVA with Bonferroni’s test or t-test. ****P < 0.0001, ***P < 0.001, **P < 0.01, *P < 0.05.

References

    1. Kiernan MC, Vucic S, Cheah BC, et al. . Amyotrophic lateral sclerosis. Lancet. 2011;377:942–955. - PubMed
    1. Brown RH, Al-Chalabi A. Amyotrophic lateral sclerosis. N Engl J Med. 2017;377:162–172. - PubMed
    1. Rosen DR, Siddique T, Patterson D, et al. . Mutations in cu/zn superoxide dismutase gene are associated with familial amyotrophic lateral sclerosis. Nature. 1993;362:59–62. - PubMed
    1. Chia R, Chio A, Traynor BJ. Novel genes associated with amyotrophic lateral sclerosis: Diagnostic and clinical implications. Lancet. 2018;17:94–102. - PMC - PubMed
    1. Benatar M. Lost in translation: Treatment trials in the SOD1 mouse and in human ALS. Neurobiol Dis. 2007;26:1–13. - PubMed

LinkOut - more resources