. 2022 Dec 2;20(12):1811-1821.
doi: 10.1158/1541-7786.MCR-22-0040.

Raptinal Induces Gasdermin E-Dependent Pyroptosis in Naïve and Therapy-Resistant Melanoma

Affiliations

Raptinal Induces Gasdermin E-Dependent Pyroptosis in Naïve and Therapy-Resistant Melanoma

Megane Vernon et al. Mol Cancer Res. .

Abstract

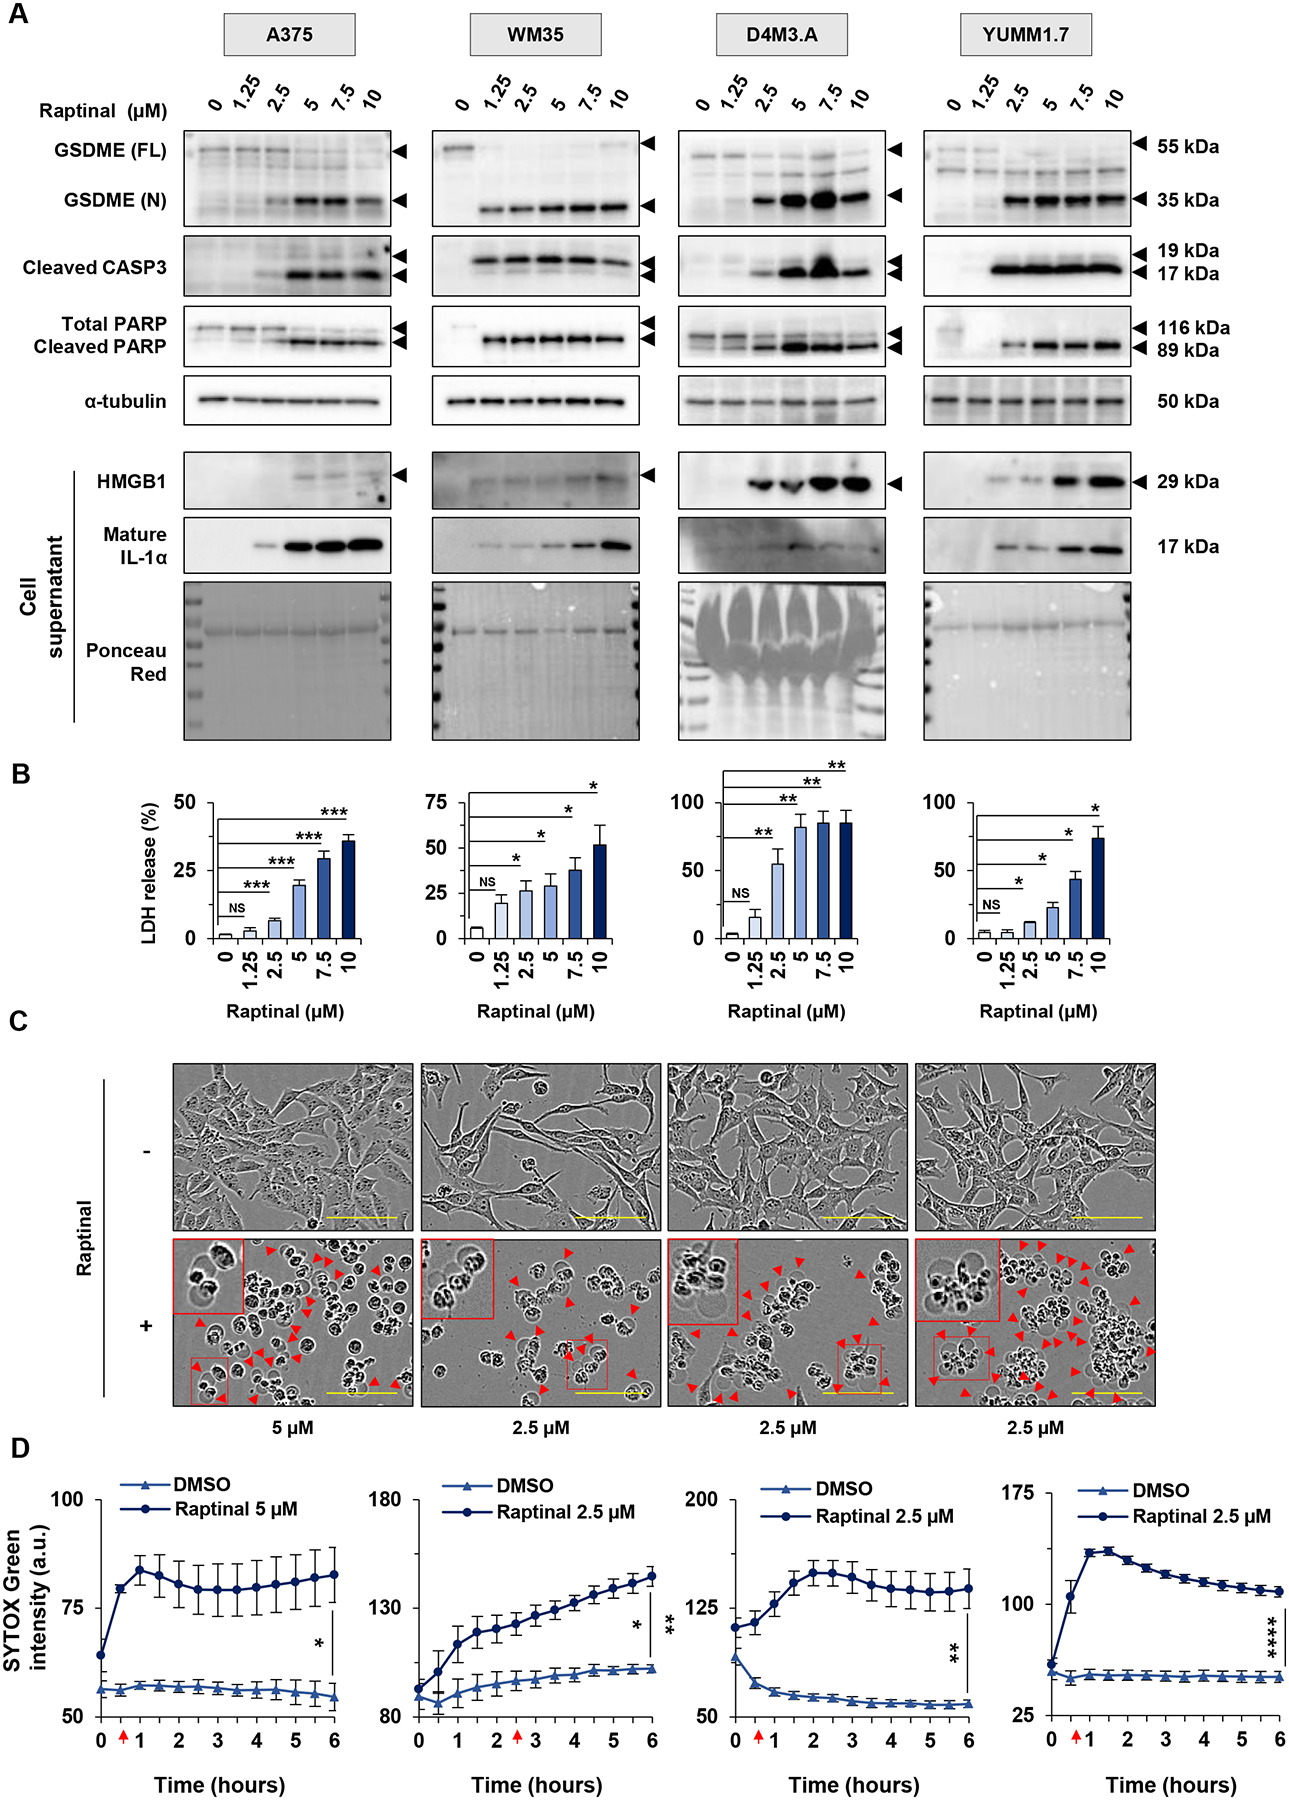
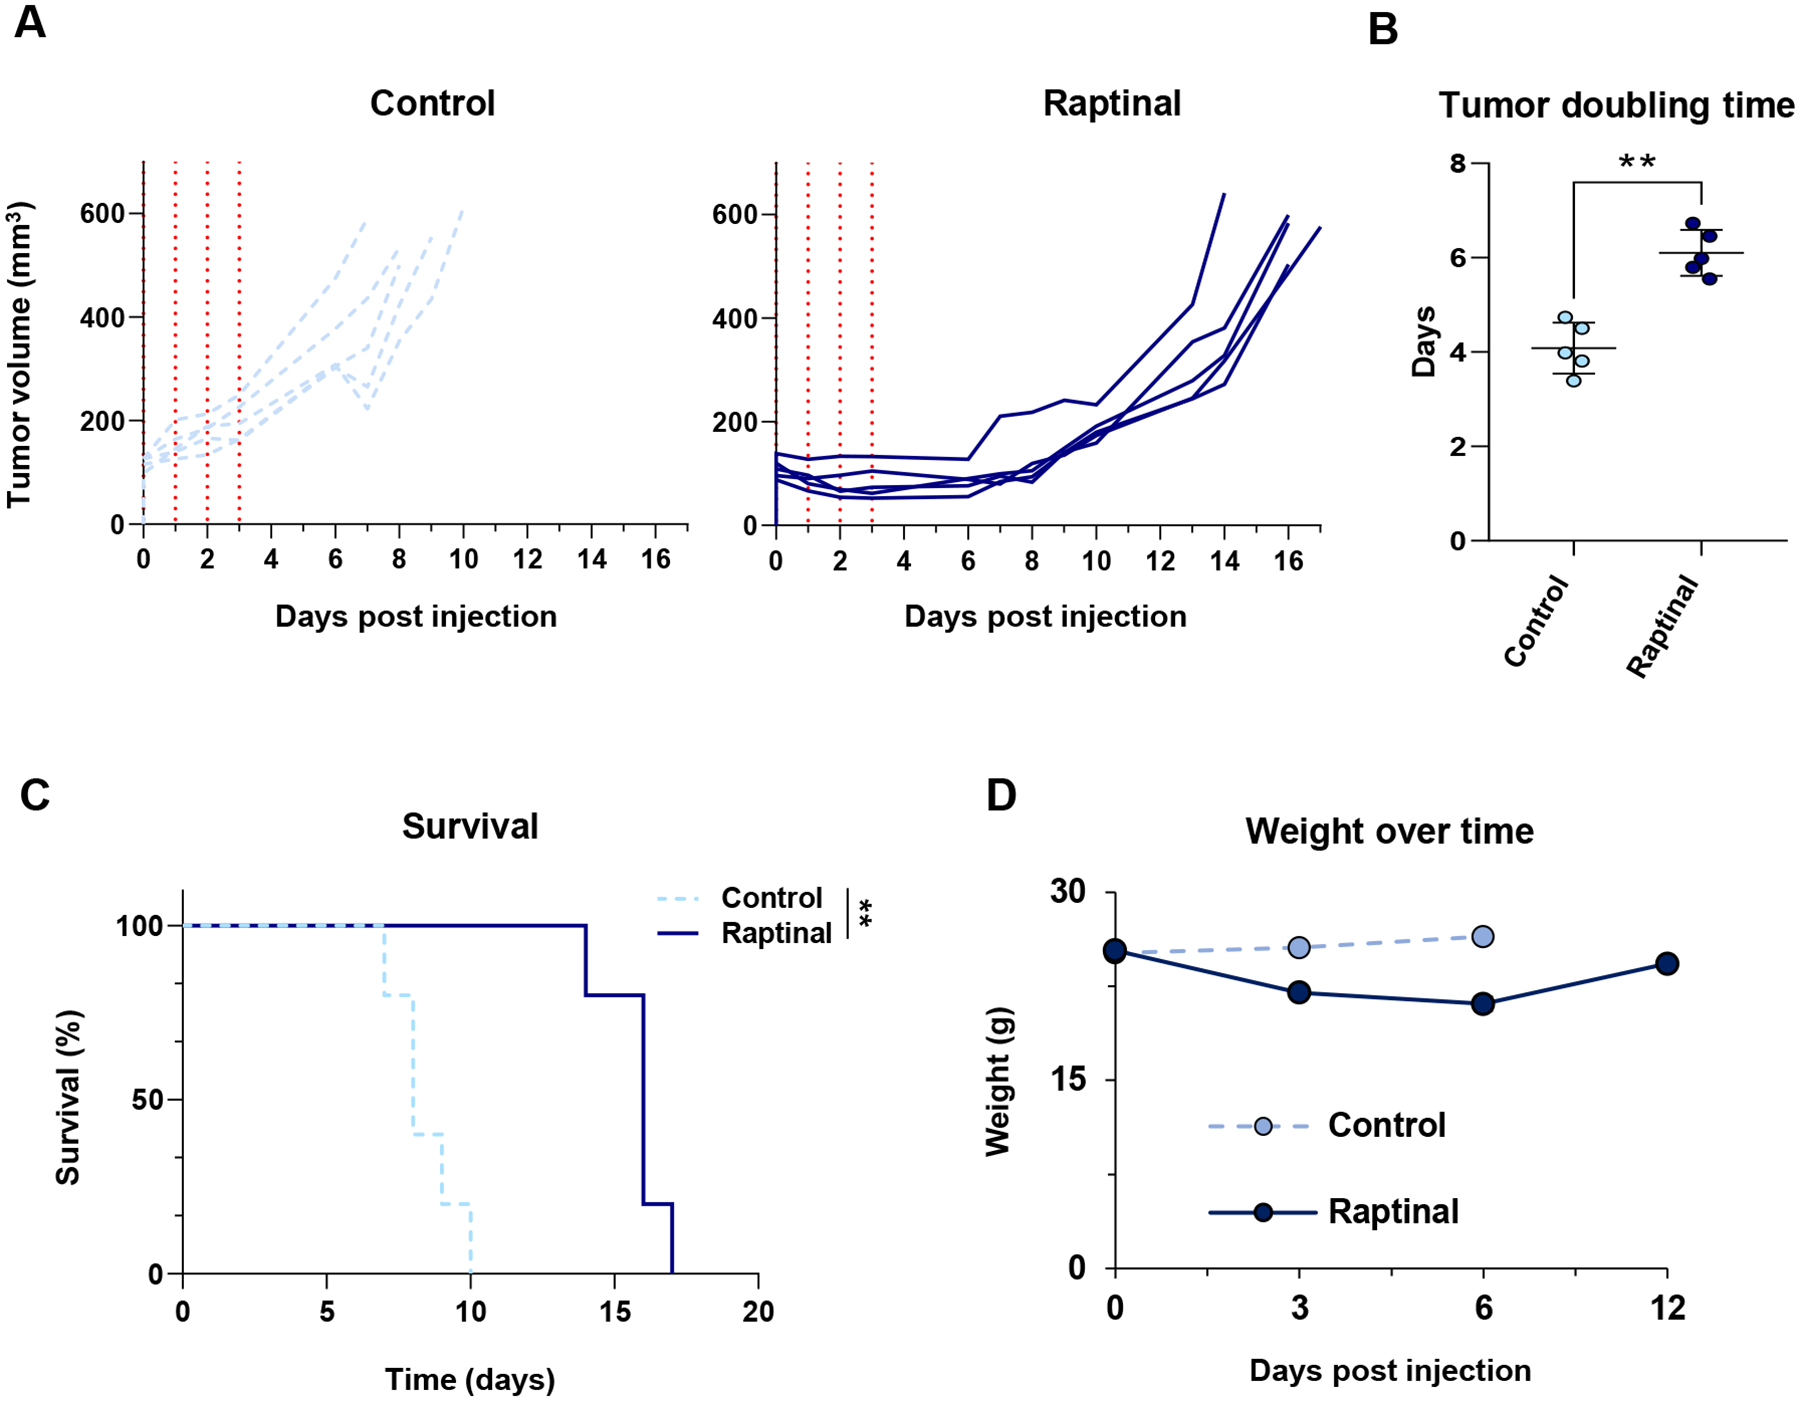
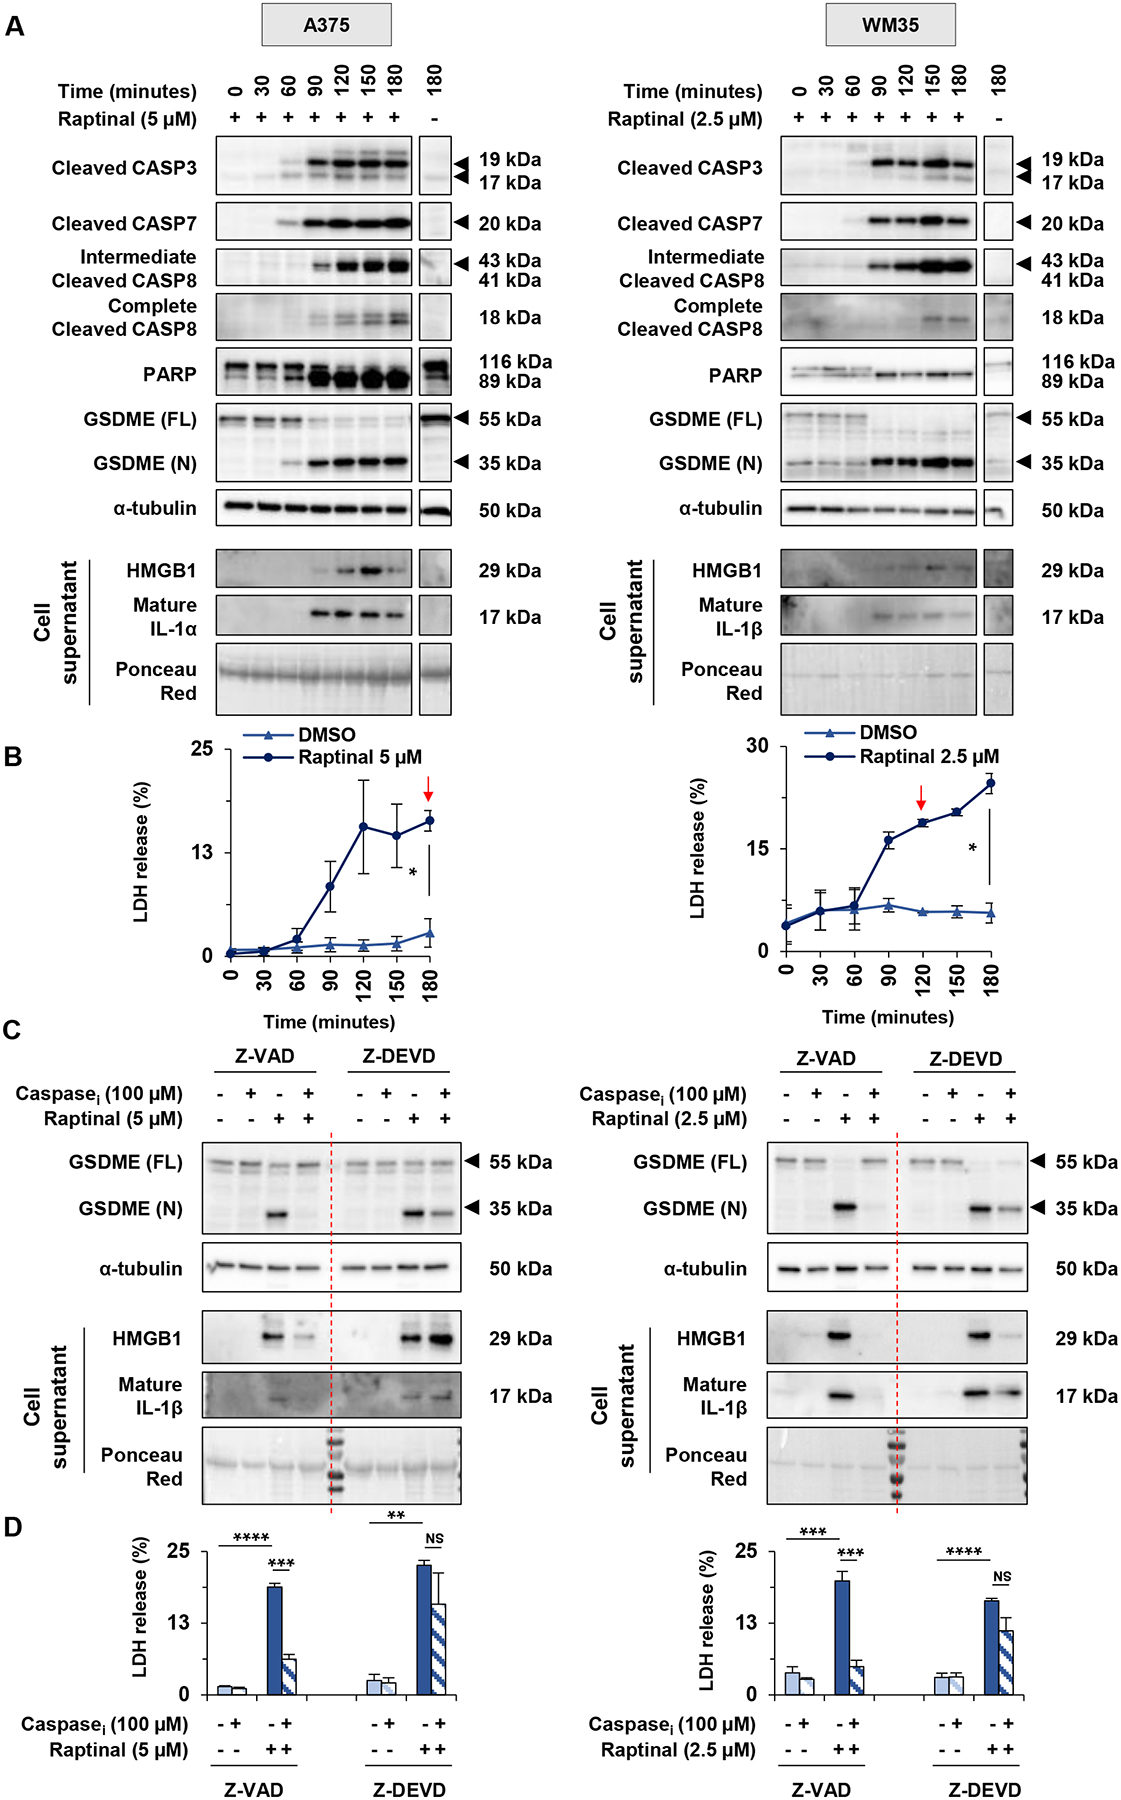
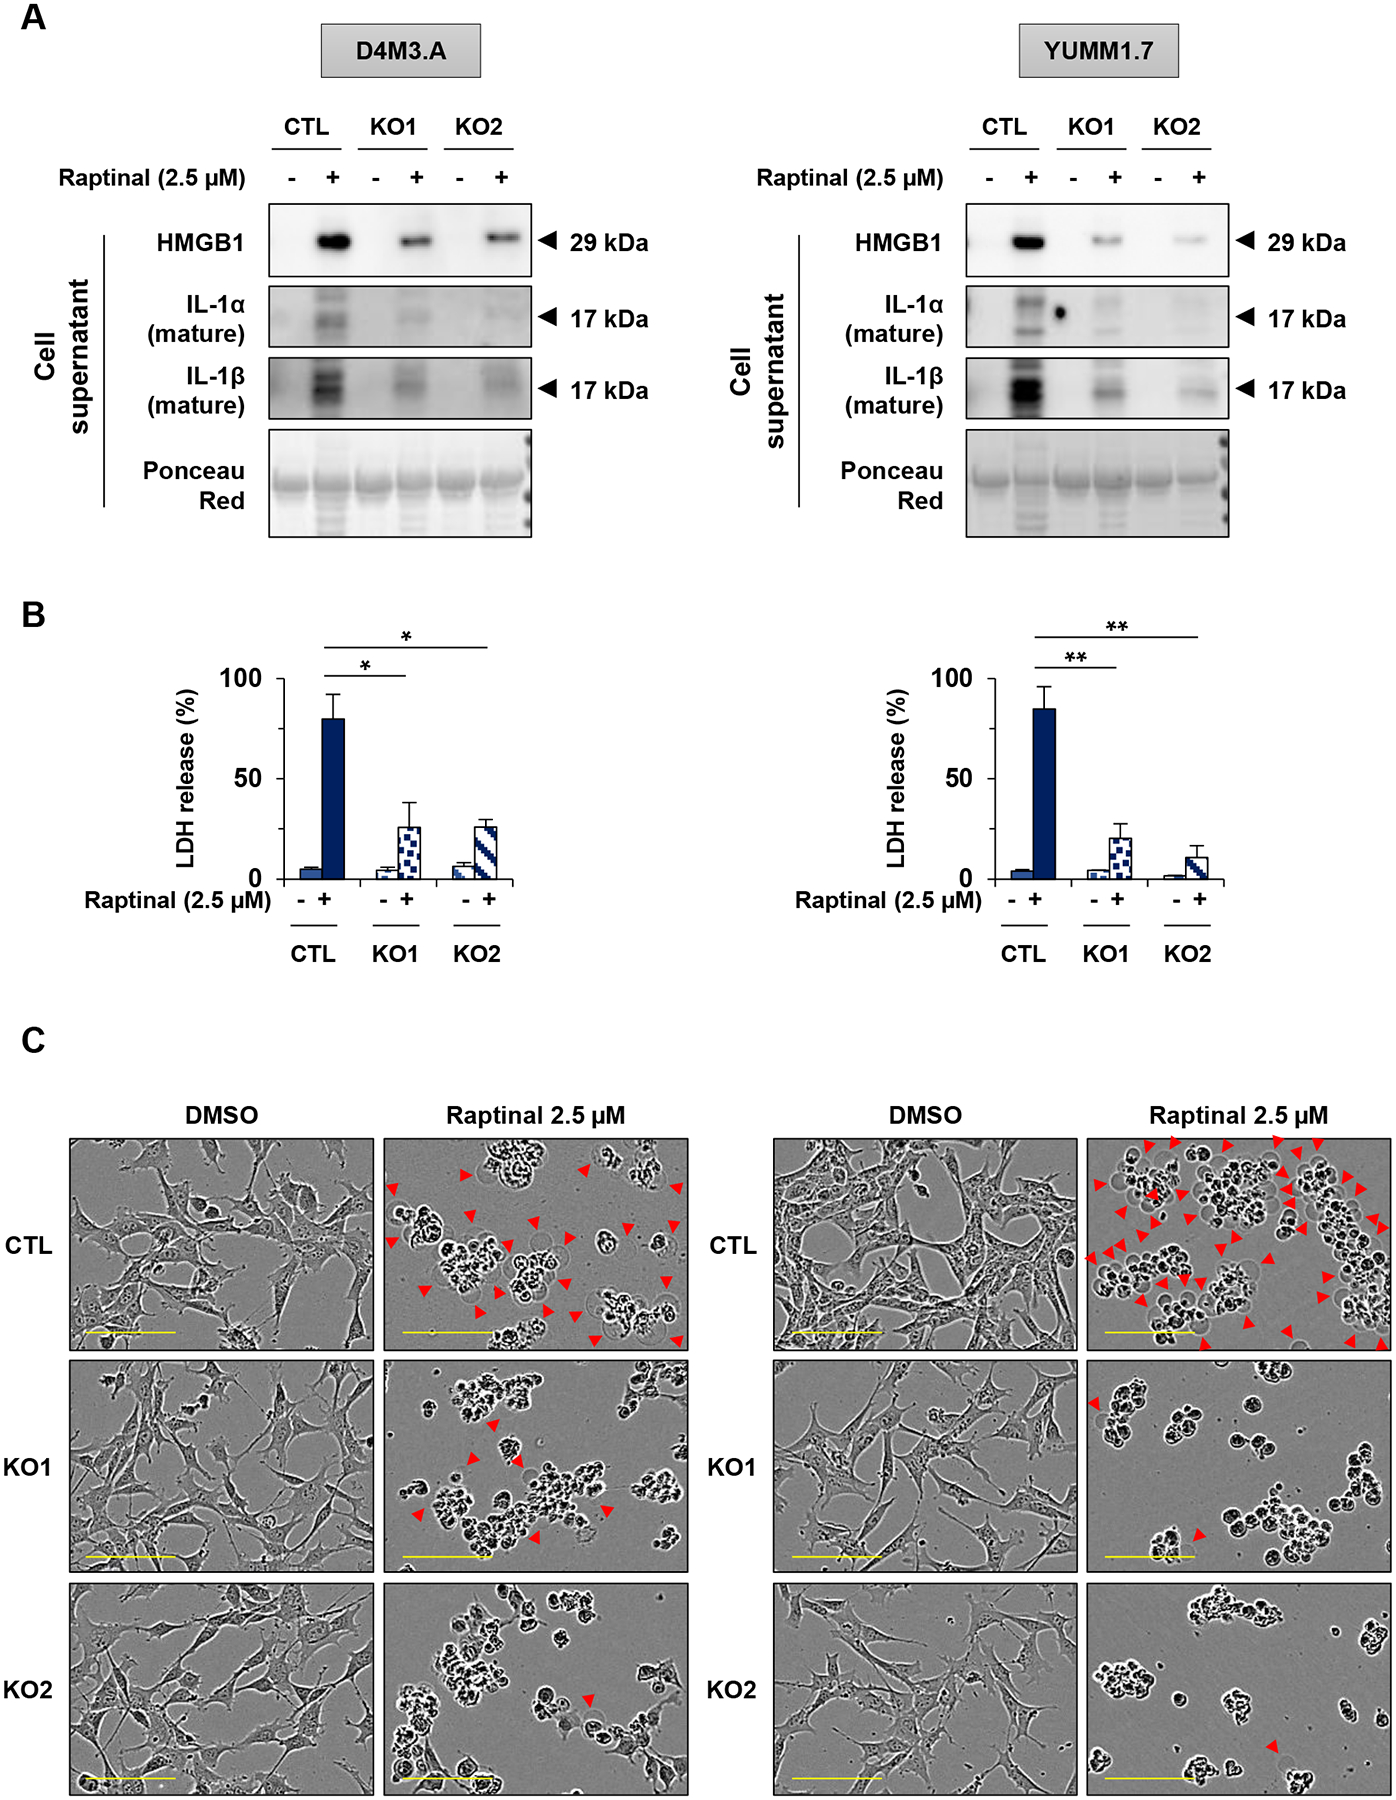
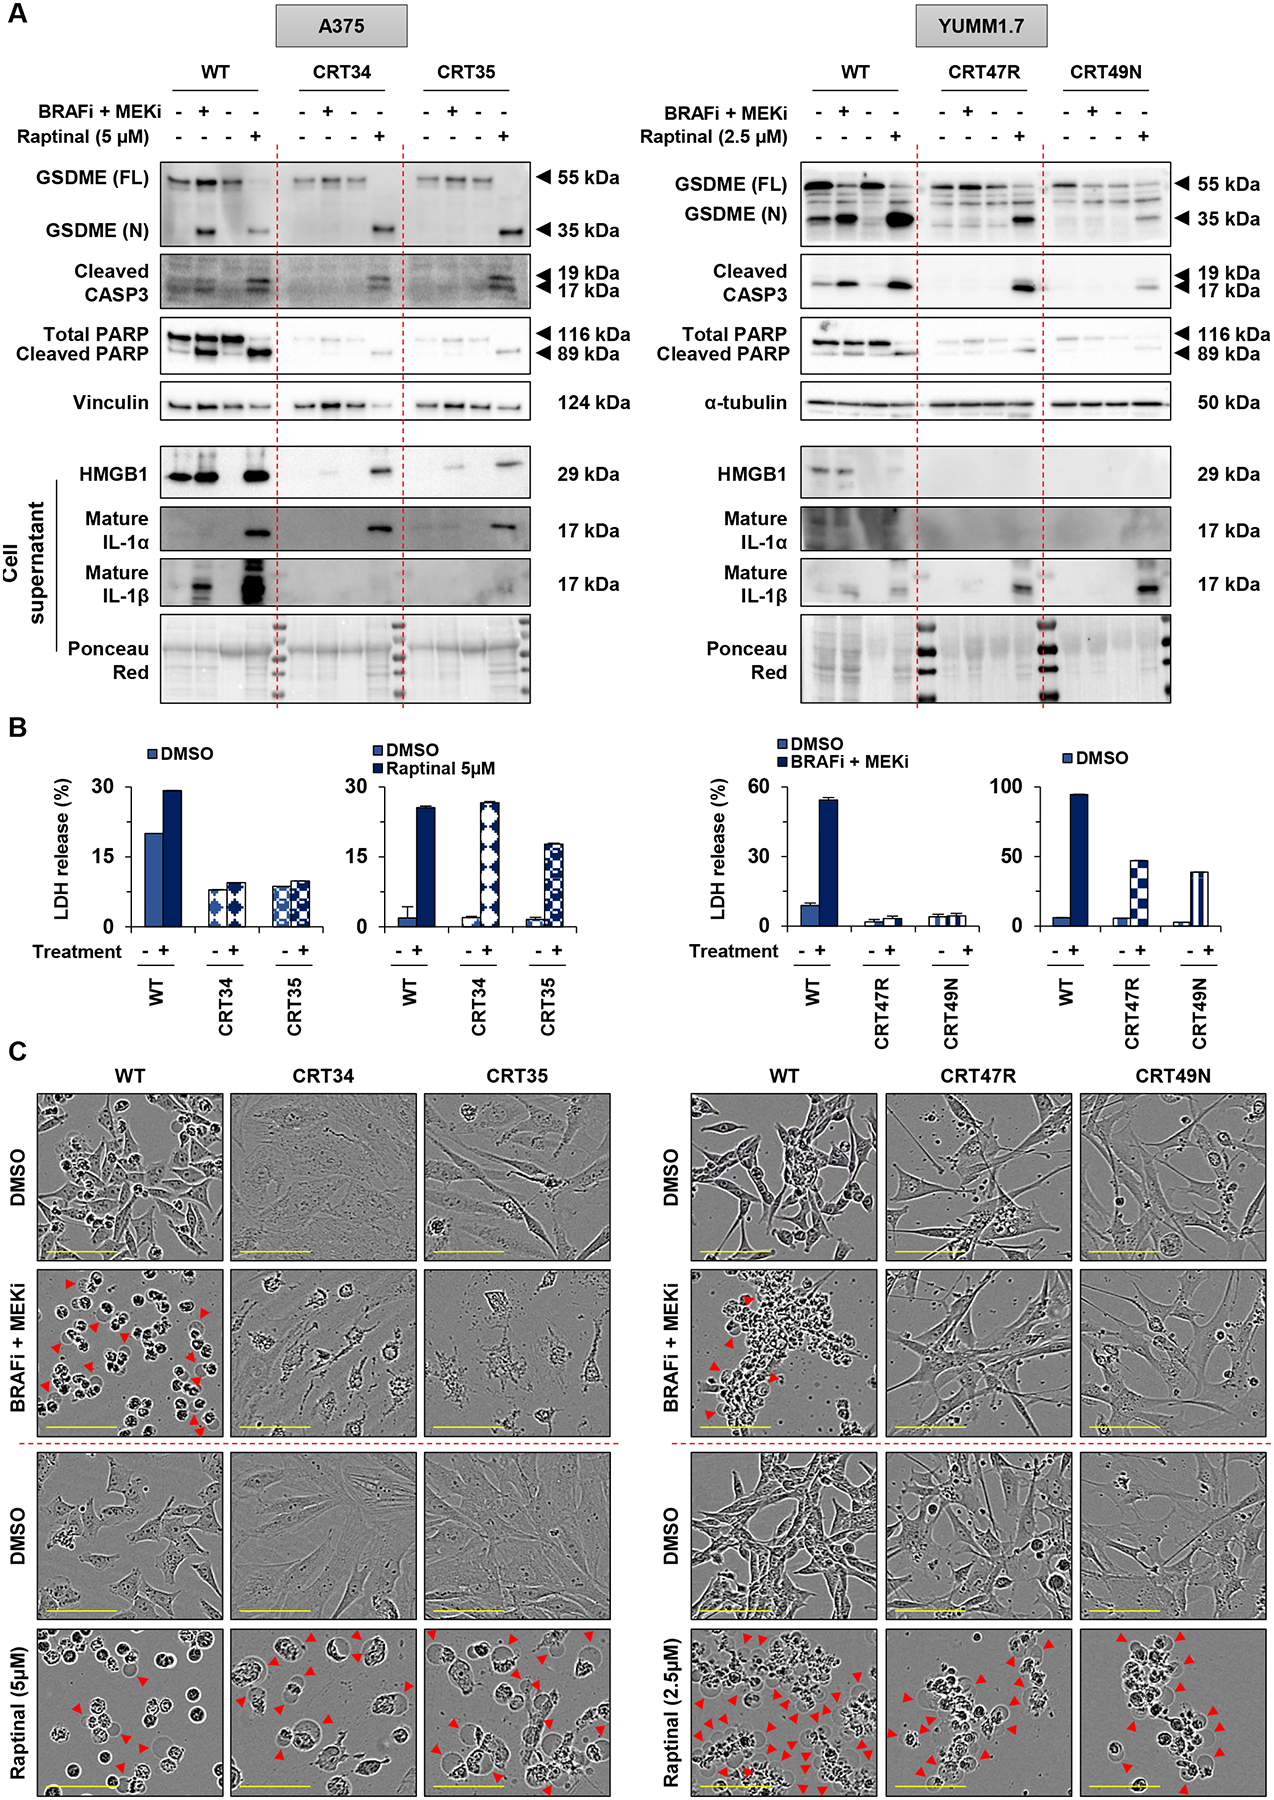
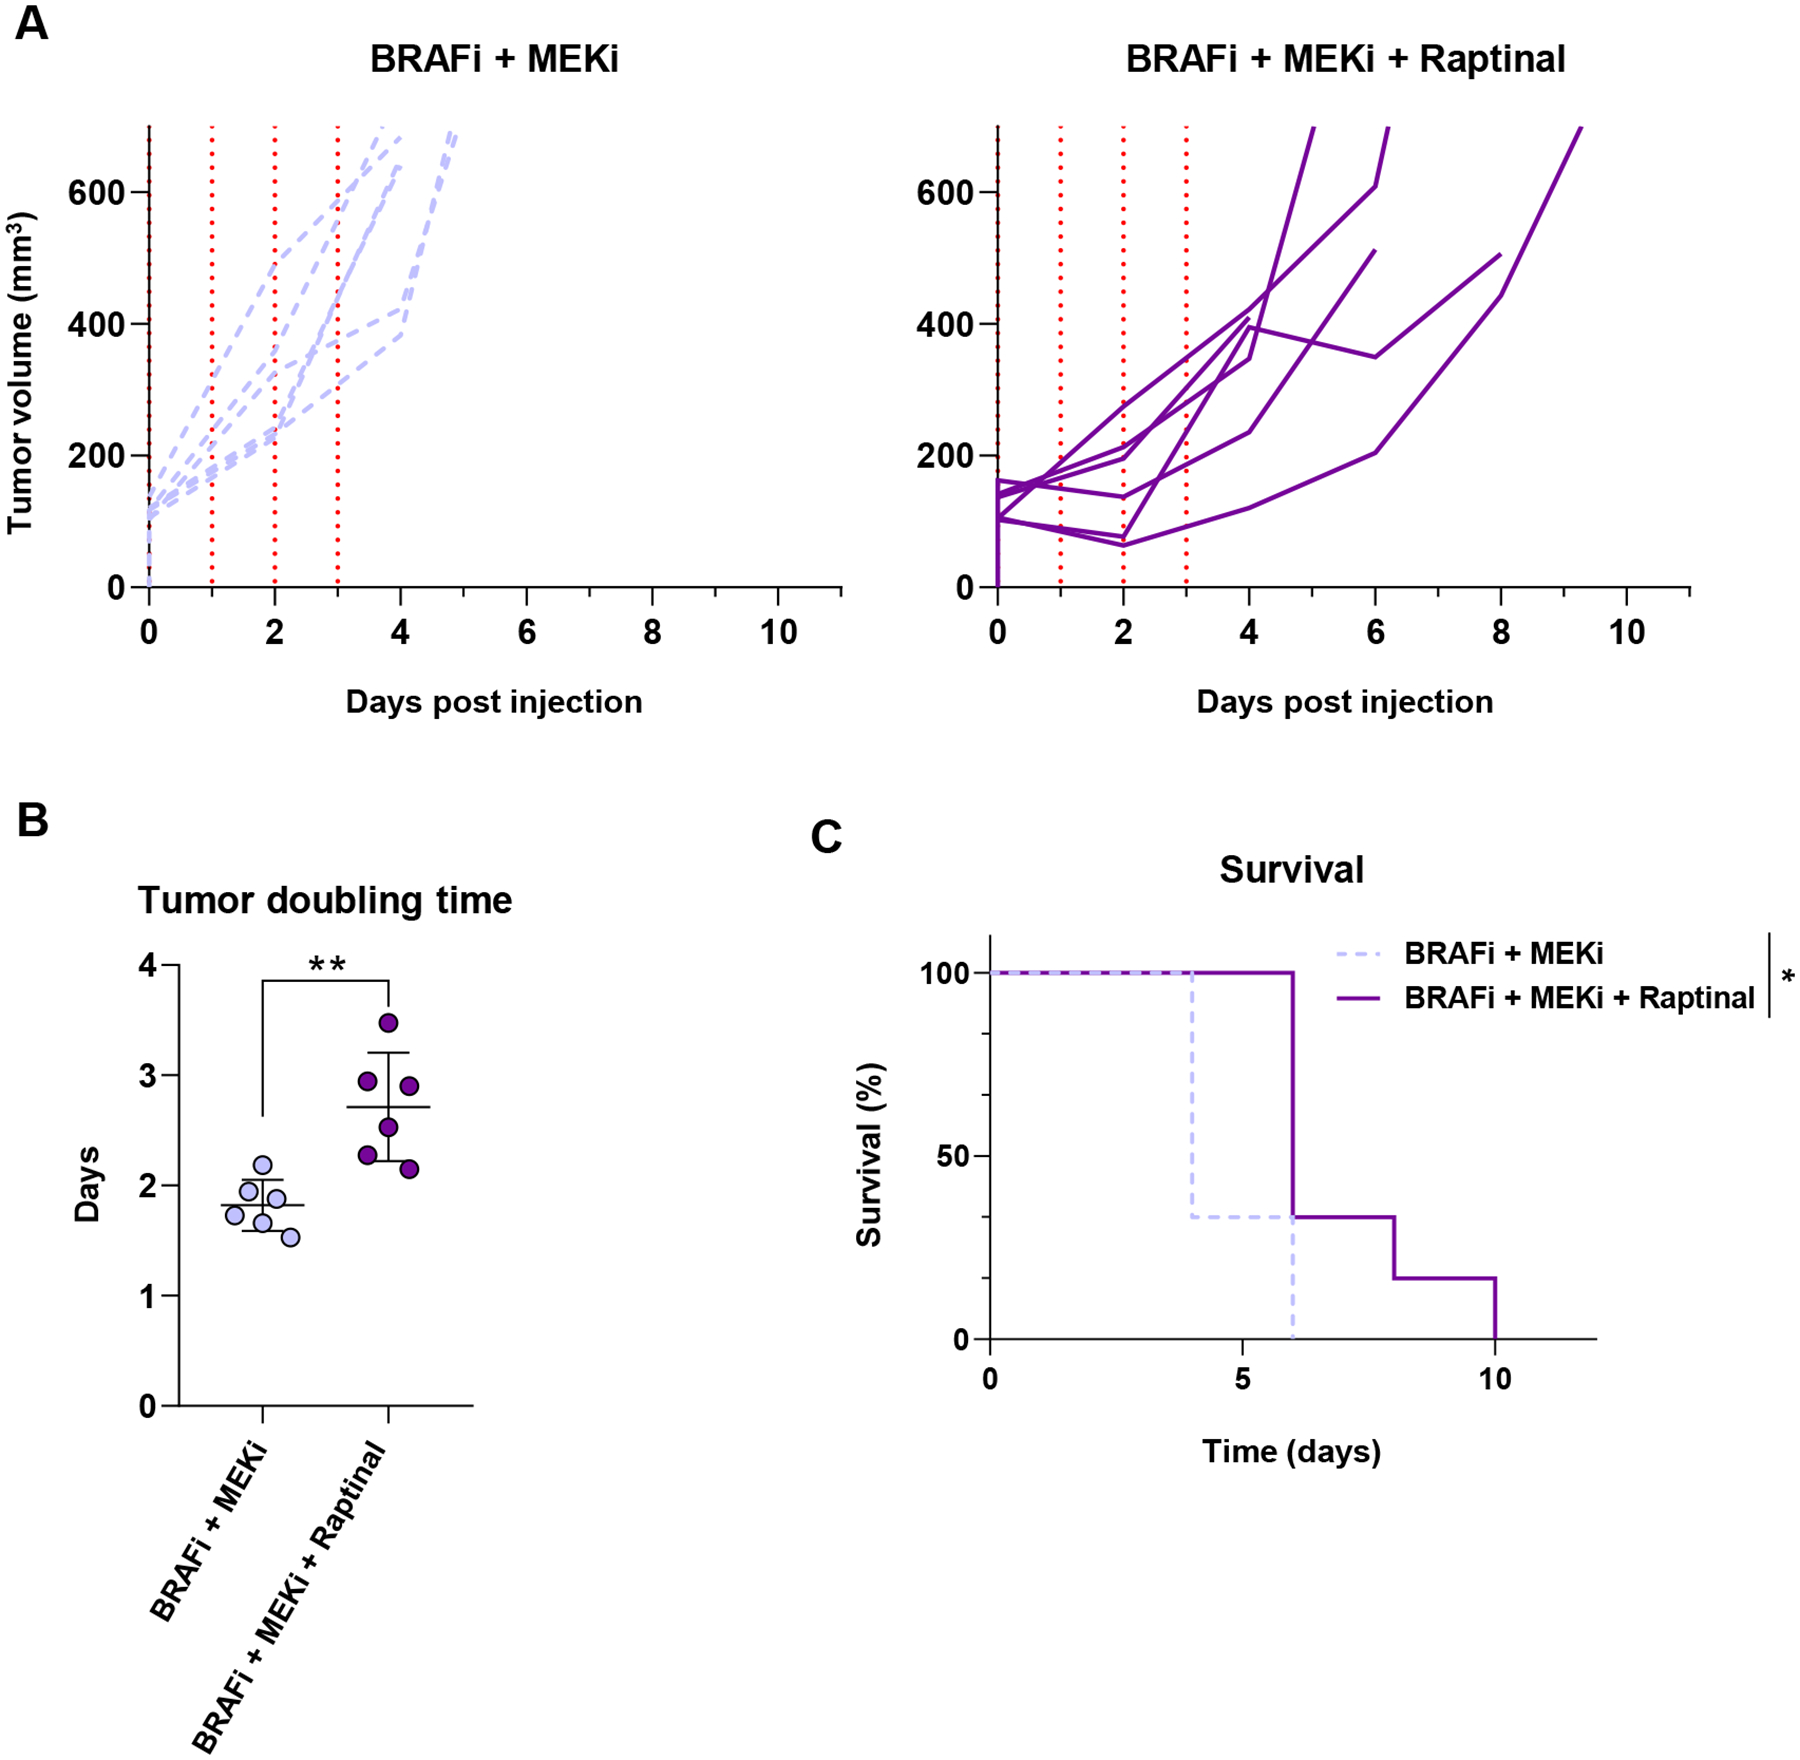
Lack of response and acquired resistance continue to be limitations of targeted and immune-based therapies. Pyroptosis is an inflammatory form of cell death characterized by the release of inflammatory damage-associated molecular patterns (DAMP) and cytokines via gasdermin (GSDM) protein pores in the plasma membrane. Induction of pyroptosis has implications for treatment strategies in both therapy-responsive, as well as resistance forms of melanoma. We show that the caspase-3 activator, raptinal, induces pyroptosis in both human and mouse melanoma cell line models and delays tumor growth in vivo. Release of DAMPs and inflammatory cytokines was dependent on caspase activity and GSDME expression. Furthermore, raptinal stimulated pyroptosis in melanoma models that have acquired resistance to BRAF and MEK inhibitor therapy. These findings add support to efforts to induce pyroptosis in both the treatment-naïve and resistant settings.

Implications: Raptinal can rapidly induce pyroptosis in naïve and BRAFi plus MEKi-resistant melanoma, which may be beneficial for patients who have developed acquired resistance to targeted therapies.


Conflict of interest statement

Conflict of interest: A.E. Aplin reports ownership interest in patent number 9880150. No potential conflicts of interest were disclosed by the other authors.

Figures

Figure 1:
Figure 1:. Raptinal induces pyroptosis in human and mouse melanoma cells.
(A-B) Human melanoma cells (A375 and WM35) and mouse melanoma cells (D4M3.A and YUMM1.7), were treated in vitro for 3 hours with doses of raptinal ranging from 1.25 to 10 μM. DMSO was used as a vehicle control. (A) Levels of GSDME, cleaved caspase-3 and PARP in lysates, or HMGB1 and IL-1α in supernatants after raptinal treatment. α-tubulin or ponceau red staining are controls for protein lysates or supernatant total protein extracts, respectively. Full-length GSDME (FL) runs at 55 kDa and cleaved N-terminal GSDME (N) runs at 35 kDa. Total PARP runs at 116 kDa and cleaved PARP runs at 89 kDa. Western Blots shown are representative of at least three independent experiments. (B) Percentage of LDH release averaged from at least three independent experiments. Error bars are SEM. Significance was assessed by Student t test for WM35 and YUMM1.7 cells and by Mann-Whitney test for A375 and D4M3.A cells, NS: non-significant, *p<0.05, **p<0.01, ***p<0.001. (C-D) Cells were treated with 2.5 μM raptinal, except for A375 that were treated with 5 μM. (C) Cell morphology visualized with the IncuCyte S3 system at x10 objective. Plasma membrane bubble-like protrusions, a characteristic feature of pyroptosis, are indicated by red arrow and a magnification is show in the red frame. Scale bar: 100 μm. Cell morphology images shown are representative of at least three independent experiments. (D) SYTOX green fluorescence was measured over time with IncuCyte S3 system and normalized to cell confluence at each timepoint for cells treated with DMSO or raptinal. At least two replicate wells were performed in each experimental condition and all experiments were performed at least three times independently. Data are representative of at least three independent experiments. Error bars are SEM. Significance was assessed by Student t test, *p<0.05, **p<0.01, ***p<0.001, ****p<0.0001. Red arrows indicate the time when the treated cells were significantly more fluorescent than untreated cells.
Figure 2:
Figure 2:. Raptinal delays tumor growth in vivo.
YUMM1.7 cells were implanted intradermally into C57BL/6J animals and allowed to grow to approximately 100 mm3. (A) Tracings of each tumor treated for four days with vehicle control (n=5) (light blue) or raptinal (n=5) (dark blue) are shown to the endpoint of 500 mm3. The vertical red dotted lines correspond to the days in which mice received injections. (B) Tumor growth was modeled as a function of time to assess average tumor doubling time from day 0 to the 500 mm3 endpoint. Each individual data point represents one animal used with the average and standard deviation displayed. Significance was assessed using the Mann-Whitney test, **p<0.01. (C) Kaplan-Meier survival curves comparing vehicle control to the raptinal group. A log rank (Mantel-Cox) test was used to determine significance, **p<0.01. (D) Mouse weights over time from the vehicle control and raptinal treatment arms.
Figure 3:
Figure 3:. Raptinal-induced pyroptosis is caspase-dependent in melanoma cells.
(A-B) A375 and WM35 were respectively treated with 5 μM and 2.5 μM of raptinal. Cell lysates and supernatants were harvested every 30 minutes for 3 hours. (A) Levels of cleaved caspase-3, cleaved caspase-7, cleaved caspase-8, PARP and GSDME in lysates, or HMGB1, IL-1α or IL-1β in supernatants. α-tubulin or ponceau red were used for lysate or supernatant loading controls, respectively. Cells treated with DMSO for 180 minutes were used as negative control (last lane). Western Blots shown are representative of three independent experiments. (B) Percentage of LDH release averaged from two independent experiments. Error bars are SEM. Significance was assessed by Student t test, *p<0.05. Red arrows indicate the time when the treated cells released significantly more LDH than untreated cells. (C-D) A375 and WM35 cells were pre-treated for 3 hours with Z-VAD-FMK, Z-DEVD-FMK or DMSO at 100 μM. After this pre-treatment, A375 were treated with 5 μM and WM35 with 2.5 μM of raptinal or DMSO for 3 hours. (C) Levels of GSDME in lysates, or HMGB1 and IL-1β in supernatants. Western blots shown are representative of three independent experiments. (D) Percentage of LDH release averaged from three independent experiments. Error bars are SEM. Significance was assessed by Student t test, NS: non-significant, **p<0.01, ***p<0.001, ****p<0.0001.
Figure 4:
Figure 4:. Raptinal-induced pyroptosis is GSDME-dependent in mouse melanoma cells.
(A-C) D4M3.A and YUMM1.7 mouse melanoma cells were treated with 2.5 μM of raptinal for 3 hours (A) Levels of secreted HMGB1, IL-1α and IL-1β in supernatants from wild-type (noted CTL) and two clones of D4M3.A or YUMM1.7 GSDME knockout cells (noted KO1 and KO2). Ponceau red as protein loading. Western Blots shown are representative of three independent experiments. (B) Percentage of LDH release averaged from three independent experiments. Error bars are SEM. Significance was assessed by Student’s t test, *p<0.05, **p<0.01. (C) Cell morphology visualized with the IncuCyte S3 system at x10 objective. Plasma membrane bubble-like protrusions, a characteristic feature of pyroptosis, are indicated by red arrow. Scale bar: 100 μm. Cell morphology images shown are representative of at least three independent experiments.
Figure 5:
Figure 5:. Raptinal induces pyroptosis in BRAFi and MEKi resistant melanoma cells.
(A-C) A375 WT and CRT cells (CRT34 and CRT35) were treated with PLX4720 (1 μmol/L) and PD0325901 (35 nmol/L) for 48 hours and with raptinal 5 μM for 3 hours. YUMM1.7 WT and CRT cells (CRT47R and CRT49N) were treated with PLX4720 (1 μmol/L) and PD0325901 (35 nmol/L) for 24 hours and with raptinal 2.5 μM for 3 hours. (A) Levels of GSDME, cleaved caspase-3 and PARP in lysates, or HMGB1, IL-1α and IL-1β in supernatants. Vinculin, α-tubulin or ponceau red were utilized for loading controls. Western Blots shown are representative of three independent experiments. (B) Percentage of LDH release representative of two independent experiments. Three replicate wells were performed for each experimental condition. Error bars are SEM. (C) Cell morphology visualized with the IncuCyte S3 system at x10 objective. Plasma membrane bubble-like protrusions, a characteristic feature of pyroptosis, are indicated by red arrow. Scale bar: 100 μm. Cell morphology shown are representative of at least two independent experiments.
Figure 6:
Figure 6:. Raptinal delays growth of BRAFi and MEKi resistant tumor cells in vivo.
CRT47R cells were implanted intradermally into C57BL/6J animals and allowed to grow to approximately 100 mm3. (A) Tumor growth after treatment for four days with either vehicle (n=5) (light purple) or raptinal (n=5) (dark purple) are shown to the endpoint of 500 mm3. The vertical red dotted lines correspond to the days in which mice received injections. (B) Tumor growth was modeled as a function of time to assess average tumor doubling time from day 0 to the 500 mm3 endpoint. Each individual data point represents one animal used with the average and standard deviation displayed. Significance was assessed using the Mann-Whitney test, **p<0.01. (C) Kaplan-Meier survival curves comparing vehicle control to the raptinal group. A log rank (Mantel-Cox) test was used to determine significance, **p<0.01.

Similar articles

Cited by

References

    1. Kim EH, Wong S-W, Martinez J. Programmed Necrosis and Disease:We interrupt your regular programming to bring you necroinflammation. Cell Death Differ. 2019;26:25–40. - PMC - PubMed
    1. Boatright KM, Salvesen GS. Mechanisms of caspase activation. Current Opinion in Cell Biology. 2003;15:725–31. - PubMed
    1. Cullen SP, Martin SJ. Caspase activation pathways: some recent progress. Cell Death Differ. Nature Publishing Group; 2009;16:935–8. - PubMed
    1. Galluzzi L, Vitale I, Aaronson SA, Abrams JM, Adam D, Agostinis P, et al. Molecular mechanisms of cell death: recommendations of the Nomenclature Committee on Cell Death 2018. Cell Death Differ. 2018;25:486–541. - PMC - PubMed
    1. Li J, Yuan J. Caspases in apoptosis and beyond. Oncogene. Nature Publishing Group; 2008;27:6194–206. - PubMed

Publication types