. 2023 Jan;43(1):109-122.
doi: 10.1007/s10875-022-01349-8. Epub 2022 Aug 31.

Inadequate Activation of γδT- and B-cells in Patient with Wiskott-Aldrich Syndrome (WAS) Portrayed by TRG and IGH Repertoire Analyses

Affiliations

Inadequate Activation of γδT- and B-cells in Patient with Wiskott-Aldrich Syndrome (WAS) Portrayed by TRG and IGH Repertoire Analyses

Dahlia Palevski et al. J Clin Immunol. 2023 Jan.

Abstract

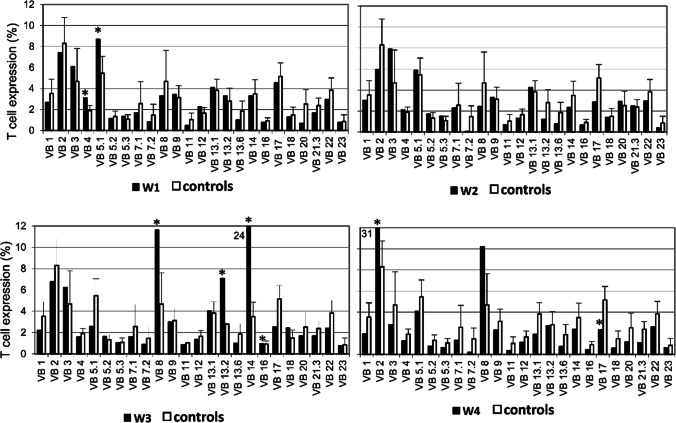
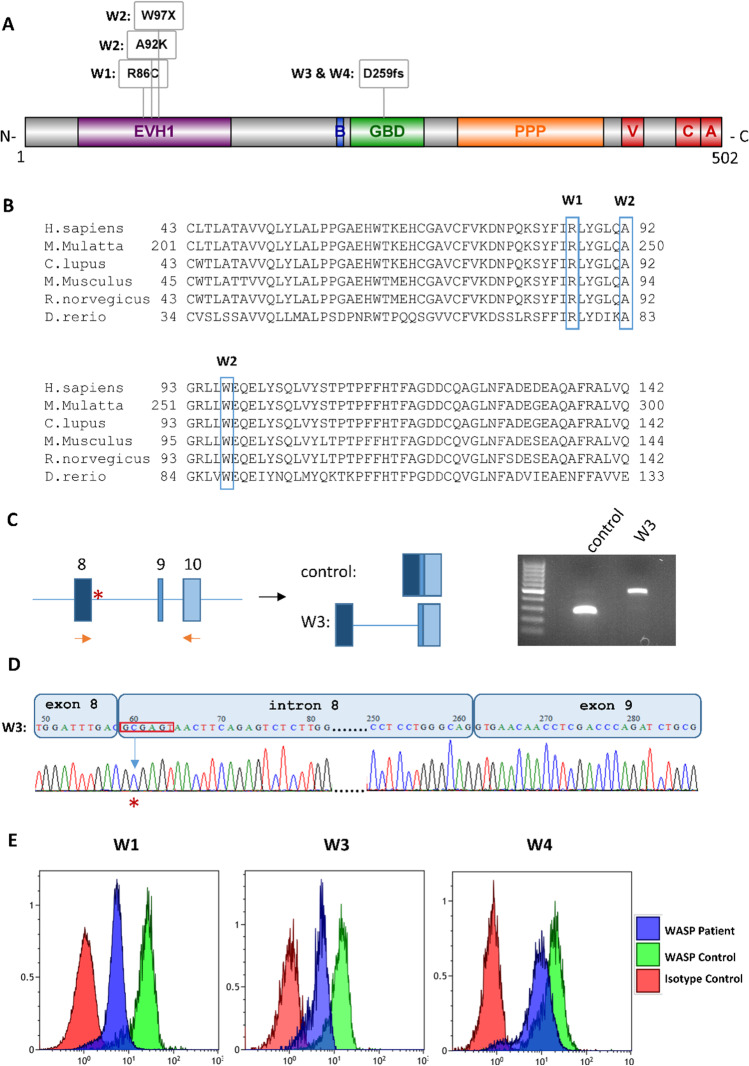
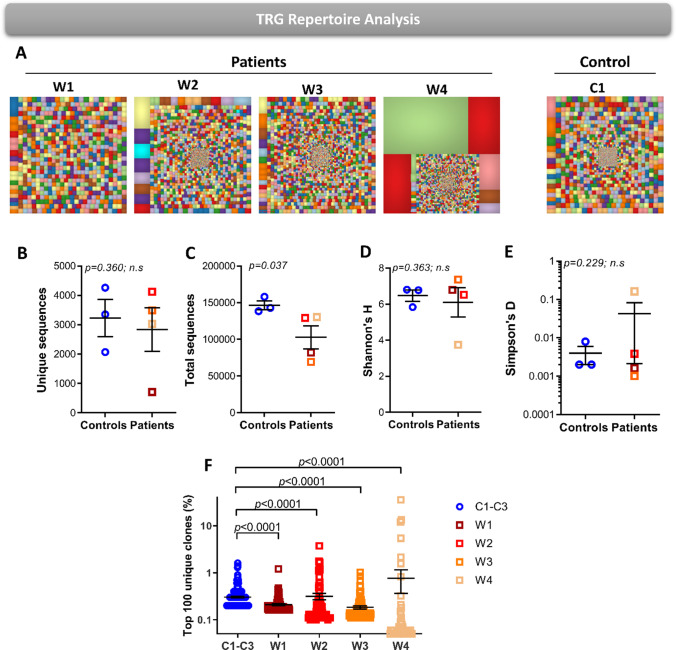
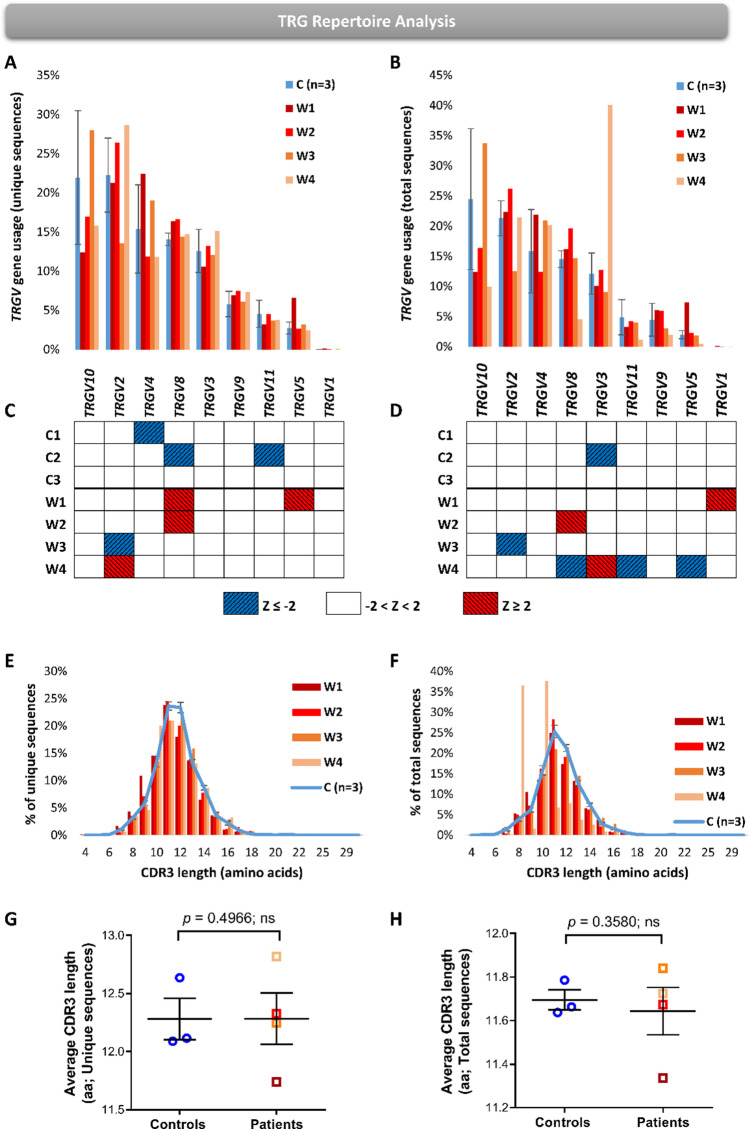
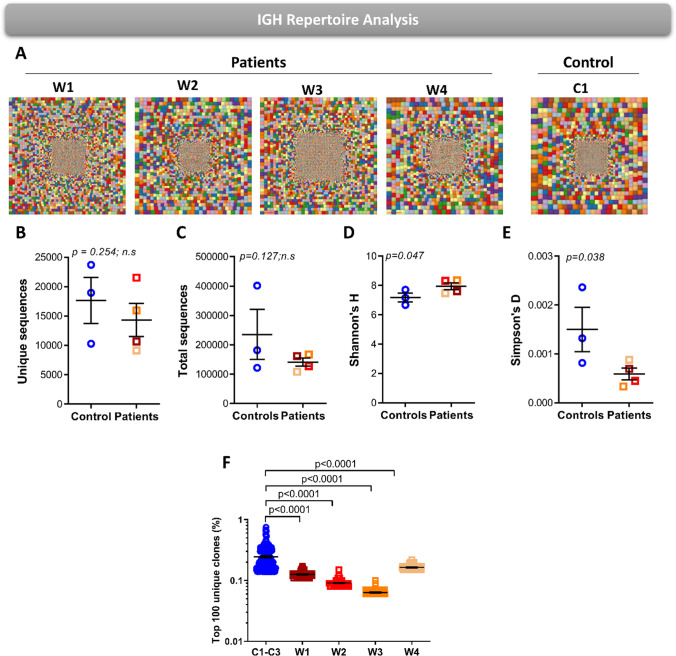
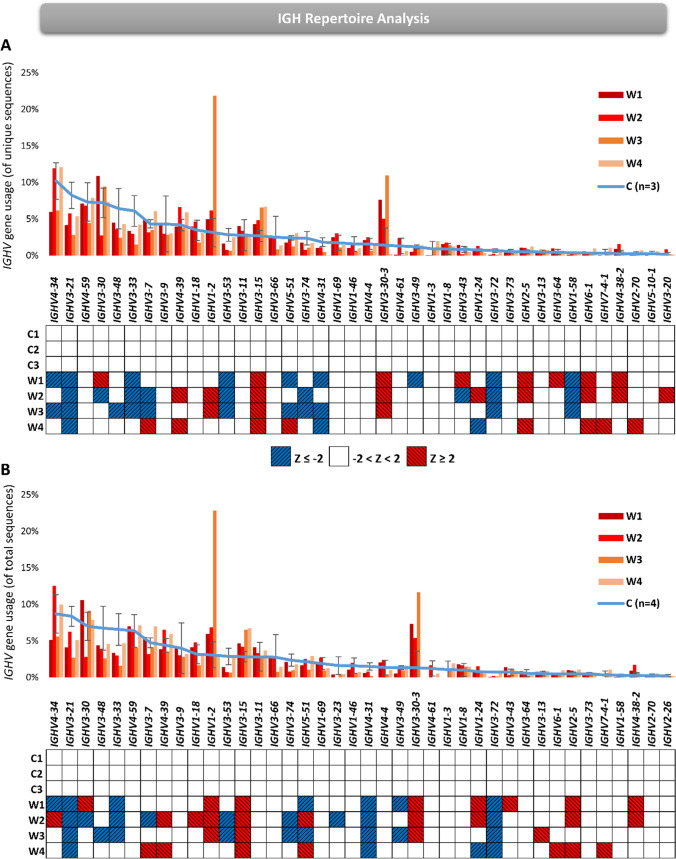
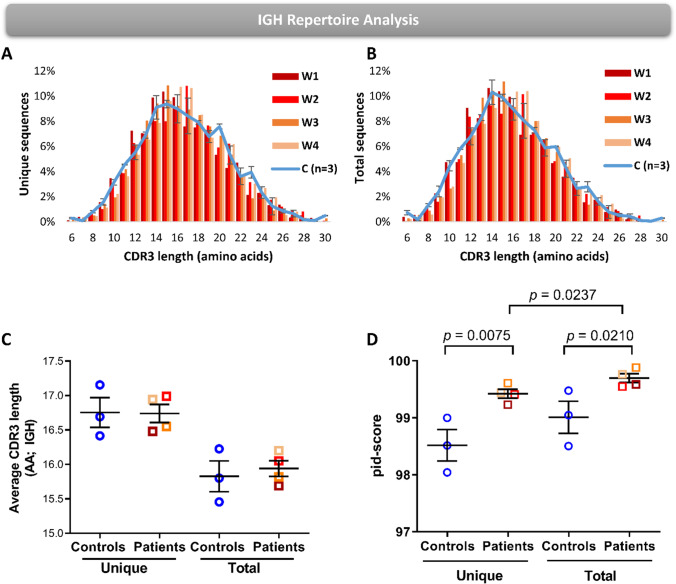
Patients with Wiskott-Aldrich syndrome (WAS) harbor mutations in the WAS gene and suffer from immunodeficiency, microthrombocytopenia, and eczema. T-cells play an important role in immune response in the skin and the γδT-cells have an important role in skin homeostasis. Since WAS patients often present with eczema, we wanted to examine whether the T-cell receptor gamma (TRG) repertoire of the γδT-cells is affected in these patients. In addition, the immunoglobulin heavy chain (IGH) repertoire from genomic DNA of WAS patients was not yet studied. Thus, we sought to determine the effects that specific WAS mutations from our patients have in shaping the TRG and IGH immune repertoires. We collected clinical and genetic data on four WAS patients, each harboring a different mutation in the WAS gene. Using next-generation sequencing (NGS), we analyzed their TRG and IGH repertoires using genomic DNA isolated from their peripheral blood. We analyzed the TRG and IGH repertoire sequences to show repertoire restriction, clonal expansions, preferential utilization of specific V genes, and unique characteristics of the antigen binding region in WAS patients with eczema compared to healthy controls. Both the TRG and IGH repertoire showed diverse repertoire comparable to healthy controls on one the hand, and on the other hand, the IGH repertoire showed increased diversity, more evenly distributed repertoire and immaturity of the antigen binding region. Thus, we demonstrate by analyzing the repertoire based on genomic DNA, the various effect that WAS mutations have in shaping the TRG and IGH adaptive immune repertoires.

Keywords: IGH repertoire; TRG repertoire; WAS; primary immunodeficiency.


Conflict of interest statement

The authors declare no competing interests.

Figures

Fig. 1
Fig. 1
Expression profile of the V gene families of the T cell receptor beta (TCR-Vβ) determined by FACS. The expression of 24 different variable gene families in the patients’ CD3+ T-cells (black bars; W1–W4) were determined by flow cytometry and compared with healthy controls provided by the kit (white bars; n = 85). Asterisks mark Vβ expressions that are two standard deviation above or below that average of controls
Fig. 2
Fig. 2
Description of WAS mutations. A Schematic presentation of the secondary structure of the WASP protein with its functional domains; EVH1, Ena/Vasp homology 1 domain; B, basic domain; GBD, GTPase-binding domain; PPP, proline-rich region; V, verprolin-like domain (aka WH2, WASP homology 2 domain); C, central/connecting domain; A, acidic domain. Specific mutation for each of the patients (W1-W4) are positioned according to scale in the WASP protein schematic diagram. B Multiple alignments of WASP protein region of the missense and nonsense mutations defined in patients W1 and W2, where the specific amino acid that is mutated is boxed. C Schematic presentation of the strategy to amplify the inclusion of intron 8 because of the mutation at the splice donor site. The product of reverse transcription-polymerase chain reaction (RT-PCR) was subjected to gel-electrophoresis and the resulting shorter product for healthy control and higher product for the patient W3 is shown. D The bands observed above were purified and sequenced and the chromatogram of Sanger sequencing shows the inclusion of intro 8 in the RNA transcript of the patient W3. E The expression of WASP protein in patients W1, W3, and W4 determined on CD3+ T-cells using flow cytometry
Fig. 3
Fig. 3
The TRG repertoire diversity in WAS patients. A Hierarchical Treemaps graphically representing the overall TRG repertoire in four WAS patients and one representative pediatric control. Scatter dot plot presenting the unique (B) and total (C) number of sequences in four WAS patients and pediatric controls (n = 3). Scatter dot plot presenting the diversity indices of Shannon’s H (D) and Simpson’s D (E) in four WAS patients and pediatric controls (n = 3). F Frequency graph presenting the top 100 most abundant clones in four WAS patients and pediatric controls (n = 3). The p-values are for one-tailed Student’s t-test and whiskers in the graphs (B–F) present standard error (± SE)
Fig. 4
Fig. 4
TRGV gene usages and CDR3 region of TRG repertoire in WAS patients. Bar graph representing the average of three pediatric controls (± SE) and four WAS patients for the unique (A) and total (B) sequences. Simplified heatmap presenting Z-scores for the TRGV genes in unique (C) and total (D) sequences. The red squares represent Z-scores of 2 and above and blue represents Z-scores of − 2 and below. Distribution of the CDR3 region lengths in percentages of unique (E) and total (F) sequences, where bar graph represents the patients and line graph with ± SE represents the controls. Scatter dot plots comparing the average CDR3 length between controls and patients in unique (G) and total (H) sequences. The p-values are for one-tailed Student’s t-test and whiskers in the graphs present standard error (± SE) (G and H)
Fig. 5
Fig. 5
The IGH repertoire diversity in WAS patients. A Hierarchical Treemaps graphically representing the overall IGH repertoire in four WAS patients and one representative pediatric control. Scatter dot plot presenting the unique (B) and total (C) number of sequences in four WAS patients and pediatric controls (n = 3). Scatter dot plot presenting the diversity indices of Shannon’s H (D) and Simpson’s D (E) in four WAS patients and pediatric controls (n = 3). F Frequency graph presenting the top 100 most abundant clones in four WAS patients and pediatric controls (n = 3). The p-values are for one-tailed Student’s t-test and whiskers in the graphs (B–F) present standard error (± SE)
Fig. 6
Fig. 6
IGHV gene usages of IGH repertoire in WAS patients. Bar graph representing the average of three pediatric controls (± SE) and four WAS patients for the unique (A) and total (B) sequences. Simplified heatmap presenting Z-scores for the IGHV genes in unique (C) and total (D) sequences. The red squares represent Z-scores of 2 and above and blue represents Z-scores of − 2 and below
Fig. 7
Fig. 7
The CDR3 region of IGH repertoire in WAS patients. Distribution of the CDR3 region lengths in percentages of unique (A) and total (B) sequences, where bar graph represents the patients and line graph with ± SE represents the controls. C Scatter dot plots comparing the average CDR3 length between controls and patients in unique and total sequences. D Scatter dot plots comparing the pid-scores between controls and patients in unique and total sequences. The p-values are for one-tailed Student’s t-test and whiskers in the graphs present standard error (± SE) (C and D)

Similar articles

References

    1. Aldrich RA, Steinberg AG, Campbell DC. Pedigree demonstrating a sex-linked recessive condition characterized by draining ears, eczematoid dermatitis and bloody diarrhea. Pediatrics. 1954;13(2):133–139. doi: 10.1542/peds.13.2.133. - DOI - PubMed
    1. Thrasher AJ. WASp in immune-system organization and function. Nat Rev Immunol. 2002;2(9):635–646. doi: 10.1038/nri884. - DOI - PubMed
    1. Jin YY, Wu J, Chen TX, Chen J. When WAS gene diagnosis is needed: seeking clues through comparison between patients with Wiskott-Aldrich syndrome and idiopathic thrombocytopenic purpura. Front Immunol. 2019;10:1549. doi: 10.3389/fimmu.2019.01549. - DOI - PMC - PubMed
    1. Bouma G, Burns SO, Thrasher AJ. Wiskott-Aldrich syndrome: immunodeficiency resulting from defective cell migration and impaired immunostimulatory activation. Immunobiology. 2009;214(9–10):778–790. doi: 10.1016/j.imbio.2009.06.009. - DOI - PMC - PubMed
    1. Simon HU, Mills GB, Hashimoto S, Siminovitch KA. Evidence for defective transmembrane signaling in B cells from patients with Wiskott-Aldrich syndrome. J Clin Investig. 1992;90(4):1396–1405. doi: 10.1172/JCI116006. - DOI - PMC - PubMed

Publication types

Substances