. 2022 Aug 31;18(8):e1010726.
doi: 10.1371/journal.ppat.1010726. eCollection 2022 Aug.

HIV infected CD4+ T cell clones are more stable than uninfected clones during long-term antiretroviral therapy

Affiliations

HIV infected CD4+ T cell clones are more stable than uninfected clones during long-term antiretroviral therapy

Shuang Guo et al. PLoS Pathog. .

Abstract

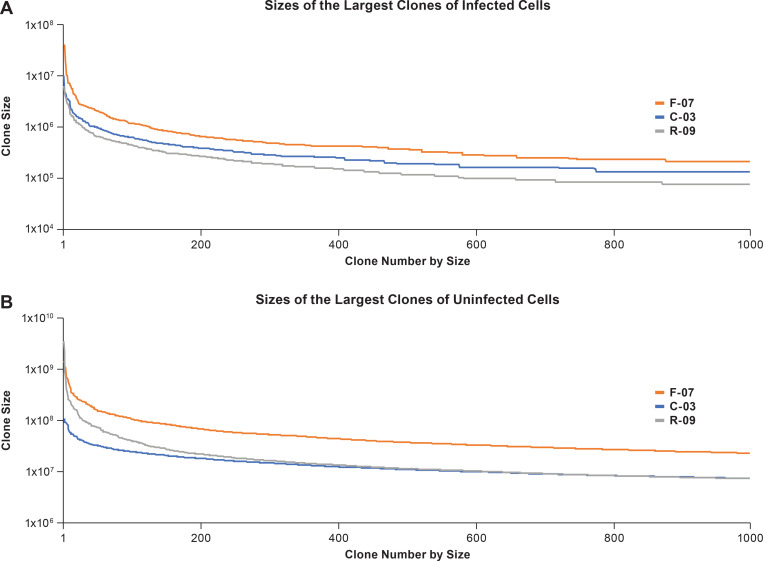
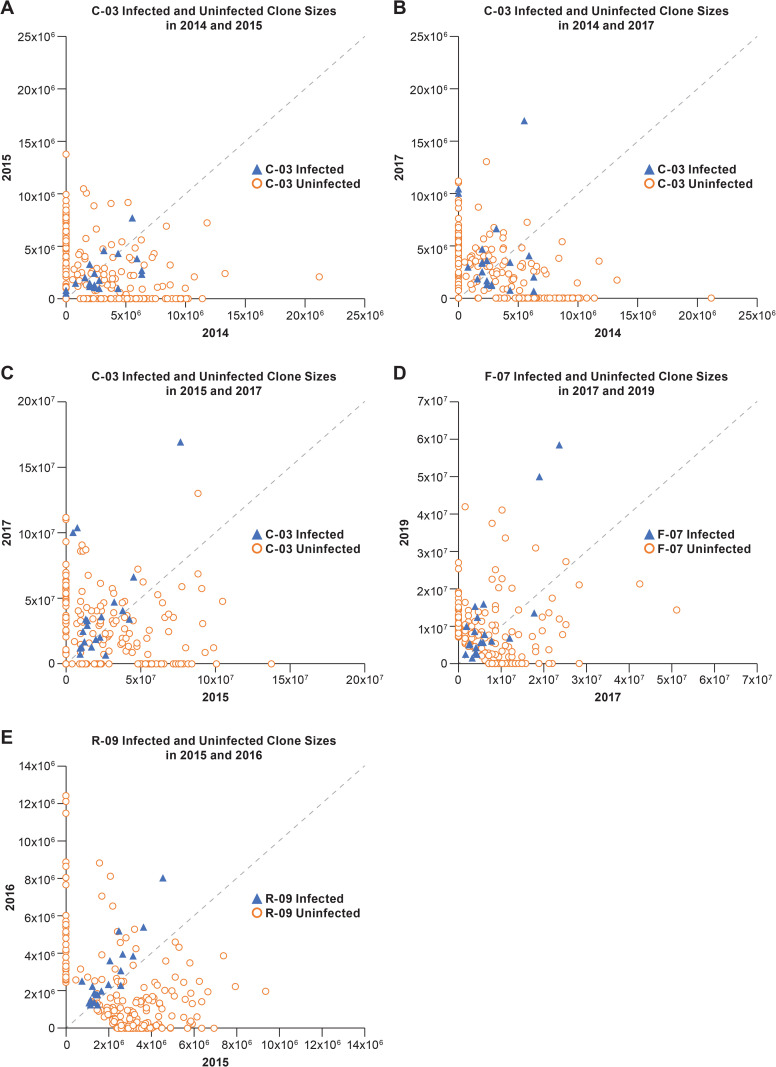
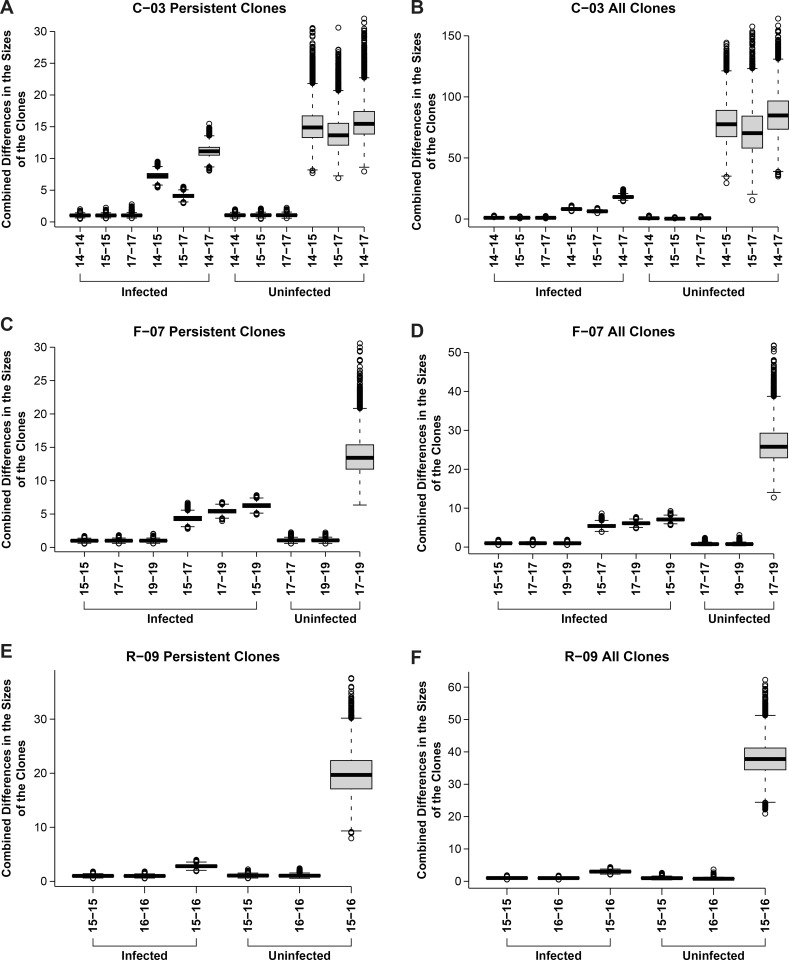
Although combination antiretroviral therapy (ART) blocks HIV replication, it is not curative because infected CD4+ T cells that carry intact, infectious proviruses persist. Understanding the behavior of clones of infected T cells is important for understanding the stability of the reservoir; however, the stabilities of clones of infected T cells in persons on long-term ART are not well defined. We determined the relative stabilities of clones of infected and uninfected CD4+ T cells over time intervals of one to four years in three individuals who had been on ART for 9-19 years. The largest clones of uninfected T cells were larger than the largest clones of infected T cells. Clones of infected CD4+ T cells were more stable than clones of uninfected CD4+ T cells of a similar size. Individual clones of CD4+ T cells carrying intact, infectious proviruses can expand, contract, or remain stable over time.


Conflict of interest statement

I have read the journal’s policy and the authors of this manuscript have the following competing interests: JWM is a consultant to Gilead Sciences and owns share options of Co-Crystal Pharmaceuticals and Infectious Disease Connect, and shares of Abound Bio, unrelated to the current work. All other authors declare they have no competing interests.

Figures

Fig 1
Fig 1. Sizes of the largest clones of infected and uninfected clones of CD4+ T cells in the three donors.
The sizes of the largest clones of infected cells were determined using the integration site data (available on the HIV DRP RID). The actual sizes of the individual clones were calculated based on the counts of CD4+ T cells for each of the donors, the fraction of the CD4+ T cells that were infected, and the fraction of the infected cells in each clone. Similarly, the sizes of the uninfected clones were calculated based on the number of CD4+ T cells, and the fraction of the total recovered TCR sequences that were obtained for each clone (see Methods). The clone sizes shown in the figures were determined by combining, for each of the donors, the data obtained from all the time points.
Fig 2
Fig 2. Scatter plots showing the stabilities of clones of infected and uninfected CD4+ T cells.
Each panel shows the sizes of the 20 largest clones of infected T cells (blue triangles) and the sizes of 200 clones of uninfected T cells of a similar size at two different times. The dotted line is the diagonal. Any clone whose size does not change between the time points shown on the axes would fall on this diagonal. Similarly, the change in the sizes of each of the clones can be measured by the distance from the diagonal. Each panel (A-E) shows a comparison for two time points; the donors and the times are noted in each of the panels.
Fig 3
Fig 3. Overall stabilities of clones of infected and uninfected T cells.
For each pair of time points for each donor, we determined the differences in the sizes of the each of clones in the dataset. For the comparisons of the differences in the sizes of the clones of infected cells, the 100 largest clones were used and the sizes of the clones were determined as described in the S1 Text. For the uninfected cells, a dataset of clones of a similar size was compiled, and the stability calculations were done using randomly sampled groups of 100 uninfected clones. The uncertainties in the measured sizes of the clones in each of the datasets was determined by doing a within dataset comparisons which are shown in the figure as comparisons for the same time points. The uncertainties within each of the datasets and between the datasets are shown both as a box plot (which shows the standard deviation) and as the 95% confidence limits (marked by horizontal lines separated by a dashed vertical line). The mean is the bar in the middle of the box plots. Any data from the 10,000 runs that falls outside the 95% confidence limits are shown as open circles. The method of calculating the uncertainties is described in the S1 Text. The size differences were combined to obtain a measure of the overall differences in the sizes of the group of clones for the time points being compared. The overall measure of the combined differences in the sizes of the clones, given on the Y axis, provide a good measure of the overall differences in the sizes of the clones, but the numbers on the Y axis do represent a simple metric.

References

    1. Maldarelli F, Wu X, Su L, Simonetti FR, Shao W, Hill S, et al.. HIV latency. Specific HIV integration sites are linked to clonal expansion and persistence of infected cells. Science. 2014;345(6193):179–83. doi: 10.1126/science.1254194 - DOI - PMC - PubMed
    1. Wagner TA, McLaughlin S, Garg K, Cheung CY, Larsen BB, Styrchak S, et al.. HIV latency. Proliferation of cells with HIV integrated into cancer genes contributes to persistent infection. Science. 2014;345(6196):570–3. doi: 10.1126/science.1256304 - DOI - PMC - PubMed
    1. Bruner KM, Murray AJ, Pollack RA, Soliman MG, Laskey SB, Capoferri AA, et al.. Defective proviruses rapidly accumulate during acute HIV-1 infection. Nat Med. 2016;22(9):1043–9. doi: 10.1038/nm.4156 - DOI - PMC - PubMed
    1. Simonetti FR, Sobolewski MD, Fyne E, Shao W, Spindler J, Hattori J, et al.. Clonally expanded CD4+ T cells can produce infectious HIV-1 in vivo. Proc Natl Acad Sci U S A. 2016;113(7):1883–8. doi: 10.1073/pnas.1522675113 - DOI - PMC - PubMed
    1. Halvas EK, Joseph KW, Brandt LD, Guo S, Sobolewski MD, Jacobs JL, et al.. HIV-1 viremia not suppressible by antiretroviral therapy can originate from large T cell clones producing infectious virus. J Clin Invest. 2020;130(11):5847–57. doi: 10.1172/JCI138099 - DOI - PMC - PubMed

Publication types