. 2022 Sep 6;119(36):e2204835119.
doi: 10.1073/pnas.2204835119. Epub 2022 Aug 31.

Amelioration of pathologic α-synuclein-induced Parkinson's disease by irisin

Affiliations

Amelioration of pathologic α-synuclein-induced Parkinson's disease by irisin

Tae-In Kam et al. Proc Natl Acad Sci U S A. .

Abstract

Physical activity provides clinical benefit in Parkinson's disease (PD). Irisin is an exercise-induced polypeptide secreted by skeletal muscle that crosses the blood-brain barrier and mediates certain effects of exercise. Here, we show that irisin prevents pathologic α-synuclein (α-syn)-induced neurodegeneration in the α-syn preformed fibril (PFF) mouse model of sporadic PD. Intravenous delivery of irisin via viral vectors following the stereotaxic intrastriatal injection of α-syn PFF cause a reduction in the formation of pathologic α-syn and prevented the loss of dopamine neurons and lowering of striatal dopamine. Irisin also substantially reduced the α-syn PFF-induced motor deficits as assessed behaviorally by the pole and grip strength test. Recombinant sustained irisin treatment of primary cortical neurons attenuated α-syn PFF toxicity by reducing the formation of phosphorylated serine 129 of α-syn and neuronal cell death. Tandem mass spectrometry and biochemical analysis revealed that irisin reduced pathologic α-syn by enhancing endolysosomal degradation of pathologic α-syn. Our findings highlight the potential for therapeutic disease modification of irisin in PD.

Keywords: Parkinson’s disease; irisin; neurodegeneration; synuclein.


Conflict of interest statement

Competing interest statement: B.M.S. holds issued and pending patents related to irisin and the treatment of neurodegenerative diseases. T.-I.K., H.K., B.M.S., and T.M.D. hold pending patents related to irisin and the treatment of Parkinson’s disease. B.M.S. is a co-founder of Aevum Therapeutics, Inc, which is developing irisin for therapeutics of neurodegeneration. C.D.W. holds a patent related to irisin (WO2015051007A1) and is an academic co-founder and consultant for Aevum Therapeutics. C.D.W. has a financial interest in Aevum Therapeutics, a company developing drugs which harness the protective molecular mechanisms of exercise to treat neurodegenerative and neuromuscular disorders. C.D.W.’s interests were reviewed and are managed by Massachusetts General Hospital and Mass General Brigham in accordance with their conflict-of-interest policies. The other authors declare no competing interests.

Figures

Fig. 1.
Fig. 1.
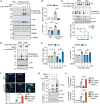
Irisin protects neurons against α-syn PFF neurotoxicity. (A) Representative images of pS129-α-syn (green) in primary cortical neurons preincubated for 1 h followed by sustained treatment with indicated concentration of irisin, and further incubated with α-syn PFF (1 μg/mL) for 7 d. DAPI (blue) was used for nuclei staining. (Scale bar, 20 μm.) (B) Quantification of p-α-syn signals in (A) normalized with DAPI. Bars represent mean ± SEM. One-way ANOVA followed by Tukey’s post hoc test (n = 3). (C) Representative immunoblots of pS129-α-syn and α-syn in the Triton X-100-soluble and insoluble fraction from primary cortical neurons preincubated for 1 h followed by sustained treatment with indicated concentration of irisin followed by incubation with α-syn PFF for 7 d. (D) Quantification of levels of pS129-α-syn and α-syn in the Triton X-100-insoluble fraction normalized to β-actin shown in (C). Bars represent mean ± SEM. One-way ANOVA followed by Tukey’s post hoc test (n = 4). (E) Cell death assay quantified from Hoechst and propidium iodide (PI) staining in primary cortical neurons treated for 1 h followed by sustained treatment with indicated concentration of irisin and further incubated with α-syn PFF (5 μg/mL) for 14 d. Bars represent mean ± SEM. Two-way ANOVA followed by Tukey’s post hoc test (n = 4). (F) Cell death assay quantified from Hoechst and propidium iodide (PI) staining in primary cortical neurons preincubated 1 h followed by sustained treatment with irisin (50 ng/mL) and further incubated with α-syn PFF (5 μg/mL) for 14 d as well as delayed treatment (1 d, 2 d, 4 d, and 7 d) after α-syn PFF treatment. Bars represent mean ± SEM. One-way ANOVA followed by Tukey’s post hoc test (n = 4). *P < 0.05, **P < 0.005, ***P < 0.0005.
Fig. 2.
Fig. 2.
Irisin protects α-syn PFF-induced pathology in vivo. (A) Diagram of in vivo experiments. Two-month-old WT mice were injected with PBS or α-syn PFF (5 μg/mouse) into the striatum. Two weeks after α-syn PFF injection, the mice were injected with AAV8-GFP or AAV8-Irisin-FLAG (1E10 G.C./mouse) via the tail vein. The mice were subjected to behavioral test (pole test and grip strength test), stereology and biochemical analysis 6 mo after α-syn PFF injection. (B) Representative TH and Nissl staining of SNpc DA neurons of PBS or α-syn PFF injected mice treated with AAV-GFP or AAV-Irisin. (Scale bars, 400 μm.) (C, D) Stereological counts of (C) TH+ and (D) TH+/Nissl+ cells. Data are mean ± SEM. Two-way ANOVA followed by Tukey’s post hoc test (n = 5 mice per group). i = ipsilateral, c = contralateral. (E) Representative immunoblots and quantification of TH and DAT in the ipsilateral striatum of injected mice. Bars represent the mean ± SEM. Two-way ANOVA followed by Tukey’s post hoc test (n = 4). (F) DA concentrations in the striatum of PBS or α-syn PFF injected mice treated with AAV-GFP or AAV-Irisin determined by HPLC. Bars represent mean ± SEM. Two-way ANOVA followed by Tukey’s post hoc test. (n = 7 mice per group). (G) Representative immunoblots of pS129-α-syn and α-syn in the detergent-soluble and insoluble fraction from the SNpc of injected mice. (H) Quantification of pS129-α-syn and α-syn levels in the detergent-insoluble fraction normalized to β-actin. Bars represent mean ± SEM. Two-way ANOVA followed by Tukey’s post hoc test (n = 3). (I, J) Pole test (I) and grip strength (J) test were performed 6 mo after PBS or α-syn PFF injection. Data are the mean ± SEM *P < 0.05, ***P < 0.0005, two-way ANOVA followed by Tukey’s post hoc test (n = 12–13 mice per group). *P < 0.05, **P < 0.005, ***P < 0.0005.
Fig. 3.
Fig. 3.
Irisin reduces the α-syn levels. (A) Schematic diagram of proteomic analysis. (B, C) Volcano plot of protein alterations. The proteins quantified from primary cortical neurons with or without preincubation of irisin (50 ng/mL) and further incubated with α-syn PFF (1 μg/mL) for (B) one or (C) 4 d were analyzed for differentially expressed proteins in PFF- and irisin-treated cells. The cutoff used to select differentially expressed proteins was q-value < 0.05. (D, E) Relative protein levels of (D) ApoE and (E) Snca in primary cortical neurons 1 and 4 d after PBS, α-syn PFF, or α-syn PFF with irisin administration analyzed by mass spec. Bars represent mean ± SEM. Two-way ANOVA followed by Tukey’s post hoc test (n = 3). (F) Representative immunoblots of pS129-α-syn, α-syn and α-syn-biotin in the detergent- insoluble and soluble fraction from cortical neurons 1 and 4 d after treatment. (G) Quantification of α-syn-biotin and α-syn levels in the detergent-soluble fraction normalized to β-actin. Bars represent mean ± SEM. Two-way ANOVA followed by Tukey’s post hoc test (n = 3). *P < 0.05, **P < 0.005, ***P < 0.0005. ND, not determined; ns, not significant.
Fig. 4.
Fig. 4.
Irisin increases the degradation of pathologic α-syn. (A, B) Primary cortical neurons from WT embryos were pretreated with 50 ng/mL Irisin for 1 h and further incubated with biotin-conjugated α-syn PFF (1 μg/mL) for 24 h. The levels of α-syn-biotin and α-syn in the endolysosome-enriched fraction were determined by immunoblotting using anti-streptavidin and an anti-α-syn antibody, respectively. Rab7 is a marker for endosome, Lamp2 is a marker for lysosome, HSP60 is a marker for mitochondria, and α-tubulin is a marker for cytoplasm. Bars represent mean ± SEM. Two-way ANOVA followed by Tukey’s post hoc test (n = 4). (C) Irisin promotes intracellular degradation of propagated α-syn PFF. Primary cortical neurons were pretreated with 50 ng/mL Irisin for 1 h and further incubated with biotin-conjugated α-syn PFF (1 μg/mL) in the presence of 50 ng/mL irisin for 12 h followed by media replacement with 50 ng/mL irisin not containing α-syn PFF. Intracellular biotin-conjugated α-syn PFF levels were determined by immunoblotting using anti-streptavidin antibody 3, 6, and 12 h after changing to fresh medium containing 50 ng/mL irisin. Graph represents mean ± SEM. Two-way ANOVA followed by Tukey’s post hoc test (n = 3). (D, E) Propagated α-syn PFF is degraded by the lysosome. Primary cortical neurons were pretreated with 50 ng/mL Irisin for 1 h and further incubated with biotin-conjugated α-syn PFF (1 μg/mL) for 12 h, followed by the fresh medium or medium containing NH4Cl was replaced for 3 h. The levels of α-syn-biotin and α-syn were determined by immunoblotting using anti-streptavidin and α-syn antibodies, respectively. Graph represents mean ± SEM. Two-way ANOVA followed by Tukey’s post hoc test (n = 3). (F) Representative microscopic images of pS129-α-syn (green) in primary cortical neurons treated with α-syn PFF (1 μg/mL) for 4 d. Two days after α-syn PFF treatment, irisin and NH4Cl were incubated for 2 d. DAPI (blue) is used for nuclei staining. (Scale bar, 20 μm.) Quantification of p-α-syn signals was normalized with DAPI. Bars represent mean ± SEM. One-way ANOVA followed by Tukey’s post hoc test (n = 3). (G) Representative immunoblots of pS129-α-syn and α-syn in the detergent-soluble and insoluble fraction from primary cortical neurons incubated with α-syn PFF for 4 d followed by posttreated with irisin and NH4Cl for 2 d. (H) Quantification of pS129-α-syn and α-syn levels in the detergent-insoluble fraction normalized to β-actin. Bars represent mean ± SEM. One-way ANOVA followed by Tukey’s post hoc test (n = 4). *P < 0.05, **P < 0.005, ***P < 0.0005. ND, not determined; ns, not significant.

References

    1. Berardelli A., Rothwell J. C., Thompson P. D., Hallett M., Pathophysiology of bradykinesia in Parkinson’s disease. Brain 124, 2131–2146 (2001). - PubMed
    1. Jankovic J., Parkinson’s disease: Clinical features and diagnosis. J. Neurol. Neurosurg. Psychiatry 79, 368–376 (2008). - PubMed
    1. Asahina M., Vichayanrat E., Low D. A., Iodice V., Mathias C. J., Autonomic dysfunction in parkinsonian disorders: Assessment and pathophysiology. J. Neurol. Neurosurg. Psychiatry 84, 674–680 (2013). - PubMed
    1. Giguère N., Burke Nanni S., Trudeau L. E., On cell loss and selective vulnerability of neuronal populations in Parkinson’s disease. Front. Neurol. 9, 455 (2018). - PMC - PubMed
    1. Mehra S., Sahay S., Maji S. K., α-Synuclein misfolding and aggregation: Implications in Parkinson’s disease pathogenesis. Biochim. Biophys. Acta. Proteins Proteomics 1867, 890–908 (2019). - PubMed

Publication types