. 2022 Sep 6;119(36):e2206559119.
doi: 10.1073/pnas.2206559119. Epub 2022 Aug 31.

Brain-wide functional connectivity of face patch neurons during rest

Affiliations

Brain-wide functional connectivity of face patch neurons during rest

Daniel Zaldivar et al. Proc Natl Acad Sci U S A. .

Abstract

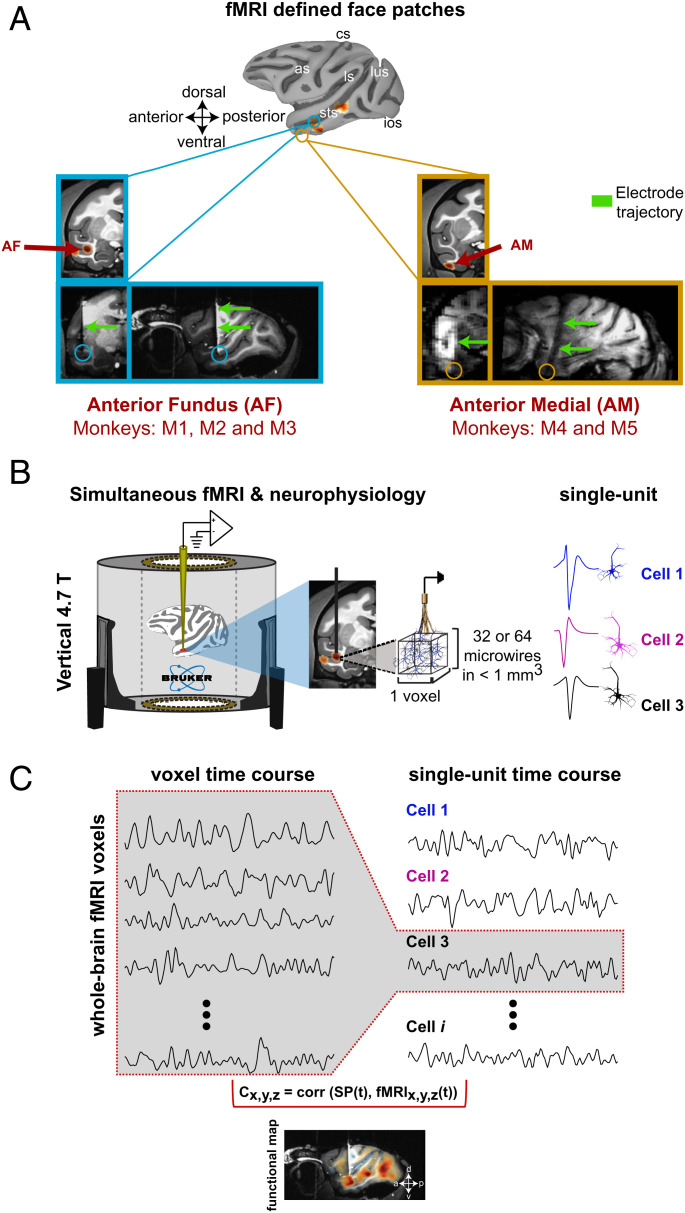
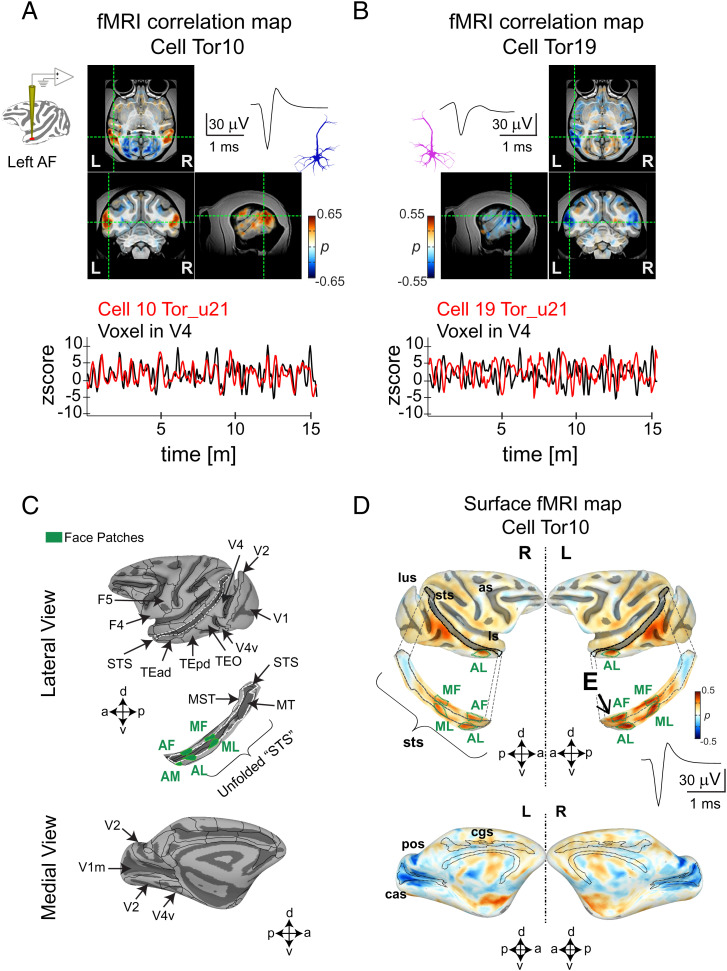
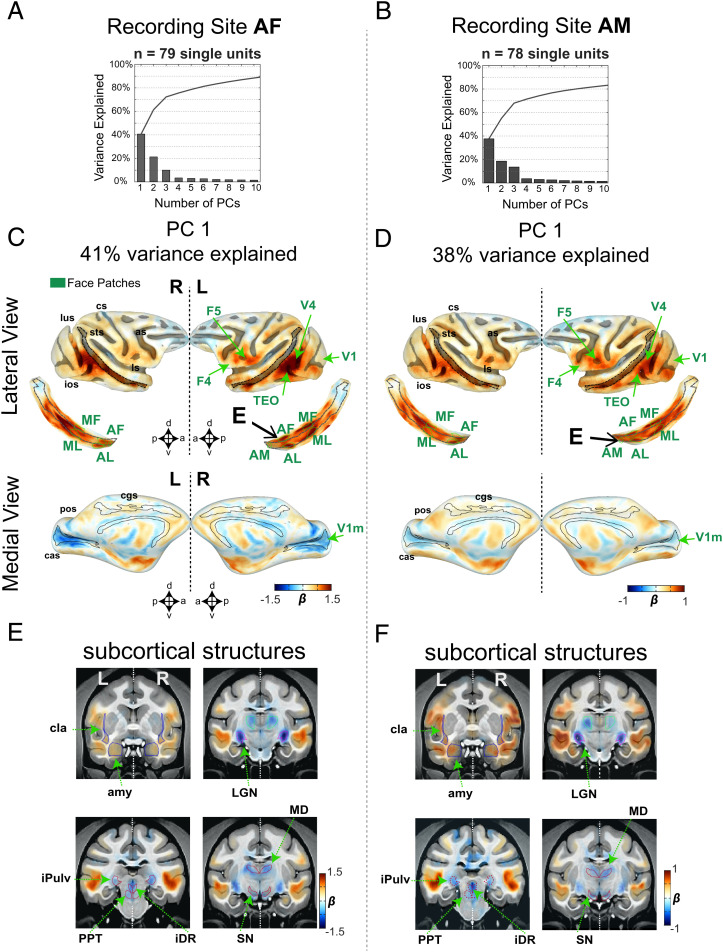
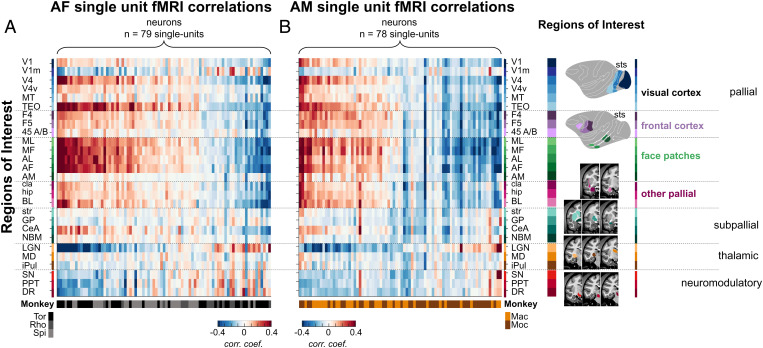
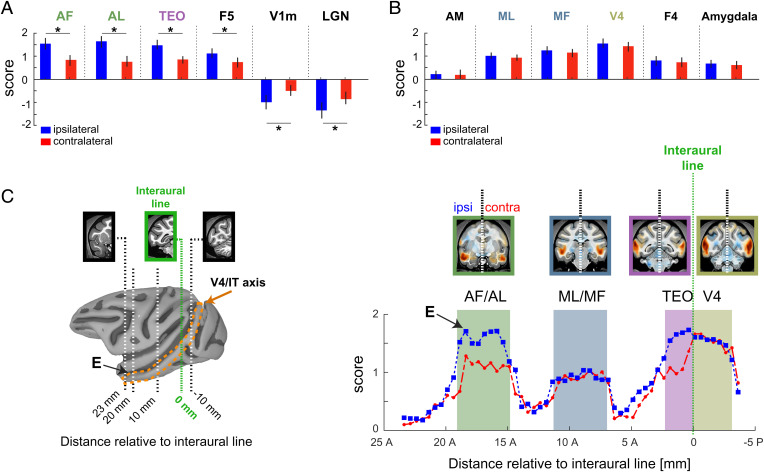
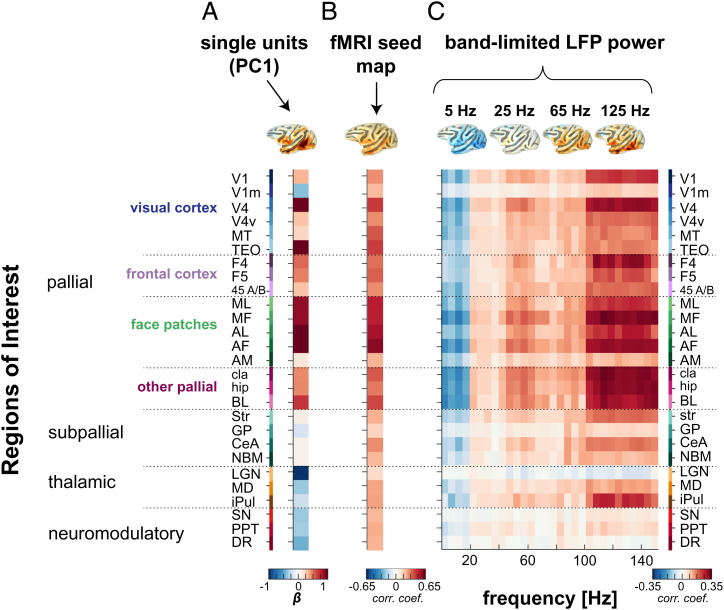
The brain is a highly organized, dynamic system whose network architecture is often assessed through resting functional magnetic resonance imaging (fMRI) functional connectivity. The functional interactions between brain areas, including those observed during rest, are assumed to stem from the collective influence of action potentials carried by long-range neural projections. However, the contribution of individual neurons to brain-wide functional connectivity has not been systematically assessed. Here we developed a method to concurrently measure and compare the spiking activity of local neurons with fMRI signals measured across the brain during rest. We recorded spontaneous activity from neural populations in cortical face patches in the macaque during fMRI scanning sessions. Individual cells exhibited prominent, bilateral coupling with fMRI fluctuations in a restricted set of cortical areas inside and outside the face patch network, partially matching the pattern of known anatomical projections. Within each face patch population, a subset of neurons was positively coupled with the face patch network and another was negatively coupled. The same cells showed inverse correlations with distinct subcortical structures, most notably the lateral geniculate nucleus and brainstem neuromodulatory centers. Corresponding connectivity maps derived from fMRI seeds and local field potentials differed from the single unit maps, particularly in subcortical areas. Together, the results demonstrate that the spiking fluctuations of neurons are selectively coupled with discrete brain regions, with the coupling governed in part by anatomical network connections and in part by indirect neuromodulatory pathways.

Keywords: brain networks; face patches; resting state; simultaneous fMRI and neurophysiology; single units.


Conflict of interest statement

The authors declare no competing interest.

Figures

Fig. 1.
Fig. 1.
Single unit fMRI experiments in the resting macaque. (A) Location of the fMRI-defined face patches from which single units were recorded. Top: macaque cortical surface depicting the location of face selective areas (see also SI Appendix, Fig. S1 for an example of the block design stimulus presentation): as, arcuate sulcus; cs, central sulcus; ios, inferior occipital sulcus; ls, lateral sulcus; lus, lunate sulcus; sts, superior temporal sulcus. Structural MRI and functional overlay showing activation in voxels corresponding to the face patch AF (anterior fundus in monkey M1; blue box) and AM (anterior medial in monkey M4; yellow box). Coronal (Left) and sagittal (Right) T1-weighted anatomical images depicting the electrode location corresponding to AM (yellow box) and AF (blue box). Electrode trajectory is indicated by the green arrows. Below the animal identifications for each face patch recordings are listed. (B) fMRI and neurophysiology experiments were conducted simultaneously inside a 4.7-T vertical scanner wherein monkeys were resting and with no sensory stimulus. Neurophysiological recordings were carried out with bundles of either 32 or 64 MR-compatible microwires chronically implanted in a face patch. (C) Example of time courses from fMRI voxel activity (Left) and single unit spiking fluctuations (Right). We compared single unit time series with the voxel time courses throughout the brain. A representative example of single unit fMRI correlation map is shown on a sagittal section. Color encodes the Spearman’s rank correlation coefficient from each voxel across voxels in the whole brain.
Fig. 2.
Fig. 2.
Examples of two single unit functional maps from neurons in the macaque AF face patch. fMRI maps (Top Panel) obtained from (A) cell Tor10 and (B) cell Tor19. The two example cells were recorded from the left hemisphere in monkey M1 during the same scan session (u21). The activation maps from these cells are displayed in the axial, coronal, and sagittal planes and are accompanied by their respective spike waves. Scale bar, 30 mV, 1 ms. Overlaid color maps represent the Spearman’s rank correlation coefficients for each voxel. Time series (Bottom Panel) corresponding to (A) cell Tor10 and to (B) cell Tor19 (both shown in red) are compared with the activity of an fMRI voxel time series (black). The location of the voxel time series is indicated by the dotted green lines on each plane (see also SI Appendix, Fig. S2 A and B for the whole brain functional maps corresponding to these cells). (C) Lateral (Top Panel) and medial (Bottom Panel) views of a macaque surface depicting the location of cortical regions relevant to the current study. Boundaries of functionally defined face patches are superimposed (green) in an unfolded STS. Abbreviations for face patches: AL, anterior lateral; MF, middle fundus; ML, middle lateral. (D), Averaged single unit functional map (n = 12 scans, 30 m each, total scan time 6 h), accompanied by the corresponding spike wave from cell Tor10 is plotted in the lateral (Top) and medial (Bottom) view of the cortical surface: as, arcuate sulcus; cas, calcarine sulcus; ios, inferior occipital sulcus; ls, lateral sulcus; lus, lunate sulcus; pos, parieto-occipital sulcus; cgs, cingulate sulcus; sts, superior temporal sulcus (see also SI Appendix, Fig. S2C for the functional maps stability across days). Activity in face patches is depicted in the unfolded STS surface where “E” indicates the electrode location.
Fig. 3.
Fig. 3.
Population single unit fMRI response. Results from PCA across all neurons recorded in AF (n = 79 single units) and AM (n = 78 single units). Explained variance as a function of the number of principal components (PCs) for recordings in (A) AF and (B) AM. Functional activation maps corresponding to (C) recordings in AF and (D) recordings in AM are shown in the lateral (Top; along with the corresponding unfolded STS) and medial (Bottom) views of cortical surfaces. Cortical regions with strong association to the spiking activity are indicated by the green arrows. “E” indicates the location of the recording electrode. Functional activity in subcortical regions corresponding to (E) the first PC in AF and to (F) the first PC in AM. As in C and D, green arrows indicate subcortical regions with a strong correspondence to the spiking activity (see also SI Appendix, Figs. S4 and S5 for all individual single unit fMRI maps in each monkey and SI Appendix, Fig. S8 for ROI names). amy, amygdala; cla, claustrum; iPulv, inferior pulvinar; MD, mediodorsal thalamus. See SI Appendix, Figs. S6 and S7 for results corresponding to the second and third PCs.
Fig. 4.
Fig. 4.
Similarity of single unit fMRI activation maps for AF and AM. fMRI correlation profiles across 27 functional regions of interest for each recorded single unit in (A) AF and in (B) AM. Each column (n = 157) represents a vector of 27 correlation coefficients from one neuron. All neurons are grouped based on their correlation profile similarity and monkeys from which they were collected. ROIs are listed and color coded according to their anatomical locations within the subdivisions of the standard developmental anatomical brain (Right), namely pallium (including visual areas, face patches, frontal areas; BL, basolateral amygdala; hip, hippocampus), subpallium (CeA, central amygdala; GP, globus pallidum; NBM, nucleus basalis of Meynert; str, striatum), thalamus (iPul, inferior pulvinar), and brainstem neuromodulatory centers (DR, dorsal raphe). See SI Appendix, Fig. S3 for the proportion of cells with positive and negative correlation maps and SI Appendix, Fig. S8 for the ROI names and their spatial extent.
Fig. 5.
Fig. 5.
Interhemispheric differences in fMRI coupling to spiking activity from AF. Difference in functional activity between the recording hemisphere, or ipsilateral, and the contralateral hemisphere. (A) Comparison between the ipsilateral (shown in blue) and the contralateral (shown in red) hemispheres from regions showing a significant difference in the strength of fMRI association to the spiking activity. (B) Regions with no evident difference across the two hemispheres. (C) Distribution of the fMRI association strength to the spiking activity along the V4/IT axis (Right Panel). Shaded colored areas denote the relative spatial extent of visual cortical areas along V4/IT axis. The spatial extent of the V4/IT axis is indicated by the orange dotted lines in the cortical surface (Left Panel). X-axis in either panel depicts the coronal slice number relative to the interaural plane (dotted green line). “E” indicates the relative location of the recording electrode. See SI Appendix, Fig. S9 for results in AM.
Fig. 6.
Fig. 6.
Comparison between spiking, fMRI, and LFP activity from AF face patch. Profile of fMRI activations from (A) the population spiking activity with (B) the averaged correlation profile associated to the fMRI seed in AF (seed across n = 20 scans) and with (C) the correlation profiles across different LFP frequency bands, where each column represents a vector of 27 correlations across LFP frequencies spaced by 5 Hz each (n = 30 columns representing 30 LFP frequencies). The correlation profiles are accompanied by their corresponding functional map plotted on a brain surface (Top Panel). The listed ROIs are ordered similarly as in Fig. 4 (see SI Appendix, Fig. S8 for the ROI names and their spatial extent; also see SI Appendix, Fig. S10 for functional maps corresponding to each signal modality and SI Appendix, Fig. S11 for results in AM).

References

    1. Leopold D. A., et al. ., Functional architecture of the cerebral cortex. Strungmann Forum Rep. 27, 141–164 (2019).
    1. McCormick D. A., Nestvogel D. B., He B. J., Neuromodulation of brain state and behavior. Annu. Rev. Neurosci. 43, 391–415 (2020). - PubMed
    1. Cole M. W., Bassett D. S., Power J. D., Braver T. S., Petersen S. E., Intrinsic and task-evoked network architectures of the human brain. Neuron 83, 238–251 (2014). - PMC - PubMed
    1. Biswal B. B., et al. , Toward discovery science of human brain function. Proc. Natl. Acad. Sci. U.S.A. 107, 4734–4739 (2010). - PMC - PubMed
    1. Vincent J. L., et al. , Intrinsic functional architecture in the anaesthetized monkey brain. Nature 447, 83–86 (2007). - PubMed

Publication types

LinkOut - more resources