. 2022 Sep 6;119(36):e2206708119.
doi: 10.1073/pnas.2206708119. Epub 2022 Aug 31.

Disruption of mitochondria-sarcoplasmic reticulum microdomain connectomics contributes to sinus node dysfunction in heart failure

Affiliations

Disruption of mitochondria-sarcoplasmic reticulum microdomain connectomics contributes to sinus node dysfunction in heart failure

Lu Ren et al. Proc Natl Acad Sci U S A. .

Abstract

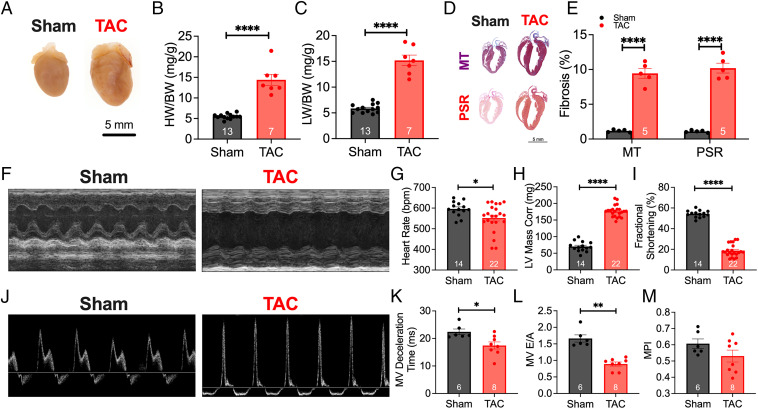
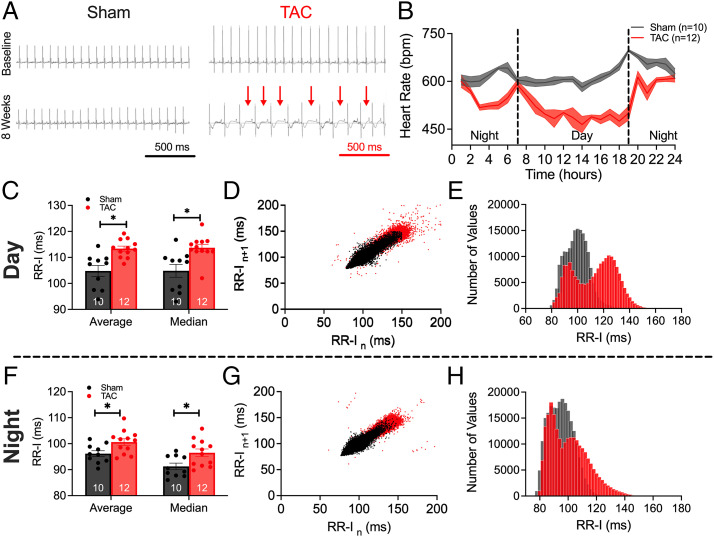
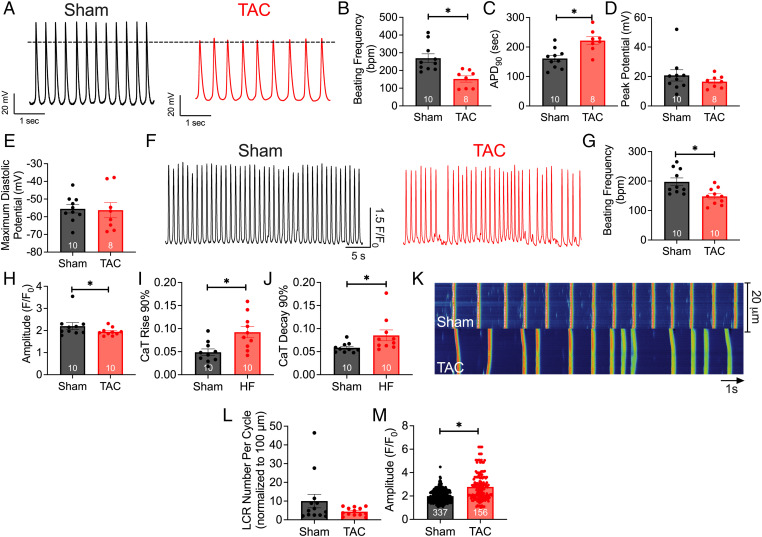
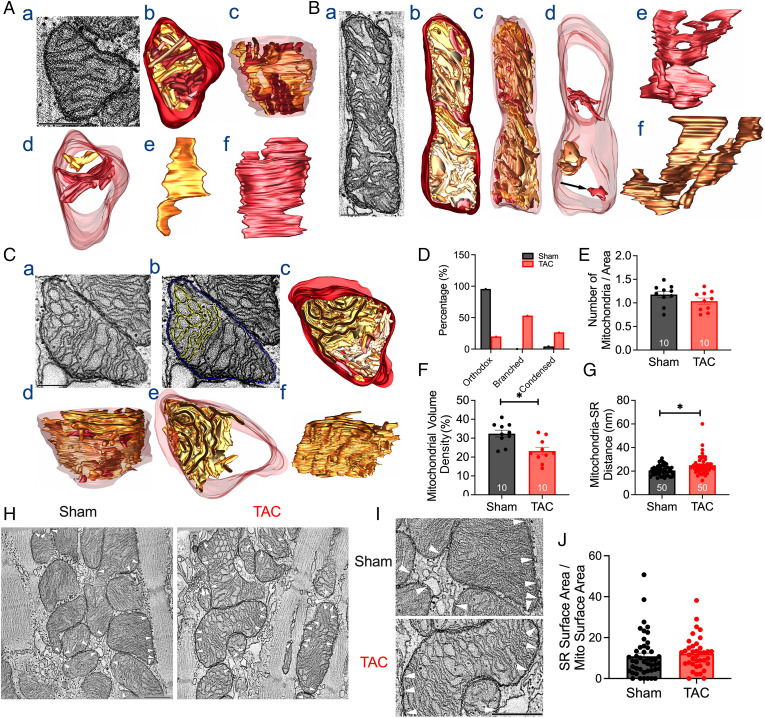
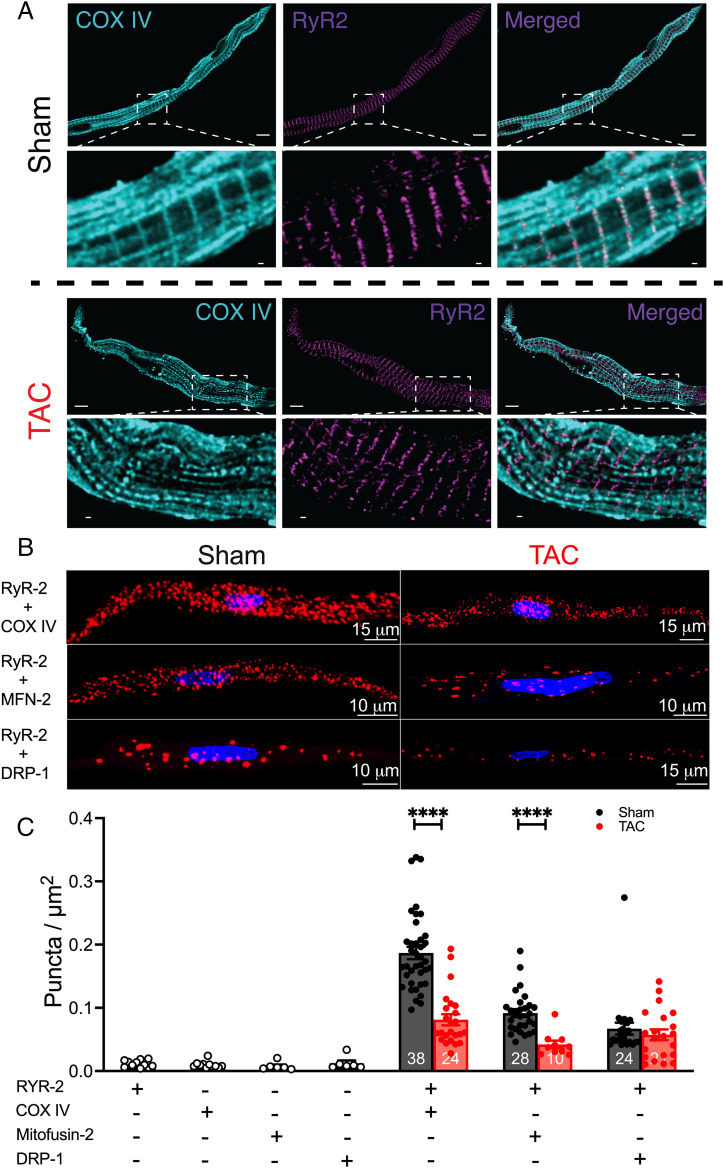
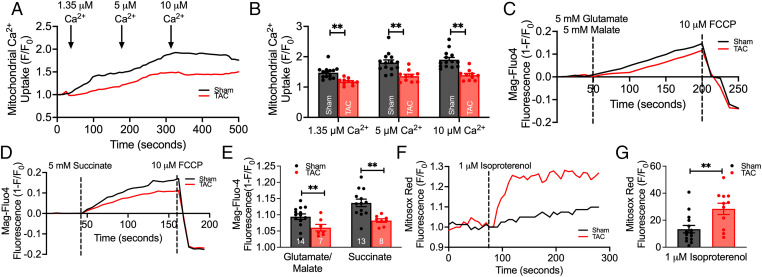
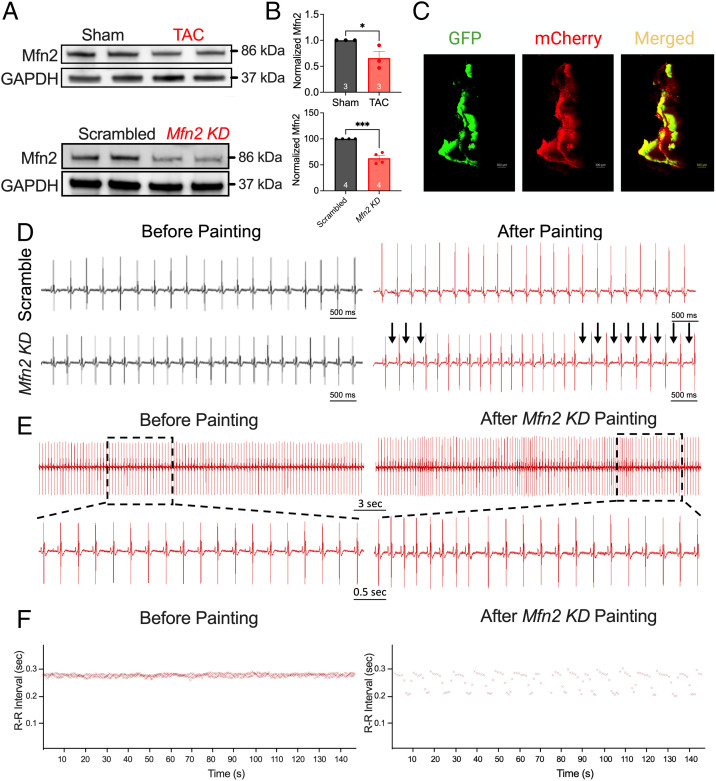
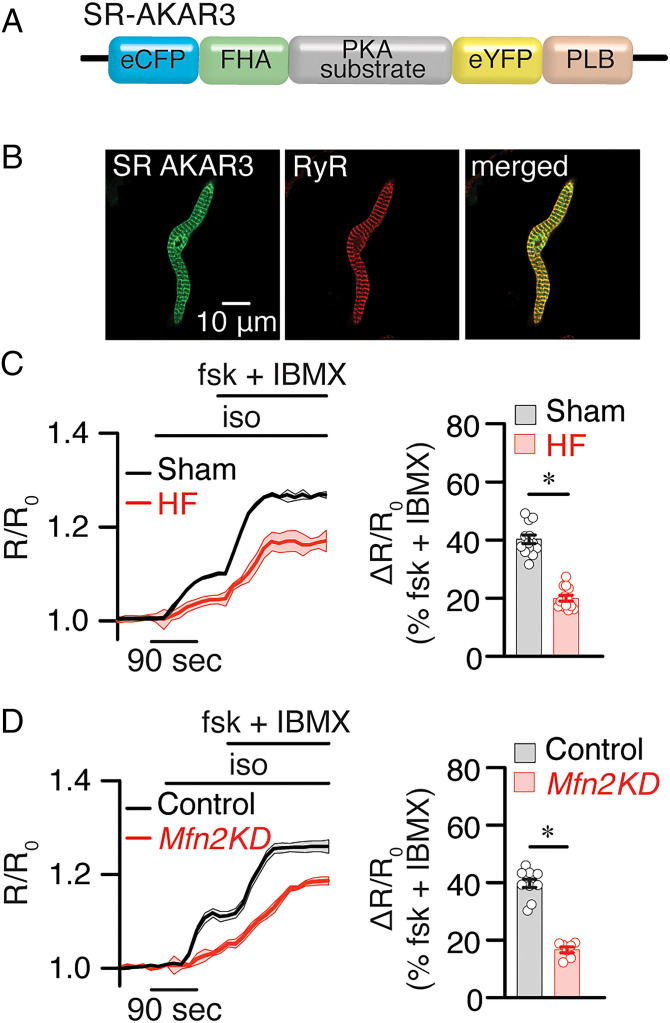
The sinoatrial node (SAN), the leading pacemaker region, generates electrical impulses that propagate throughout the heart. SAN dysfunction with bradyarrhythmia is well documented in heart failure (HF). However, the underlying mechanisms are not completely understood. Mitochondria are critical to cellular processes that determine the life or death of the cell. The release of Ca2+ from the ryanodine receptors 2 (RyR2) on the sarcoplasmic reticulum (SR) at mitochondria-SR microdomains serves as the critical communication to match energy production to meet metabolic demands. Therefore, we tested the hypothesis that alterations in the mitochondria-SR connectomics contribute to SAN dysfunction in HF. We took advantage of a mouse model of chronic pressure overload-induced HF by transverse aortic constriction (TAC) and a SAN-specific CRISPR-Cas9-mediated knockdown of mitofusin-2 (Mfn2), the mitochondria-SR tethering GTPase protein. TAC mice exhibited impaired cardiac function with HF, cardiac fibrosis, and profound SAN dysfunction. Ultrastructural imaging using electron microscope (EM) tomography revealed abnormal mitochondrial structure with increased mitochondria-SR distance. The expression of Mfn2 was significantly down-regulated and showed reduced colocalization with RyR2 in HF SAN cells. Indeed, SAN-specific Mfn2 knockdown led to alterations in the mitochondria-SR microdomains and SAN dysfunction. Finally, disruptions in the mitochondria-SR microdomains resulted in abnormal mitochondrial Ca2+ handling, alterations in localized protein kinase A (PKA) activity, and impaired mitochondrial function in HF SAN cells. The current study provides insights into the role of mitochondria-SR microdomains in SAN automaticity and possible therapeutic targets for SAN dysfunction in HF patients.

Keywords: bradycardia; heart failure; mitochondria; sinoatrial node; sinoatrial node dysfunction.


Conflict of interest statement

The authors declare no competing interest.

Figures

Fig. 1.
Fig. 1.
Transverse aortic constriction–induced heart failure. (A) Representative images of hearts taken 8 wk after the sham or TAC operations. (B and C) Summary data of heart weight–to–body weight (HW/BW) (B) and lung weight–to–body weight (LW/BW) (C) ratios are shown. (D) Cardiac sections were stained with Masson’s trichrome and Picrosirius red to assess collagen content, as depicted in the representative images. (E) Summary data of collagen deposition for both MT and PSR are shown. Conscious ECG was used to determine cardiac structure and function. (F) Representative M-mode images at the parasternal short axis are depicted. (GI) Summary data for heart rate (G), LV mass–corrected (H), and fractional shortening (I) are shown. (J) Representative images of blood flow through the MV, assessed using pulsed-wave Doppler ECG to quantify diastolic function. (KM) Quantification of MV deceleration time (K), MV E/A ratio (L), and myocardial performance index (MPI) (M) are depicted. Data are expressed as mean ± SEM. Gray and red bars are data from sham compared with TAC mice, respectively. *P < 0.05, **P < 0.01, and ****P < 0.0001. The numbers shown within the bar graphs represent the numbers of animals.
Fig. 2.
Fig. 2.
HF mice exhibited sinus bradycardia. (A) Representative ECG tracings during the 24-h recording periods at baseline and 8 wk for sham-operated and TAC mice. Red arrows indicate prolonged RR intervals. (B) Summary data of the time course of heart rates from 24-h ECG tracings showing the circadian rhythms. bpm, beats per minute. (CE) Summary data of average and median RR-I (C), scatterplots of HRV (D), and histograms of the distribution of RR-I in sham and TAC mice (E), measured for daytime hours. (FH) Similarly for nighttime in summary data of average and median RR-I (F), HRV (G), and histograms (H). Data are expressed as mean ± SEM. *P < 0.05. Numbers within the bar graphs represent numbers of animals.
Fig. 3.
Fig. 3.
HF SANCs exhibited reduced frequency of action potentials and impaired Ca2+ transients and local Ca2+ release. (A) Representative AP recordings from sham and HF SANCs. (B) Summary data of beating frequency (bpm). (CE) AP duration at 90% repolarization (C), maximum diastolic potential (D), and peak potentials (E). (F) Representative traces of Ca2+ transients from both groups are depicted. (GJ) Summary data of beating frequency (G), CaT amplitude (H), CaT rise at 90% maximum (I), and CaT decay from 90% maximum are shown (J). (K) Representative line scan images of Ca2+ transients and LCRs in diastole. (L and M) Summary data of numbers of LCRs per cycle normalized per 100 mm (L) and maximal amplitude of LCRs (M). Data are expressed as mean ± SEM. *P < 0.05. The numbers in the bar graphs represent the number of cells from three mice per group. Numbers in the bar graphs in M represent the total numbers of LCRs analyzed.
Fig. 4.
Fig. 4.
HF-induced morphological changes in SAN mitochondria. (A) Representative images of 3D reconstructions from EM tomography of a SAN mitochondrion from sham mice. Cristae are shown in various shades of brown, and the outer mitochondrial membrane (OMM) is shown in maroon. (a) The orthodox morphotype depicted here is a 1.6-nm-thick slice through the middle of a 400-nm-thick volume. (b) Top view of the surface-rendered volume of the mitochondrion after segmentation of the membranes. (c) Side view of the surface-rendered volume with the OMM made translucent. (d) Top view showing two representative cristae. (e and f) The two cristae are shown from the side. The second crista is wider and extends across the width of the mitochondrion for most of its height. (B) Representative images of 3D reconstructions of a SAN mitochondrion from TAC mice, showing a condensed mitochondrion. (a) The condensed type is shown here, with a 1.6-nm-thick slice through the middle of a 400-nm-thick volume. (b) Top view of the surface-rendered volume of the mitochondrion after segmentation of the membranes. (c) Side view of the surface-rendered volume of the OMM made translucent. (d) Top view showing three representative cristae. The top two are branched, with the lower of the two showing a portion of the top condensed (*). The arrow (Bottom) indicates the crista is a typically enlarged crista with no branching. (e and f) The top two cristae are shown from the side to emphasize their branching. (C) Representative images of 3D reconstructions of a SAN mitochondrion from TAC mice, showing a highly branched mitochondrion. (a) A 1.6-nm-thick slice through the middle of a 400-nm-thick volume shows the circular branching. (b) The same slice shows the extensive connectivity of a single crista (yellow). The OMM is in blue. (c) Top view of the surface-rendered volume of the mitochondrion after segmentation of the membranes. (d) Side view of the surface-rendered volume with the OMM made translucent. (e) The top view shows the highly branched crista to emphasize that it occupies roughly half of the mitochondrial volume. (f) Side view of the highly branched crista, which is seen to consist nearly entirely of connected lamella membranes. Scale bars in A–C represent 500 nm. Summary data of the percentage of mitochondria type (D), number of mitochondrial per area (E), mitochondrial volume (F), and mitochondria–SR distance are shown (G). (H) Representative EM images showing mitochondria–SR contact sites (white arrowheads) from sham and HF SANCs. (I) Enlarged portions of the EM images from H. (Scale bars, 500 nm [H and I].) (J) Summary data for SR contact surface area/mitochondria surface area for sham and HF SANCs (n = 46 and 37 mitochondria for sham and HF SANCs, respectively). Data are expressed as mean ± SEM. *P < 0.05.
Fig. 5.
Fig. 5.
HF reduced mitochondria and SR colocalization and disrupted mitochondria–SR microdomains. (A) Representative stimulated emission depletion microscopy images of sham and HF SANCs colabeled with RyR2 (purple) and COX IV (cyan). Two SANCs were seen in the sham group. (Scale bars, 5 μm [Upper] and 0.5 μm [enlarged images, Lower] for each group.) (B) PLA showing representative immunofluorescence confocal microscopy 3D rendered images, with PLA puncta (red) and DAPI (blue) from sham and HF SANCs, labeled with RyR2 + COX IV, RyR2 + Mfn2, and RyR2 + DRP-1. Positive cross-reactivity, which reflects an intermolecular distance of 40 nm or less, is detected as puncta, and the nuclei are depicted in blue. (C) Summary data of PLA fluorescent puncta per cell area (puncta per square micrometer) for the different combinations, including negative controls with one primary antibody. Data are represented as mean ± SEM. ****P < 0.0001. The symbols represent the number of cells within the bar graphs (n = 3 mice for each group).
Fig. 6.
Fig. 6.
Mitochondrial function was impaired in HF SANCs. (A) Representative traces of mitochondrial Ca2+ uptake (monitored by X-Rhod-1 fluorescence) from sham compared with HF SANCs, challenged with increasing extramitochondrial [Ca2+]. (B) Summary data of the normalized fluorescence intensity after perfusion of various Ca2+ concentrations are shown (n = 14 sham and n = 10 TAC SANCs). (C and D) Production of ATP was monitored using Mag-Fluo-4 after the perfusion with complex I (glutamate/malate; n = 14 sham and n = 10 TAC SANCs) (C) and complex II (succinate; n = 13 sham and n = 8 TAC SANCs) (D) substrates, as shown by the representative traces. (E) Summary data of Mag-Fluo-4 intensity after substrate application are displayed. (F) Measurement of ROS production was monitored using MitoSox red, as shown by the representative traces. (G) Summary data of ROS production after isoproterenol perfusion are shown (n = 15 sham and n = 11 TAC SANCs). Data are expressed as mean ± SEM. **P < 0.01.
Fig. 7.
Fig. 7.
SAN-specific Mfn KD mice exhibited SAN dysfunction. (A) Representative relative expression of Mfn2 in the SAN from sham and TAC mice and from scrambled and Mfn2 KD mice. GAPDH served as a loading control and was used to normalize the expression of Mfn2. (B) Summary data of normalized Mfn2 expression are displayed. (C) Representative images of GFP, mCherry, and merged signal of a SAN tissue, painted with an Mfn2 construct, from a GCaMP mouse. ECG recordings were then acquired from scrambled and Mfn2 painted mice. (D) Representative ECG traces from scrambled sequence compared with CRISPR-Cas9-Mfn2–mediated KD mice before (Left) and after (Right) SAN-specific painting, showing RR-I prolongation (arrows). (E) A closer examination of an Mfn2 KD mouse before and after painting surgery. (F) A representative RR-I over time. n = 6 for each group. Data are expressed as mean ± SEM. *P < 0.05, ***P < 0.001.
Fig. 8.
Fig. 8.
β-AR–induced cAMP signals at SR and OMM compartments were impaired in HF and Mfn2 KD SANCs. (A and B) Schematic of the SR-targeted FRET-based PKA reporter. Confocal images of SANs expressing SR-AKAR3 show the localization of the biosensor. (C and D) Time course of changes in the magnitude of normalized FRET responses (R/R0) in SANCs expressing SR-AKAR3 and OMM-AKAR3 upon application of β-AR agonist isoproterenol (iso, 100 nM) in the presence of the adenylyl cyclase activator forskolin (fsk) and phosphodiesterase inhibitor IBMX in sham and HF cells (C) or control and Mfn2 KD SANCs (D). Bar graphs that represent the maximal increases in the FRET ratio of these sensors are plotted. n ≥ 5 cells from three preparations per condition. Data represent the mean ± SEM. *P < 0.05 by Kruskal–Wallis with Dunn’s multiple comparisons.

References

    1. Metra M., Teerlink J. R., Heart failure. Lancet 390, 1981–1995 (2017). - PubMed
    1. Benjamin E. J., et al. ; American Heart Association Council on Epidemiology and Prevention Statistics Committee and Stroke Statistics Subcommittee, Heart disease and stroke statistics—2018 update: A report from the American Heart Association. Circulation 137, e67–e492 (2018). - PubMed
    1. Sanders P., Kistler P. M., Morton J. B., Spence S. J., Kalman J. M., Remodeling of sinus node function in patients with congestive heart failure: Reduction in sinus node reserve. Circulation 110, 897–903 (2004). - PubMed
    1. Mangoni M. E., Nargeot J., Genesis and regulation of the heart automaticity. Physiol. Rev. 88, 919–982 (2008). - PubMed
    1. Maltsev V. A., Lakatta E. G., Normal heart rhythm is initiated and regulated by an intracellular calcium clock within pacemaker cells. Heart Lung Circ. 16, 335–348 (2007). - PMC - PubMed

Publication types

MeSH terms

Substances