. 2022 Sep 2;8(35):eabn8092.
doi: 10.1126/sciadv.abn8092. Epub 2022 Aug 31.

Ventromedial hypothalamic OGT drives adipose tissue lipolysis and curbs obesity

Affiliations

Ventromedial hypothalamic OGT drives adipose tissue lipolysis and curbs obesity

Qi Wang et al. Sci Adv. .

Abstract

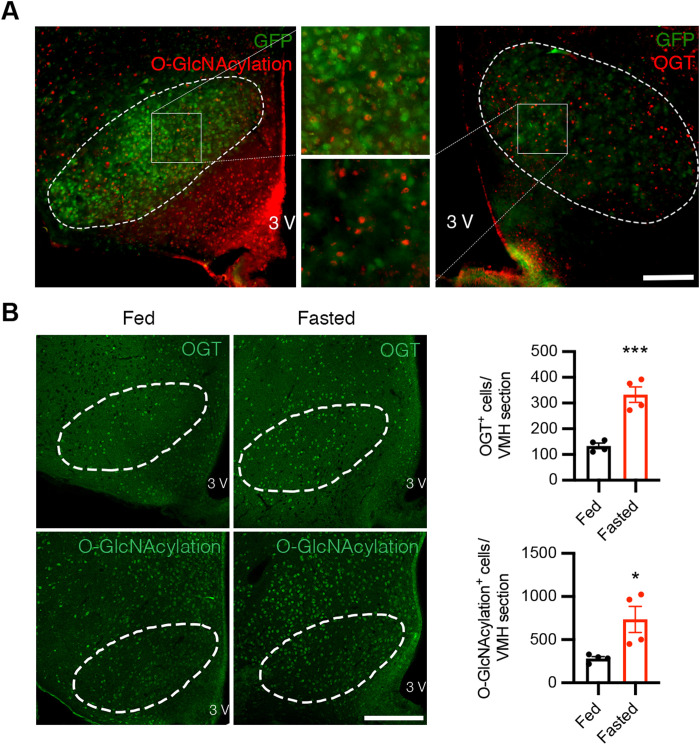
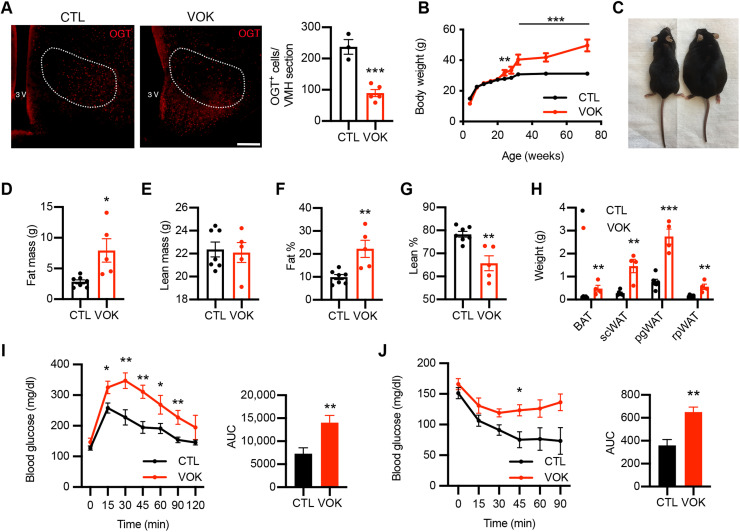
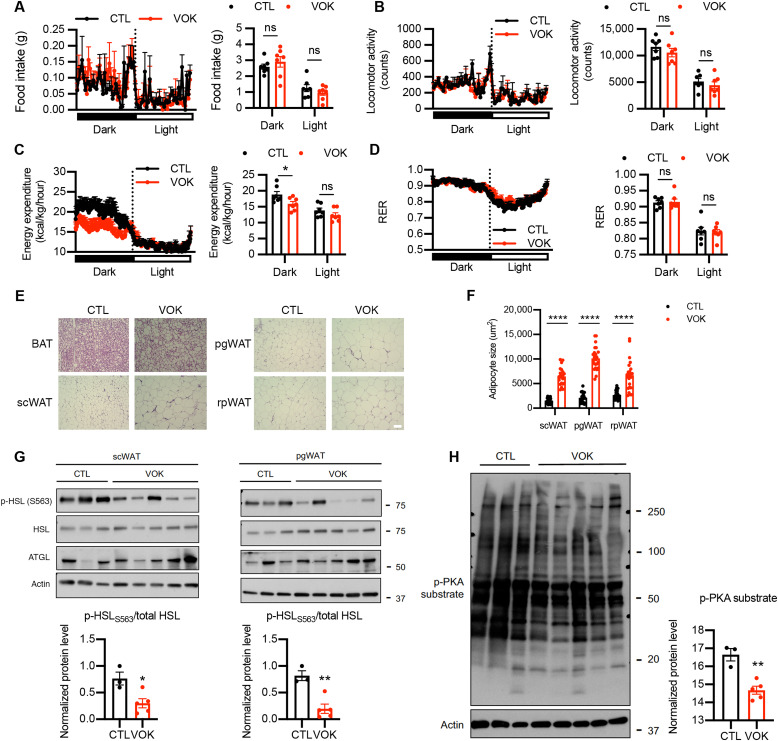
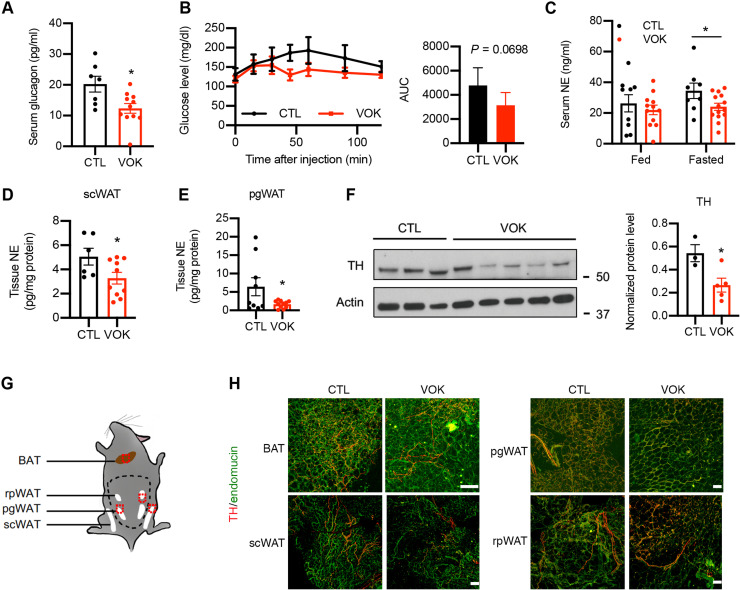
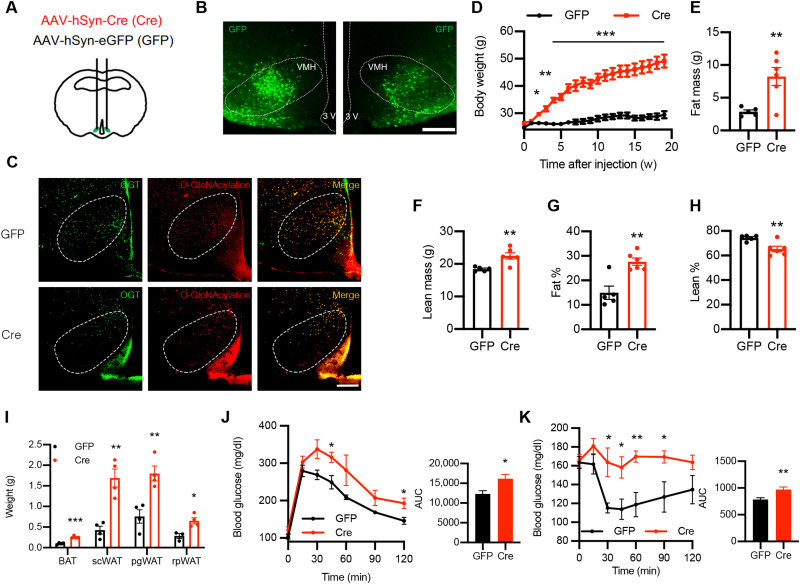
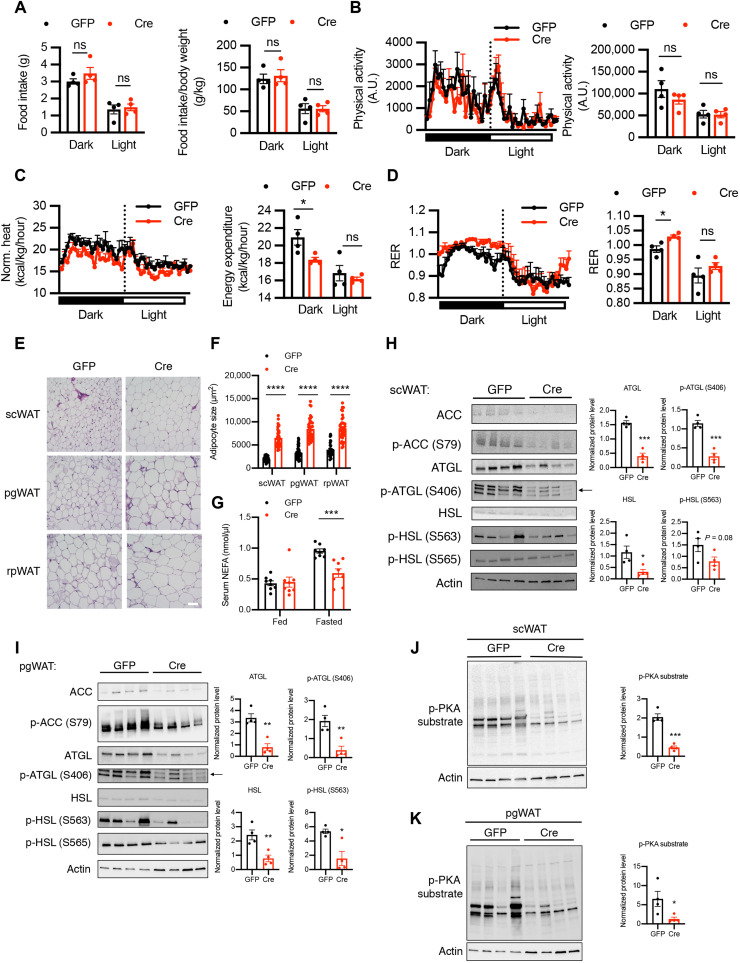
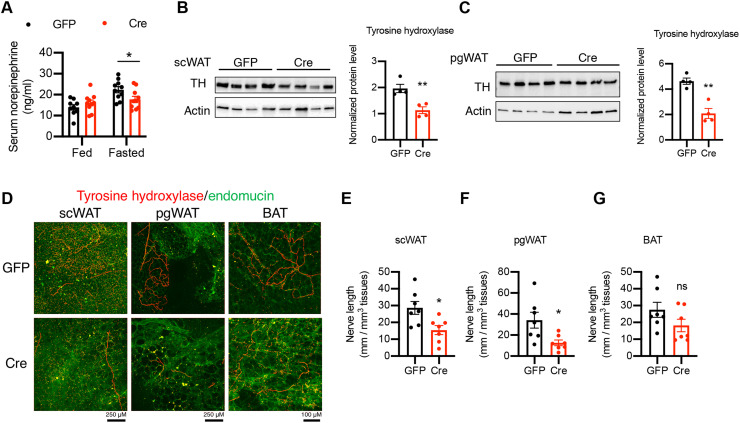
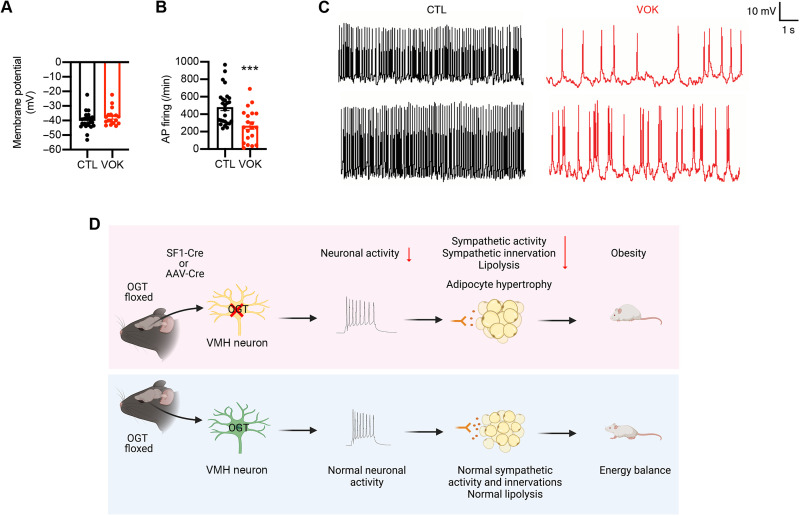
The ventromedial hypothalamus (VMH) is known to regulate body weight and counterregulatory response. However, how VMH neurons regulate lipid metabolism and energy balance remains unknown. O-linked β-d-N-acetylglucosamine (O-GlcNAc) modification (O-GlcNAcylation), catalyzed by O-GlcNAc transferase (OGT), is considered a cellular sensor of nutrients and hormones. Here, we report that genetic ablation of OGT in VMH neurons inhibits neuronal excitability. Mice with VMH neuron-specific OGT deletion show rapid weight gain, increased adiposity, and reduced energy expenditure, without significant changes in food intake or physical activity. The obesity phenotype is associated with adipocyte hypertrophy and reduced lipolysis of white adipose tissues. In addition, OGT deletion in VMH neurons down-regulates the sympathetic activity and impairs the sympathetic innervation of white adipose tissues. These findings identify OGT in the VMH as a homeostatic set point that controls body weight and underscore the importance of the VMH in regulating lipid metabolism through white adipose tissue-specific innervation.


Figures

Fig. 1.
Fig. 1.. Fasting increases OGT expression and O-GlcNAcylation level in the VMH.
(A) Immunostaining of O-GlcNAcylation (left; red) and OGT (right; red) of green fluorescent protein (GFP)–labeled SF1 neurons (green) in the VMH showing colocalization of O-GlcNAcylation/OGT and SF1 in the VMH. Scale bar, 200 μm. (B) Representative immunostaining of OGT (top; green) and O-GlcNAcylation (bottom; green) in the VMH of mice fed ad libitum or fasted for 24 hours. Quantifications of the average OGT/O-GlcNAcylation–positive cells in the VMH are shown on the right. Scale bar, 200 μm. Four mice each for the fed or fasted group were included in the quantifications. Data are shown as means ± SEM. *P < 0.05 and ***P < 0.001 by unpaired Student’s t test.
Fig. 2.
Fig. 2.. Chronic deletion of OGT in SF1 neurons leads to obesity in mice fed a normal chow diet.
(A) Immunostaining of OGT in the VMH of CTL and VOK mice. Quantifications of OGT-positive cells in the VMH are shown on the right. Scale bar, 200 μm. (B) Body weight monitoring of male CTL and VOK mice fed a normal chow diet. (C) Representative image of CTL and VOK mice at 18 months of age. (D) Fat mass of male CTL and VOK mice at 6 months of age. (E) Lean mass of male CTL and VOK mice at 6 months of age. (F) Percentage of fat mass to body weight of male CTL and VOK mice at 6 months of age. (G) Percentage of lean mass to body weight of male CTL and VOK mice at 6 months of age. (H) Weight of different adipose tissues of male CTL and VOK mice at 18 months of age. (I) Glucose tolerance test of male CTL and VOK at 18 months of age. (J) Insulin tolerance test of male CTL and VOK mice at 18 months of age. CTL: n = 6 to 10; VOK: n = 4 to 8. Data are shown as means ± SEM. *P < 0.05, **P < 0.01, and ***P < 0.001 by unpaired Student’s t test. AUC, area under the curve.
Fig. 3.
Fig. 3.. Mice with SF1 neuron-specific OGT deletion show decreased energy expenditure and reduced lipolytic activity of white adipose tissues.
(A to D) Metabolic cage analysis of food intake (A), physical activity (B), energy expenditure (C), and RER (D) of CTL and VOK mice. (E) Hematoxylin and eosin (H&E) staining of BAT, scWAT, pgWAT, and rpWAT of CTL and VOK mice after 6 hours of fasting. Scale bar, 50 μm. (F) Adipocyte sizes in different white adipose tissues of CTL and VOK mice. Individual dots represent individual adipocytes from three CTL and three VOK mice. (G) Western blot of p-HSLS563, HSL, and adipose triglyceride lipase (ATGL) in scWAT and pgWAT of CTL and VOK mice after 6 hours of fasting. Densitometric quantifications for the ratio of p-HSLS563 to total HSL are shown below. (H) Western blot of p-PKA substrate in scWAT of CTL and VOK mice after 6 hours of fasting. Densitometric quantification is shown on the right. CTL: n = 7 and VOK: n = 7 for the quantifications of the metabolic cage analysis. CTL: n = 3 and VOK: n = 5 for the representative traces of the metabolic cage analysis. Mice were aged 19 to 20 weeks before the body weight divergence. Data are shown as means ± SEM. *P < 0.05, **P < 0.01, and ****P < 0.0001 by unpaired Student’s t test. ns, not significant.
Fig. 4.
Fig. 4.. Mice with SF1 neuron-specific OGT deletion show reduced activity of the sympathetic nervous system and impaired sympathetic innervation of scWAT.
(A) Serum glucagon levels of CTL and VOK mice after 15 hours of fasting. (B) Blood glucose levels of CTL and VOK mice after 2DG challenge. Quantification is shown on the right. (C) Serum norepinephrine levels of CTL and VOK mice fed ad libitum and after 15 hours of fasting. (D and E) Tissue norepinephrine levels in scWAT (D) and pgWAT (E) of CTL and VOK mice after 6 hours of fasting. (F) Western blot of tyrosine hydroxylase (TH) in scWAT of CTL and VOK mice after 6 hours of fasting. Densitometric quantification is shown on the right. (G) Workflow showing the process of tissue immunostaining of TH in adipose tissues of CTL and VOK mice at 7 months of age. Red dotted squares indicate the 2-mm3 tissue cubes used for immunostaining. (H) Representative immunostaining of TH (red) and endomucin (green) in BAT, scWAT, pgWAT, and rpWAT of CTL and VOK mice fed ad libitum. Scale bars, 100 μm. CTL: n = 7 to 9 and VOK: n = 10 to 15 for glucagon and norepinephrine enzyme-linked immunosorbent assay. CTL: n = 4 and VOK: n = 5 for the 2DG challenge. CTL: n = 3 and VOK: n = 3 for tissue immunostaining. Mice were fed a normal chow diet. The experiments were performed on CTL and VOK mice aging 14 to 20 weeks before body weight divergence. Data are shown as means ± SEM. *P < 0.05 by unpaired Student’s t test.
Fig. 5.
Fig. 5.. Acute deletion of OGT in VMH neurons leads to obesity in mice fed a normal chow diet.
(A) Schematic showing the generation of control (GFP) and VMH neuron-specific OGT knockout (Cre) mice by stereotaxically injecting AAV-GFP or AAV-Cre bilaterally into the VMH of male Ogtflox mice at 12 weeks of age. (B) Confirmation of the AAV injection coordinate. Scale bar, 200 μm. (C) Validation of OGT deletion and reduction of O-GlcNAcylation level in the VMH of Cre mice. Scale bar, 200 μm. OGT was imaged using Alexa Fluor 647 with the green pseudo-color. (D) Body weight monitoring of GFP and Cre mice fed a normal chow diet. (E) Fat mass of GFP and Cre mice 4 weeks after stereotaxic virus injection. (F) Lean mass of GFP and Cre mice 4 weeks after stereotaxic virus injection. (G) Percentage of fat mass to body weight of GFP and Cre mice 4 weeks after stereotaxic virus injection. (H) Percentage of lean mass to body weight of GFP and Cre mice 4 weeks after stereotaxic virus injection. (I) Weight of different adipose tissues of GFP and Cre mice 32 weeks after stereotaxic virus injection. (J) Glucose tolerance test of GFP and Cre mice 5 weeks after stereotaxic virus injection. (K) Insulin tolerance test of GFP and Cre mice 6 weeks after stereotaxic virus injection. GFP: n = 8 and Cre: n = 8 for body weight monitoring. GFP: n = 4 and Cre: n = 4 for body composition measurements, weights of adipose tissues, glucose, and insulin tolerance test. Data are shown as means ± SEM. *P < 0.05, **P < 0.01, and ***P < 0.001 by unpaired Student’s t test.
Fig. 6.
Fig. 6.. Mice with acute deletion of OGT in VMH neurons show reduced energy expenditure and adipocyte hypertrophy associated with reduced lipolysis of white adipose tissues.
(A to D) Metabolic cage analysis of food intake (A), physical activity (B), energy expenditure (C), and RER (D) of GFP and Cre mice 2 weeks after stereotaxic virus injection before body weight divergence. (E) H&E staining of scWAT, pgWAT, and rpWAT of CTL and VOK mice after 6 hours of fasting. Scale bar, 100 μm. (F) Adipocyte sizes in different white adipose tissues of CTL and VOK mice. Individual dots represent individual adipocytes from three GFP and four Cre mice. (G) Serum nonesterified fatty acid (NEFA) levels of GFP and Cre mice fed ad libitum and after 15 hours of fasting. (H and I) Western blot of acetyl-CoA carboxylase (ACC), p-ACC (S79), ATGL, p-ATGL (S406), HSL, p-HSL (S563), and p-HSL (S565) in scWAT (H) and pgWAT (I) of GFP and Cre mice after 6 hours of fasting. Densitometric quantifications for the expression levels of ATGL, p-ATGL (S406), HSL, and p-HSL (S563) are shown on the right. (J and K) Western blot of p-PKA substrate in scWAT (J) and pgWAT (K) of GFP and Cre mice after 6 hours of fasting. Densitometric quantification is shown below. GFP: n = 4 and Cre: n = 4 for metabolic cage analysis. GFP: n = 8 to 10 and Cre: n = 8 to 10 for serum NEFA. Data are shown as means ± SEM. *P < 0.05, **P < 0.01, ***P < 0.001, and ****P < 0.0001 by unpaired Student’s t test. A.U., arbitrary units.
Fig. 7.
Fig. 7.. Mice with acute deletion of OGT in VMH neurons show reduced sympathetic activity and sympathetic innervations of white adipose tissues.
(A) Serum norepinephrine levels of GFP and Cre mice fed ad libitum and after 15 hours of fasting. (B and C) Western blot of TH in scWAT (B) and pgWAT (C) of GFP and Cre mice after 6 hours of fasting. Densitometric quantification is shown on the right. (D to G) Representative immunostaining of TH (red) and endomucin (green) in scWAT, pgWAT, and BAT of GFP and Cre mice fed a normal chow diet ad libitum (D) and corresponding quantifications (E to G) from three GFP mice and four Cre mice 10 weeks after virus injection. GFP: n = 8 to 10 and Cre: n = 8 to 10 for serum NEFA and norepinephrine levels. Data are shown as means ± SEM. *P < 0.05 and **P < 0.01 by unpaired Student’s t test.
Fig. 8.
Fig. 8.. OGT is required for the neuronal activity of the VMH.
(A) Basal membrane potential of SF1 neurons in CTL and VOK mice. (B) Firing rate of SF1 neurons in CTL and VOK mice. (C) Representative traces of action potentials of SF1 neurons in CTL and VOK mice. (D) The role of OGT in VMH neurons to regulate energy balance and white adipose tissue lipolysis. SF1 neurons from 5- to 7-week-old age-matched male CTL and VOK mice fed ad libitum on a normal chow diet were collected for electrophysiology. CTL SF1 neurons: n = 26 and VOK SF1 neurons: n = 20. Data are shown as means ± SEM. ***P < 0.001 by unpaired Student’s t test.

References

    1. Morton G. J., Cummings D. E., Baskin D. G., Barsh G. S., Schwartz M. W., Central nervous system control of food intake and body weight. Nature 443, 289–295 (2006). - PubMed
    1. Myers M. G. Jr., Olson D. P., Central nervous system control of metabolism. Nature 491, 357–363 (2012). - PubMed
    1. Roh E., Song D. K., Kim M.-S., Emerging role of the brain in the homeostatic regulation of energy and glucose metabolism. Exp. Mol. Med. 48, e216 (2016). - PMC - PubMed
    1. Schwartz M. W., Woods S. C., Porte D. Jr., Seeley R. J., Baskin D. G., Central nervous system control of food intake. Nature 404, 661–671 (2000). - PubMed
    1. Stemmer K., Müller T. D., DiMarchi R. D., Pfluger P. T., Tschöp M. H., CNS-targeting pharmacological interventions for the metabolic syndrome. J. Clin. Invest. 129, 4058–4071 (2019). - PMC - PubMed

Substances