. 2022 Sep 2;8(35):eabo7958.
doi: 10.1126/sciadv.abo7958. Epub 2022 Aug 31.

JAG1-NOTCH4 mechanosensing drives atherosclerosis

Affiliations

JAG1-NOTCH4 mechanosensing drives atherosclerosis

Celine Souilhol et al. Sci Adv. .

Abstract

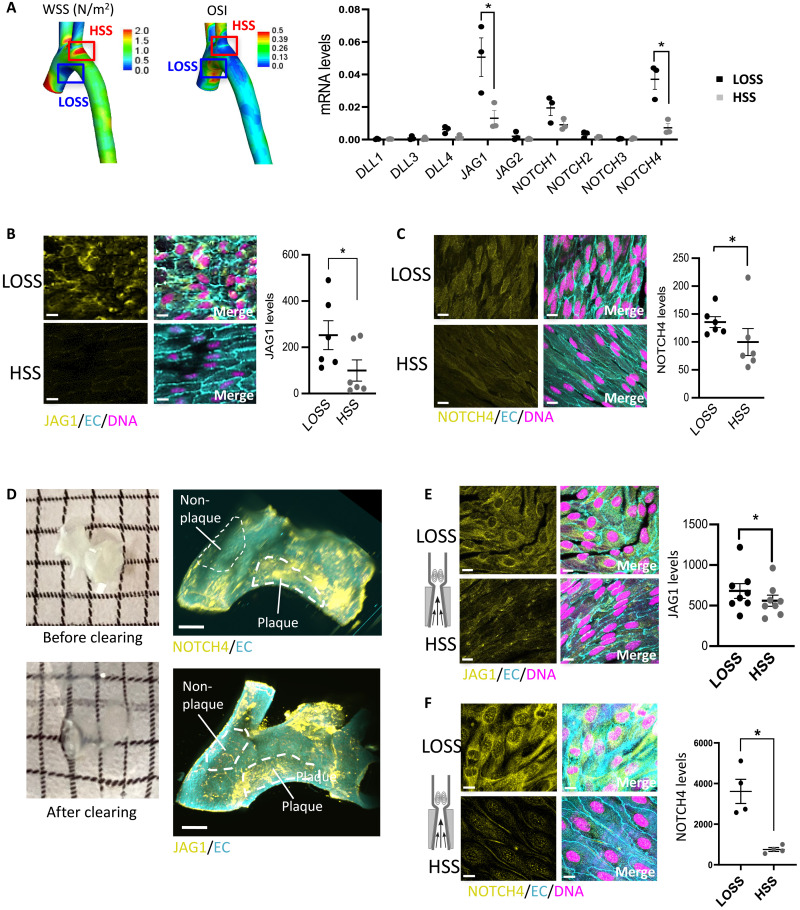
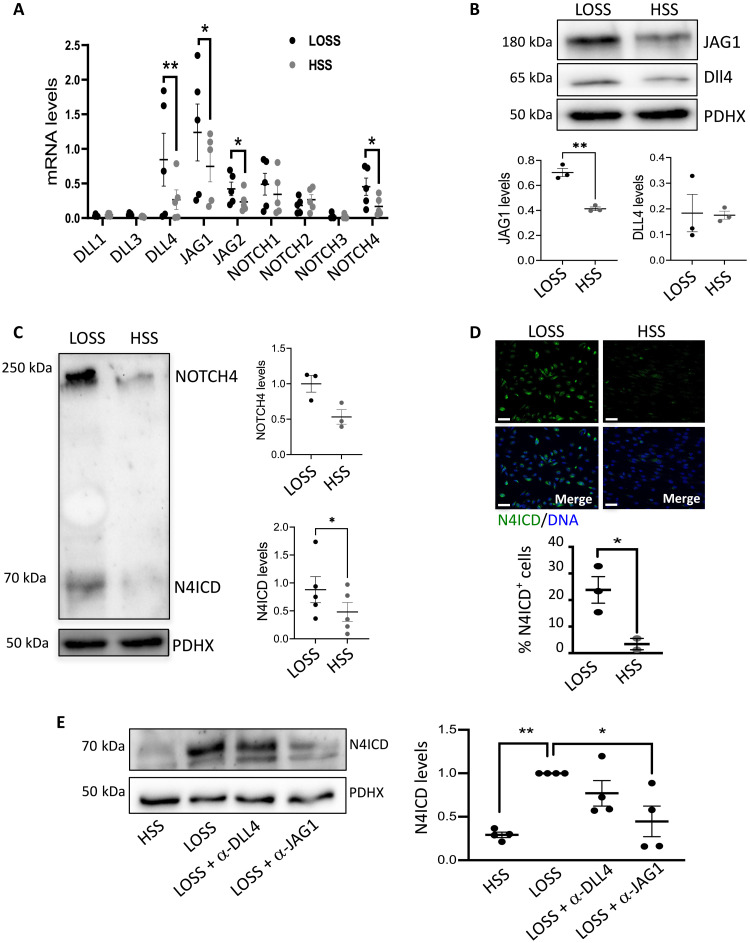
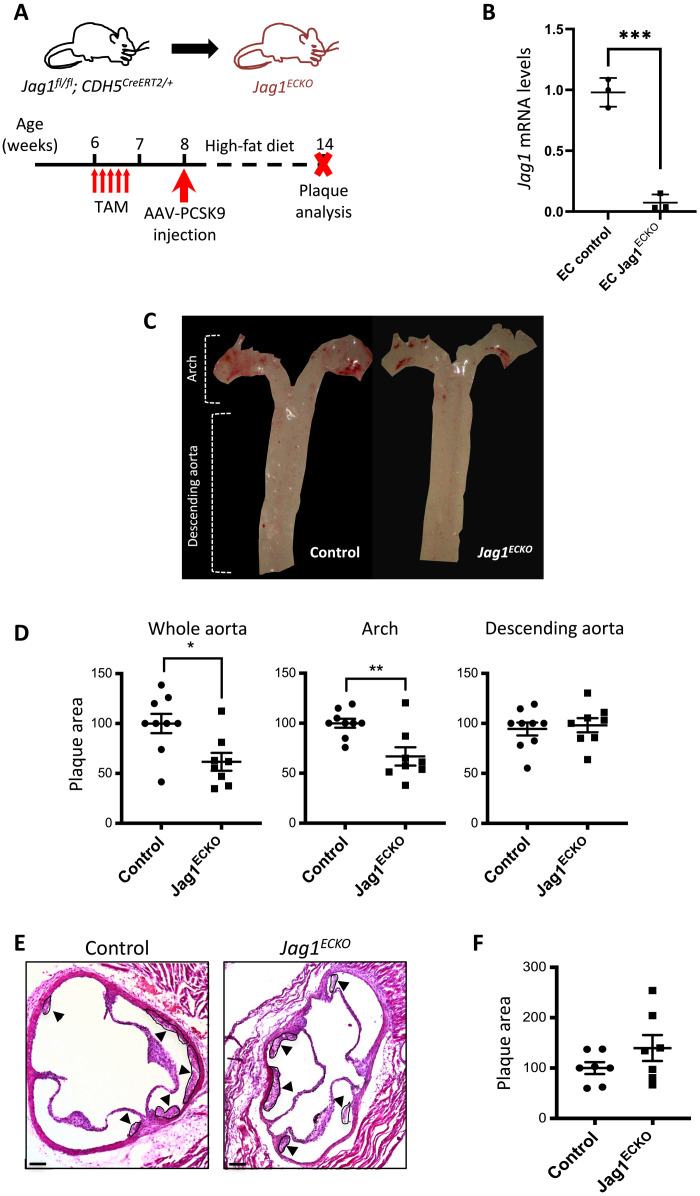
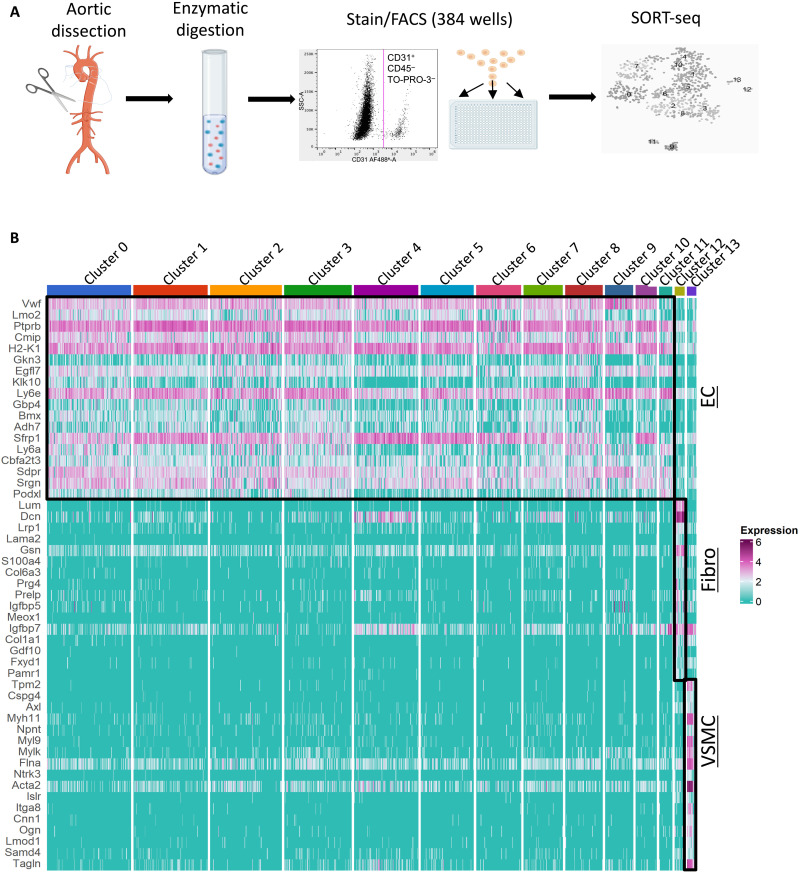
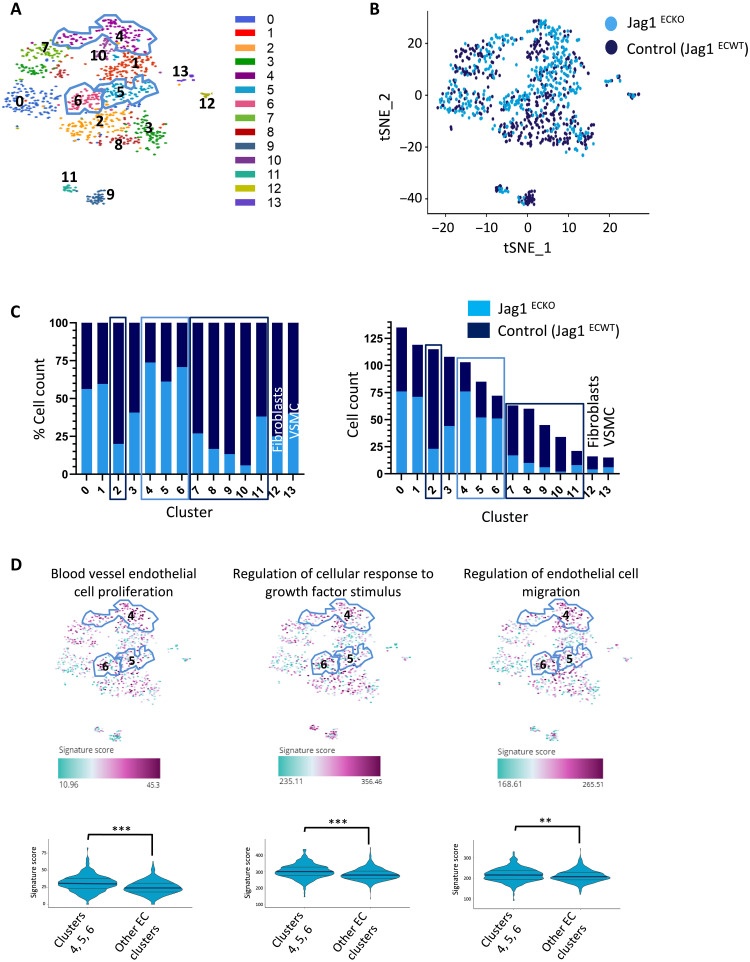
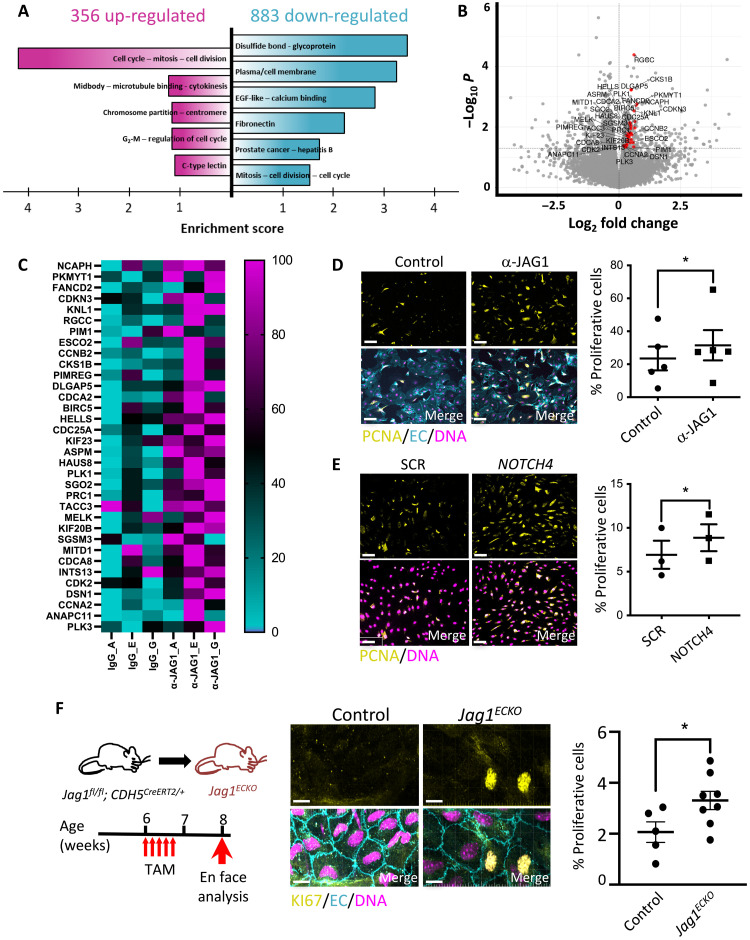
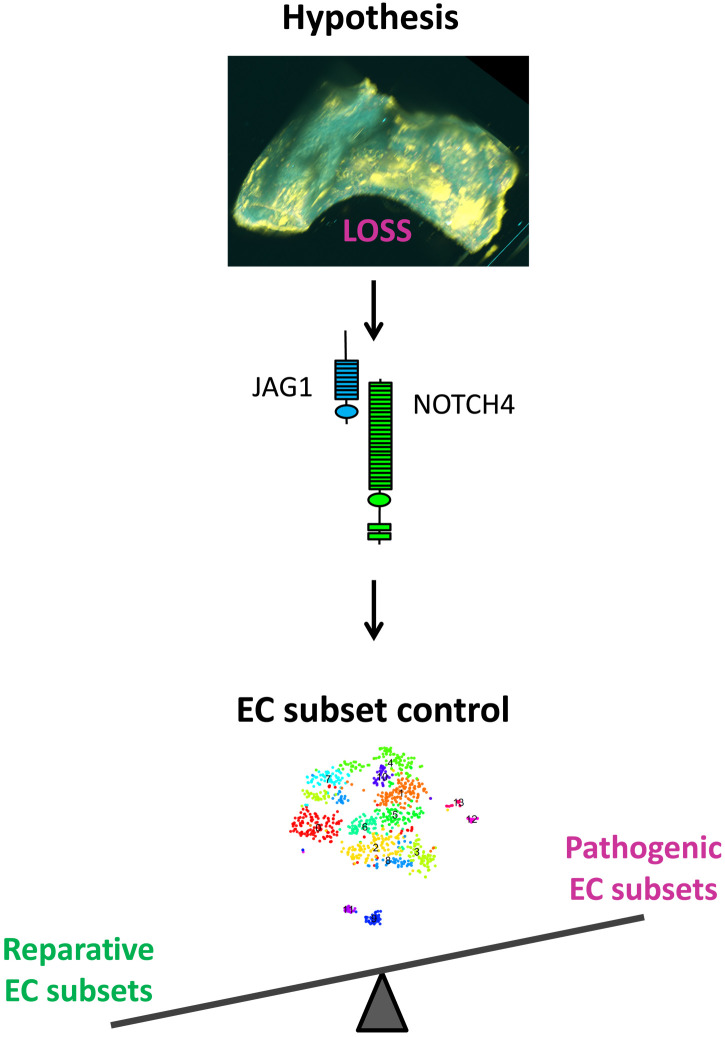
Endothelial cell (EC) sensing of disturbed blood flow triggers atherosclerosis, a disease of arteries that causes heart attack and stroke, through poorly defined mechanisms. The Notch pathway plays a central role in blood vessel growth and homeostasis, but its potential role in sensing of disturbed flow has not been previously studied. Here, we show using porcine and murine arteries and cultured human coronary artery EC that disturbed flow activates the JAG1-NOTCH4 signaling pathway. Light-sheet imaging revealed enrichment of JAG1 and NOTCH4 in EC of atherosclerotic plaques, and EC-specific genetic deletion of Jag1 (Jag1ECKO) demonstrated that Jag1 promotes atherosclerosis at sites of disturbed flow. Mechanistically, single-cell RNA sequencing in Jag1ECKO mice demonstrated that Jag1 suppresses subsets of ECs that proliferate and migrate. We conclude that JAG1-NOTCH4 sensing of disturbed flow enhances atherosclerosis susceptibility by regulating EC heterogeneity and that therapeutic targeting of this pathway may treat atherosclerosis.


Figures

Fig. 1.
Fig. 1.. JAG1 and NOTCH4 are enriched at atheroprone sites.
(A) ECs were isolated from LOSS versus HSS regions of the porcine aorta based on models of time-averaged wall shear stress (WSS) (left) and oscillatory shear index (OSI; center). Shear stress maps were adapted from (18). The expression of Notch receptors and ligands was quantified in each population by qRT-PCR (n = 3). (B and C) Aortic arches were isolated from C57BL/6 mice, and en face immunostainings were performed using anti-JAG1 (B) or anti-NOTCH4 (C) antibodies (yellow). Endothelium was costained (anti-CDH5 or anti-CD31; EC; cyan), and nuclei were detected using TO-PRO-3 (DNA; magenta). The graphs on the right represent the yellow mean fluorescence intensity (n = 6). (D) Aortic arches were isolated from ApoE−/− mice exposed to a high-fat diet for 6 weeks. Samples were optically cleared before immunofluorescence staining using anti-NOTCH4 (top) or anti-JAG1 (bottom) antibodies (yellow). Endothelium was costained (anti-CDH5; EC; cyan). Representative light-sheet images are shown with plaque areas and nonplaque areas delineated. (E and F) Flow-altering, constrictive cuffs were placed on the right carotid arteries of C57BL/6 mice. They generated anatomically distinct regions exposed to HSS and LOSS. Carotid arteries were harvested after 14 days, and en face staining was performed using anti-JAG1 (E) or anti-NOTCH4 (F) antibodies (yellow). Endothelium was costained (anti-CDH5; EC; cyan), and nuclei were detected using TO-PRO-3 (DNA; magenta). Representative images and quantification of JAG1 (n = 8 mice) or NOTCH4 (n = 4 mice) expression are shown. Differences between means were analyzed using paired t tests. Scale bars, 10 μm.
Fig. 2.
Fig. 2.. JAG1-NOTCH4 pathway is induced by LOSS in vitro.
HCAECs from individual donors were seeded on μ-slides and cultured under LOSS or HSS for 72 hours using the Ibidi system. (A) Expression levels of Notch receptors and ligands were quantified by qRT-PCR (n = 5). Protein levels of JAG1 and DLL4 (B) or levels of total NOTCH4 and the activated forms of NOTCH4 (N4ICD) (C) were quantified by immunoblotting with normalization to the level of pyruvate dehydrogenase complex component X (PDHX) (n = 3 or n = 5). Representative images are shown. (D) Protein levels of N4ICD were quantified by immunofluorescence staining with costaining of nuclei using TO-PRO-3 (DNA). Representative images are shown, and the percentage of N4ICD-positive nuclei was calculated (n = 3). Scale bars, 50 μm. (E) HCAECs were cultured under LOSS or HSS for 72 hours using the ibidi system in the presence or absence of blocking antibodies against JAG1 or DLL4. Protein levels of N4ICD were analyzed by immunoblotting and normalized to the level of PDHX (n = 4). Representative images are shown. Differences between means were analyzed by analysis of variance (ANOVA).
Fig. 3.
Fig. 3.. Loss of endothelial Jag1 decreases plaque development in the aortic arch.
(A) Timeline of Jag1 deletion in a model of hypercholesterolemia. Jag1fl/fl CDH5CreERT2/+ (Jag1ECKO) mice aged 6 weeks and littermates lacking Cre (Jag1fl/fl CDH5+/+; controls) received five intraperitoneal injections of tamoxifen (TAM) and one injection of AAV-PCSK9 virus at specified time points. After 6 weeks fed with high-fat diet, the mice were culled, and plaque area was quantified. (B) Validation of Jag1 deletion. Jag1 RNA was quantified in aortae isolated from Jag1ECKO mice (n = 3) and littermate controls lacking Cre 2 weeks after tamoxifen by endothelial RNA extraction and qRT-PCR. (C) Representative images of aortas stained with Oil Red O. (D) Quantification of plaque burden in the whole aorta, arch, and descending aorta was determined by calculating the percentage of aortic surface area covered by plaque for Jag1ECKO mice (n = 8) and littermate controls (n = 9). Representative images with plaque indicated (arrowheads) (E) and quantification of plaque burden (F) in the aortic roots of controls and Jag1ECKO mice. In all graphs, each data point represents one mouse, and means ± SEM are shown. Differences between means were analyzed using an unpaired t test. Scale bars, 100 μm.
Fig. 4.
Fig. 4.. scRNA-seq identification of EC subsets.
(A) Schematic overview of scRNA-seq workflow. Jag1ECKO and control (Jag1ECWT) mouse aortas were dissected from the aortic root to the iliac artery and enzymatically digested to generate single-cell suspensions. After antibody staining, CD31+, CD45, and TO-PRO-3 cells were sorted into 384-well plates using FACS. scRNA-seq libraries were generated and sequenced using the SORT-seq method. (B) Aortas from Jag1ECKO and control mice were analyzed by FACS of CD31+ CD45 cells coupled to scRNA-seq. Heatmap showing the most highly differentially expressed genes for each cluster. Twelve distinct clusters (0 to 11) defined as ECs exhibit common expression of several markers including the canonical markers Vwf and Cdh5. Cluster 13 expresses several canonical VSMC markers including Myh11, Acta2, and Cnn1 and were therefore defined as VSMCs. Cluster 12 cells present higher expression of collagens/collagen-binding proteins (Col1a1, Dcn, and Lum), as well as reduced expression of VSMC-related proteins (Myh11 and Cnn1), and were therefore defined as fibroblasts. Fibro, fibroblasts.
Fig. 5.
Fig. 5.. scRNA-seq analysis of Jag1-regulated endothelial heterogeneity.
Aortas from Jag1ECKO and control mice were analyzed by FACS of CD31+ CD45 cells coupled to scRNA-seq. (A) t-SNE representation of single-cell transcriptomes from Jag1ECKO and control mice colored by cluster assignment. Clusters were identified using unbiased hierarchical clustering. (B) t-SNE showing the cell contribution of Jag1ECKO and control mice to each subpopulation. (C) Bar graph showing the cell distribution of Jag1ECKO and control mice across cell clusters, by percentage (left) and number of cells (right). Clusters 4 to 6 are largely composed of ECs derived from Jag1ECKO mice, whereas cluster 2 and 7 to 11 are mainly composed of ECs derived from control mice. (D) Representation of enriched GO pathways on the t-SNE map. An overall score summarizing the expression of genes in each GO pathway is calculated for every cell in the scRNA-seq dataset. Differences between means were calculated using a Wilcoxon signed-rank test.
Fig. 6.
Fig. 6.. JAG1 activation by LOSS leads to inhibition of endothelial repair.
(A to C) HCAECs were exposed to LOSS and treated with α-JAG1 blocking antibody or control isotype-matched antibodies for 48 hours before bulk RNA-seq. (A) Functional annotation clustering of the genes up-regulated (in magenta) and down-regulated (in cyan) in response to α-JAG1 (P < 0.05) using DAVID. Clusters with the highest enrichment score are shown. EGF, epidermal growth factor. (B) Genes associated with cell cycle are up-regulated following blockade with α-JAG1. Volcano plot displaying differentially expressed genes between JAG1 blockade and control samples. The y axis is the mean expression value of −log10 (P value), and the x axis displays the log2 fold change value. Significantly differentially expressed genes with a functional enrichment for the cell cycle are labeled and highlighted in red. (C) Heatmap showing the expression of proliferation-associated genes. Gene expression levels were normalized so that the highest expression is set to 100% and the lowest expression to 0 (n = 3). HCAECs were treated with α-JAG1 blocking antibody or control isotype-matched antibodies (n = 5) (D) or were treated with NOTCH4 siRNA or with scrambled nontargeting sequences (SCR; n = 3) (E). Cultures were exposed to LOSS for 72 hours, and proliferation was quantified by immunofluorescence staining using antibodies against proliferating cell nuclear antigen (PCNA) (yellow). Differences between means were analyzed using paired t tests. Scale bars, 50 μm. (F) EC proliferation at an LOSS region of the aorta (inner curvature of arch) was quantified in control (n = 5) versus Jag1ECKO (n = 8) mice 2 weeks after tamoxifen injection by en face immunostaining using antibodies against Ki67 (yellow). Endothelium was costained (anti-CDH5; EC; cyan), and nuclei were detected using 4′,6-diamidino-2-phenylindole (DNA; magenta). Representative images are shown. The proportion of proliferative Ki67-positive cells (center) and the average total cell count per field of view (right) were calculated. Differences between means were analyzed using unpaired t test. Scale bars, 10 μm.
Fig. 7.
Fig. 7.. Hypothesis for JAG1-NOTCH4 control of reparative endothelial subsets in atherosclerosis.
We hypothesize that LOSS activates JAG1-NOTCH4 signaling, which promotes atherosclerosis by altering the balance of reparative and pathogenic EC subsets.

References

    1. Souilhol C., Serbanovic-Canic J., Fragiadaki M., Chico T. J., Ridger V., Roddie H., Evans P. C., Endothelial responses to shear stress in atherosclerosis: A novel role for developmental genes. Nat. Rev. Cardiol. 17, 52–63 (2019). - PubMed
    1. Brown A. J., Teng Z. Z., Evans P. C., Gillard J. H., Samady H., Bennett M. R., Role of biomechanical forces in the natural history of coronary atherosclerosis. Nat. Rev. Cardiol. 13, 210–220 (2016). - PubMed
    1. Kwak B. R., Bäck M., Bochaton-Piallat M. L., Caligiuri G., Daemens M., Davies P. F., Hoefer I. E., Holvoet P., Jo H., Krams R., Lehoux S., Monaco C., Steffens S., Virmani R., Weber C., Wentzel J. J., Evans P. C., Biomechanical factors in atherosclerosis: Mechanisms and clinical implications. Eur. Heart J. 35, 3013–3020, 3020a-3020d (2014). - PMC - PubMed
    1. Evans P. C., Fragiadaki M., Morris P. D., Serbanovic-Canic J., Shear stress: The dark energy of atherosclerotic plaques. Cardiovasc. Res. 117, 1811–1813 (2020). - PMC - PubMed
    1. Artavanis-Tsakonas S., Rand M. D., Lake R. J., Notch signaling: Cell fate control and signal integration in development. Science 284, 770–776 (1999). - PubMed